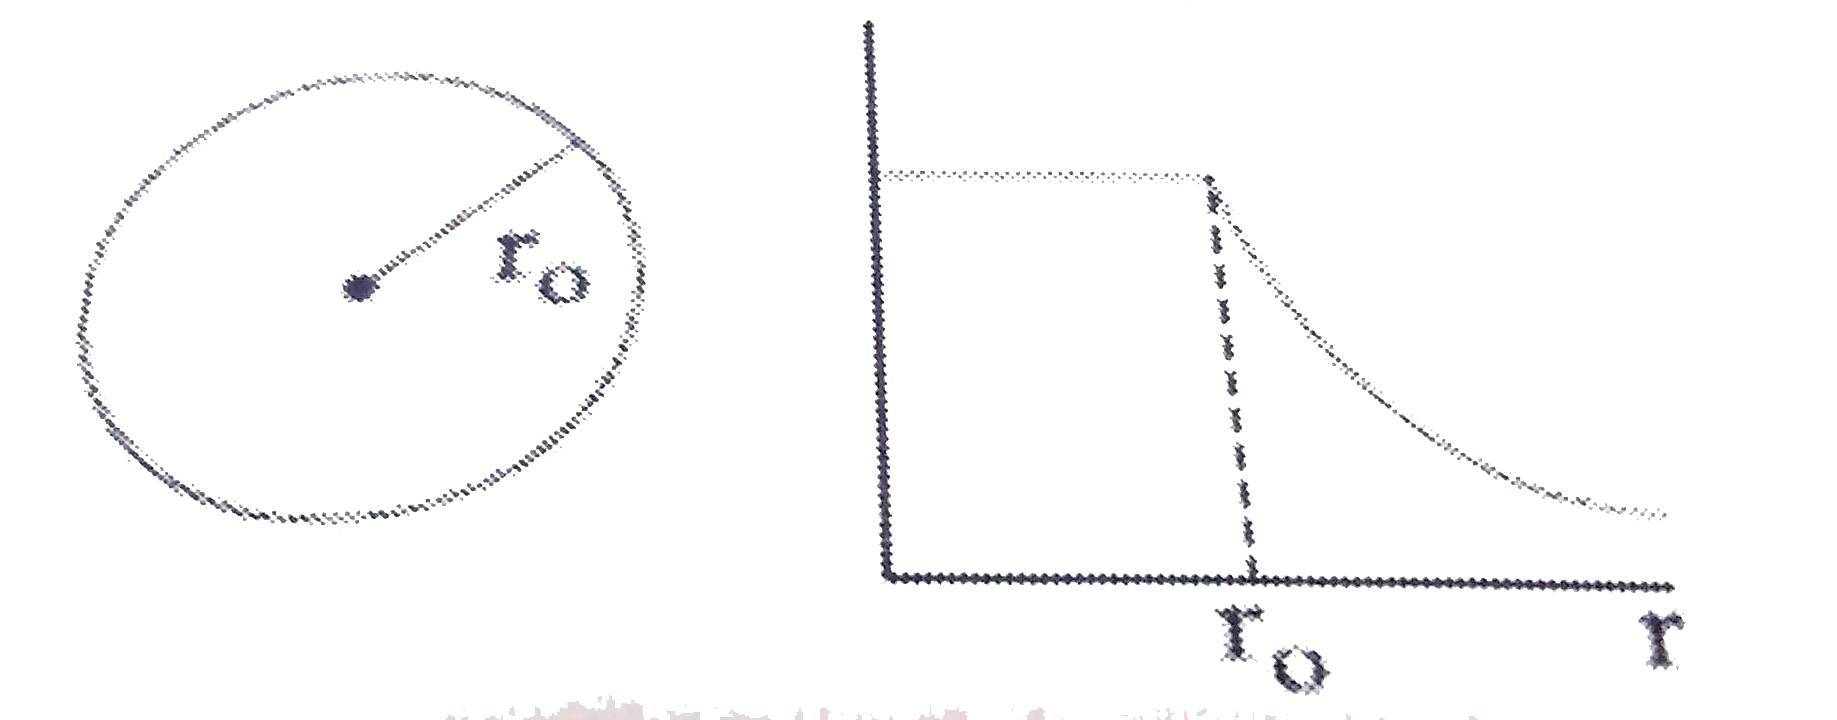
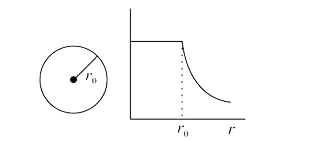
The given graph shows variation (with distance r from centre) of:
Potential of a uniformly charged sphere
Electric field of a uniformly charged sphere
Potential of a uniformly charged spherical shell
Electric field of a uniformly charged spherical shell
The correct Answer is:C
Step by step video & image solution for The given graph shows variation (with distance r from centre) of: by Physics experts to help you in doubts & scoring excellent marks in Class 12 exams.
Updated on:21/07/2023Similar Questions
Knowledge Check
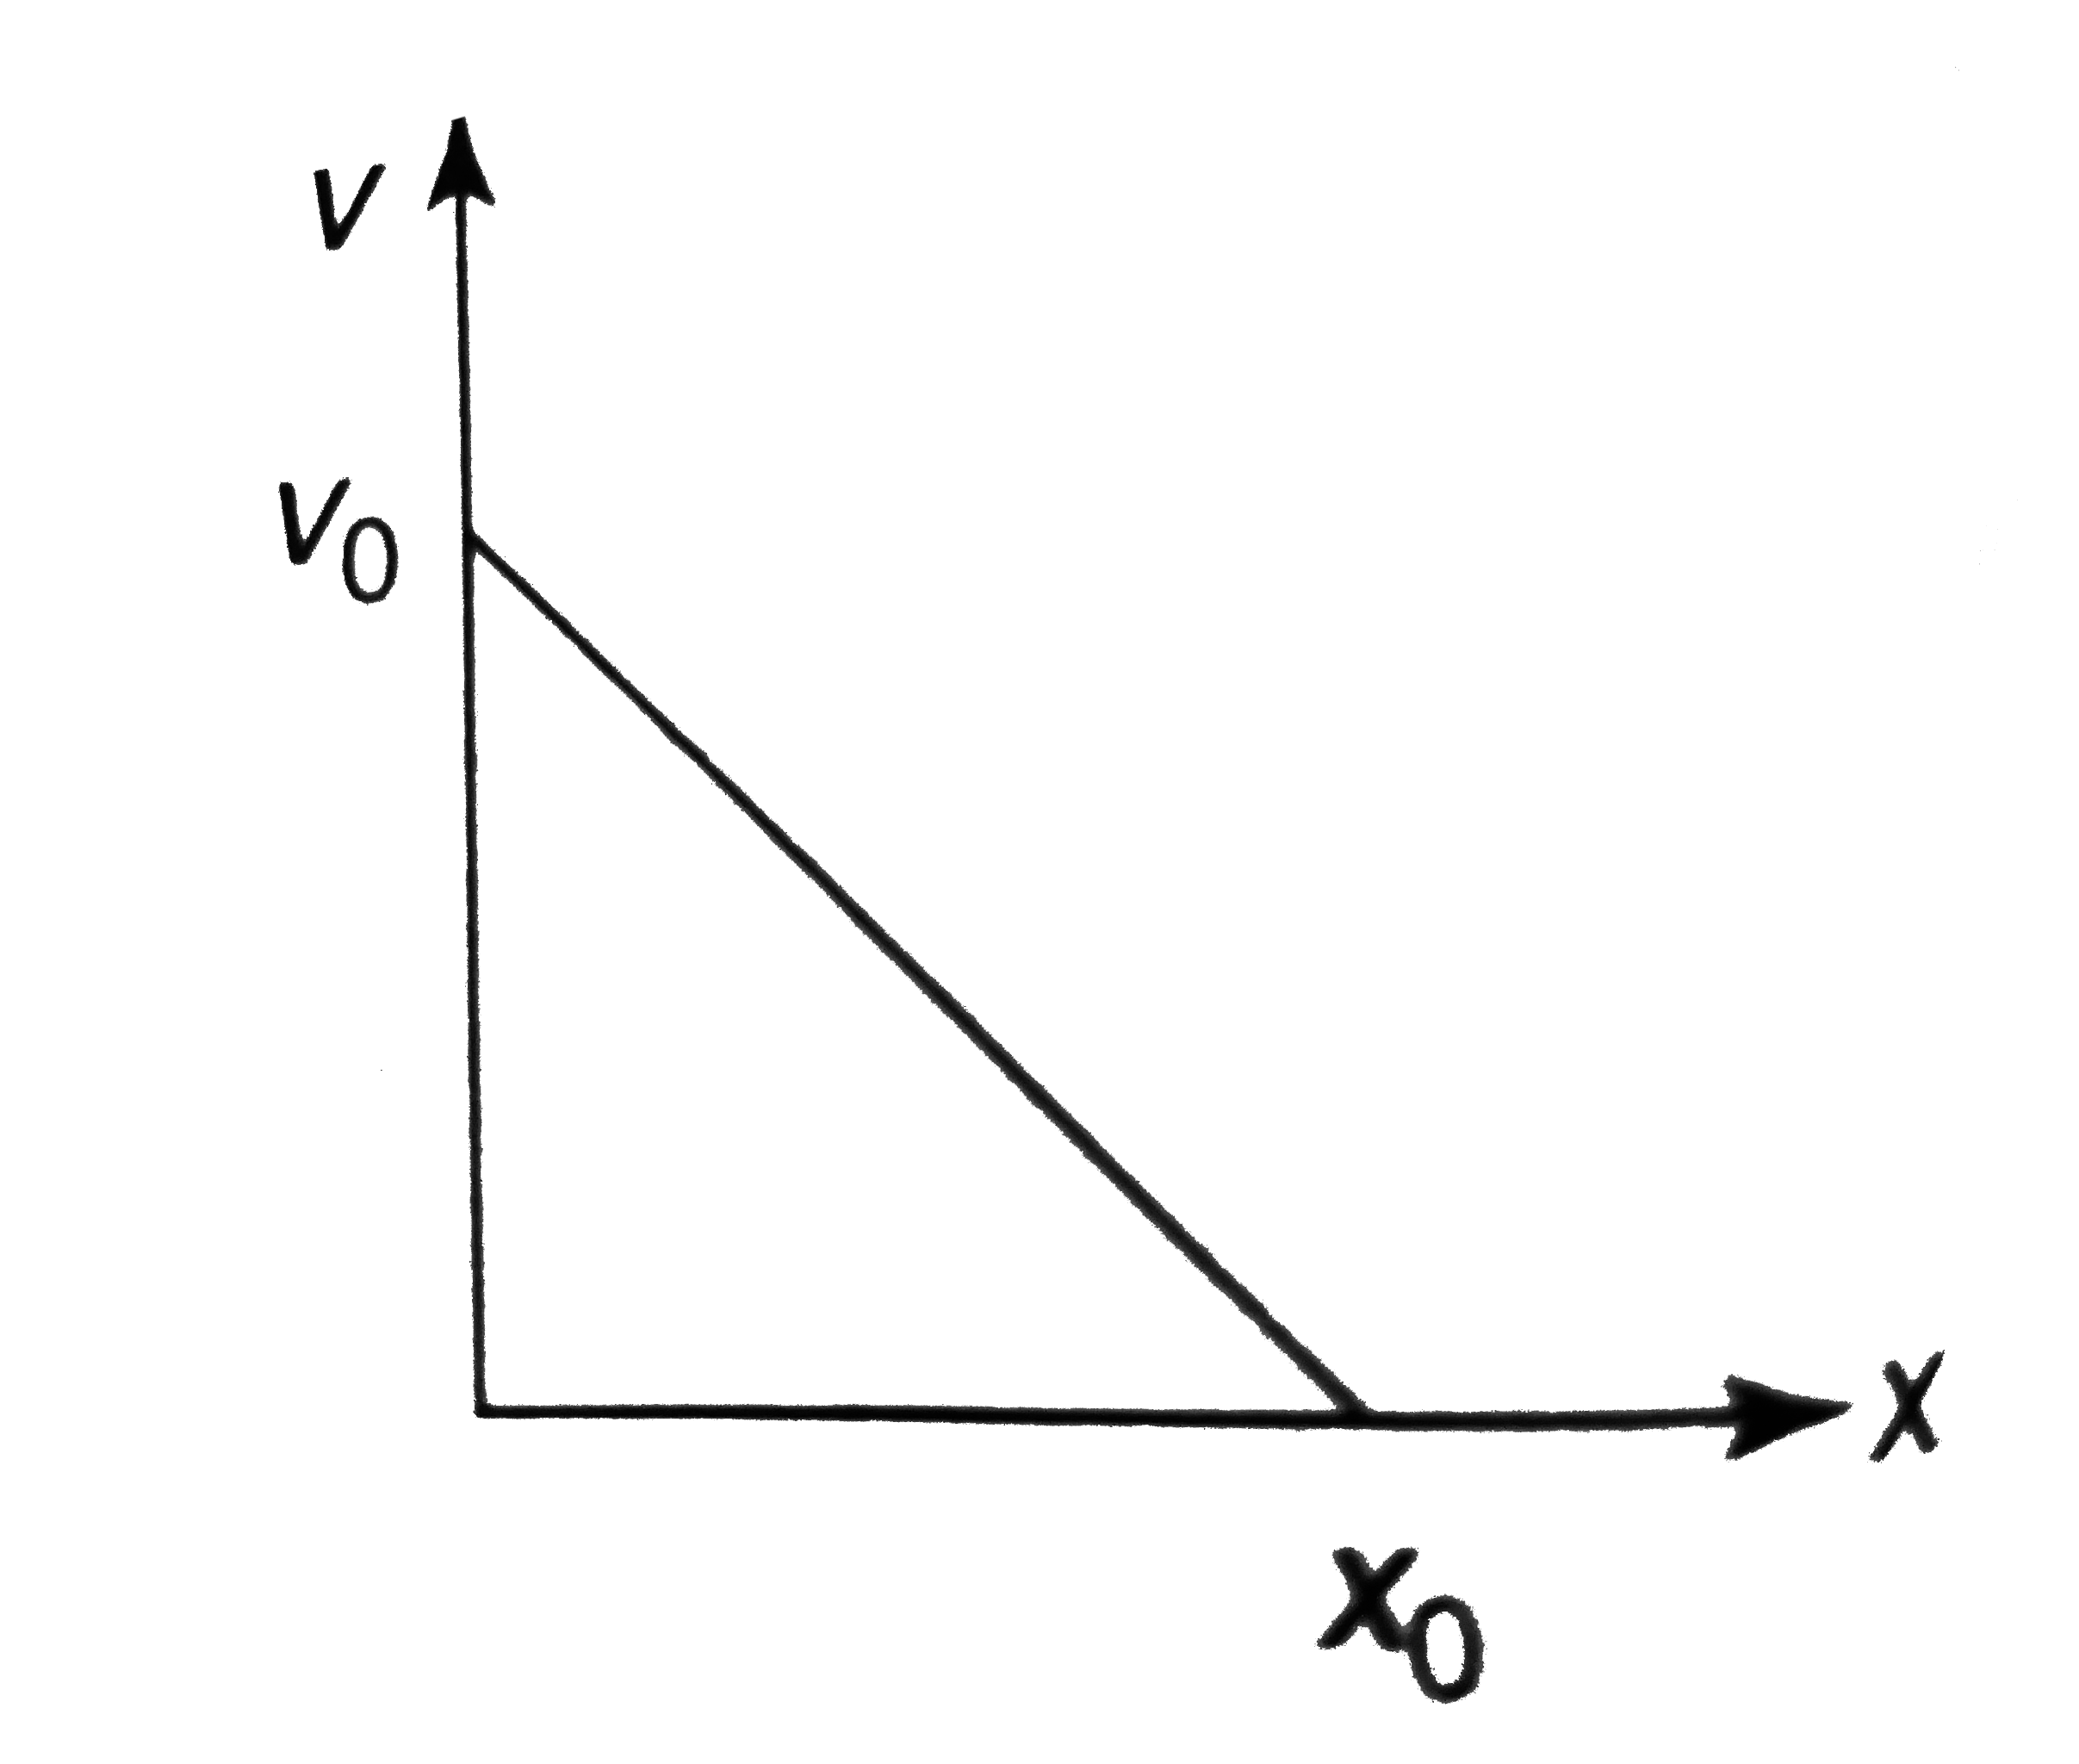
The given graph shows the variation of velocity with displacement. Which one of the graphs given below correctly represents the variation of acceleration with displacement ?
 A
A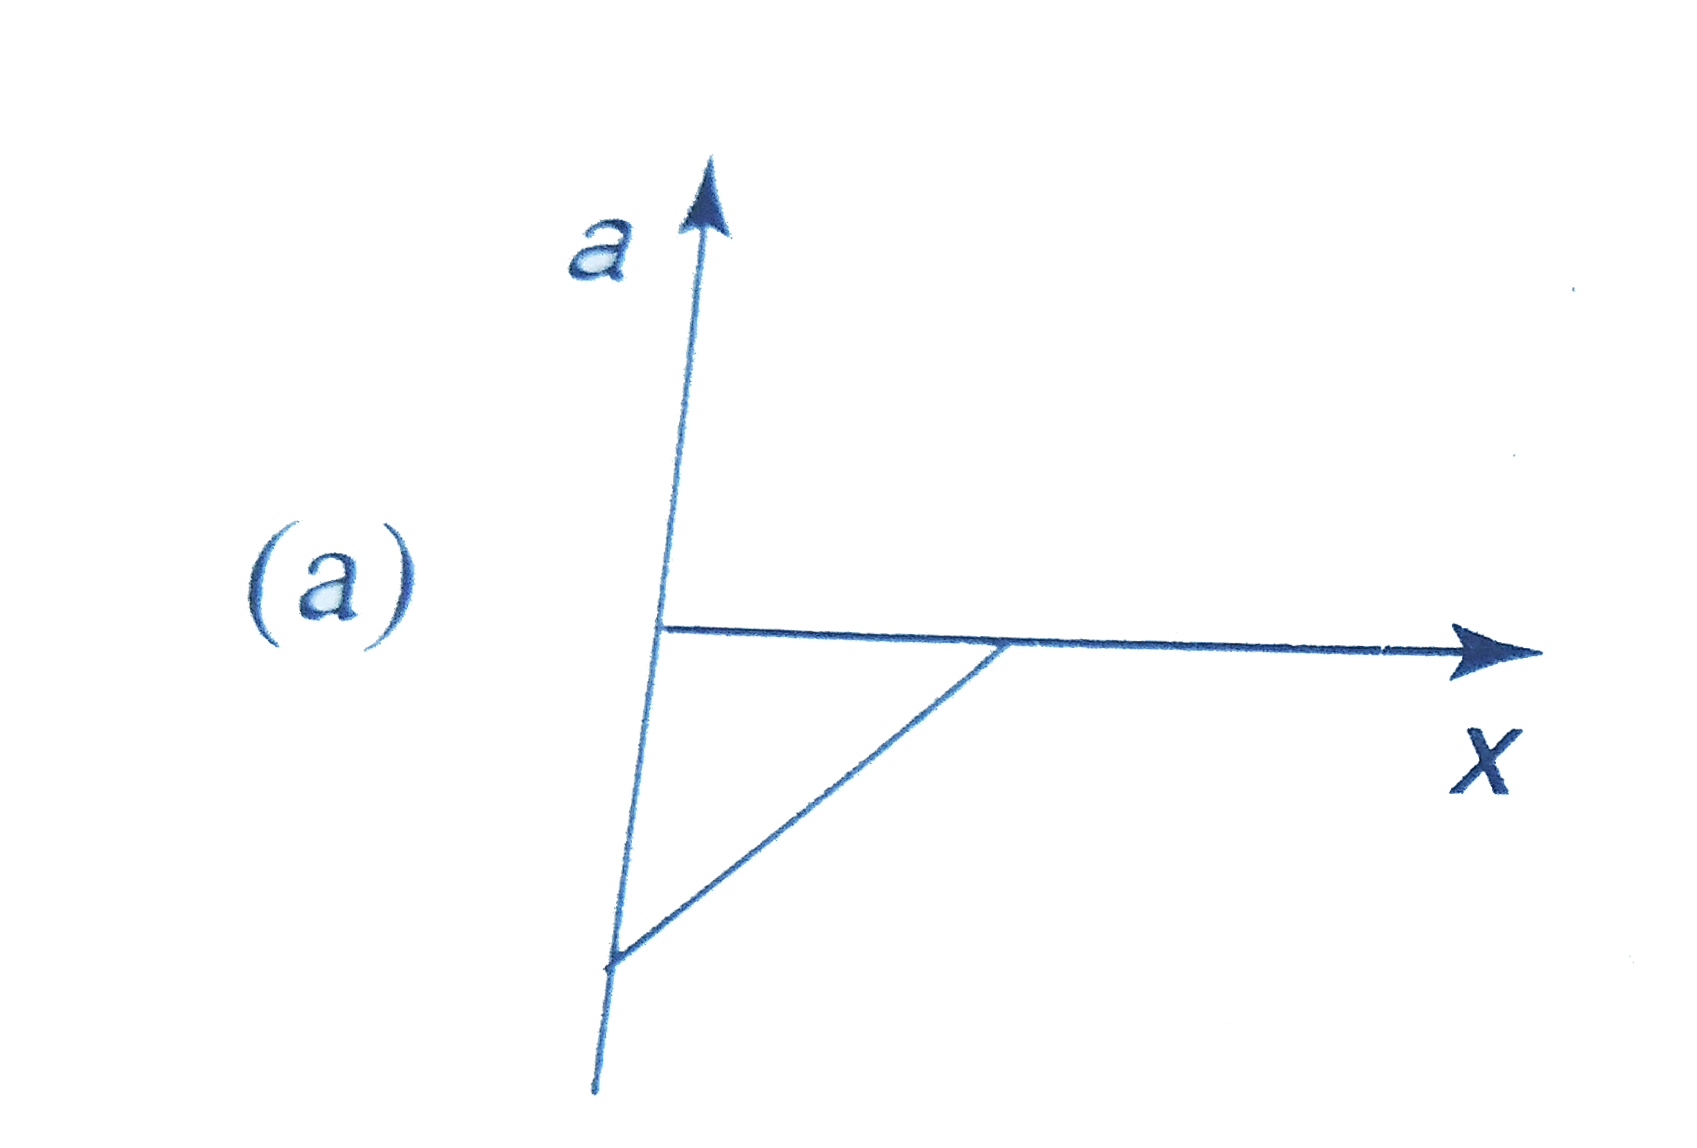 B
B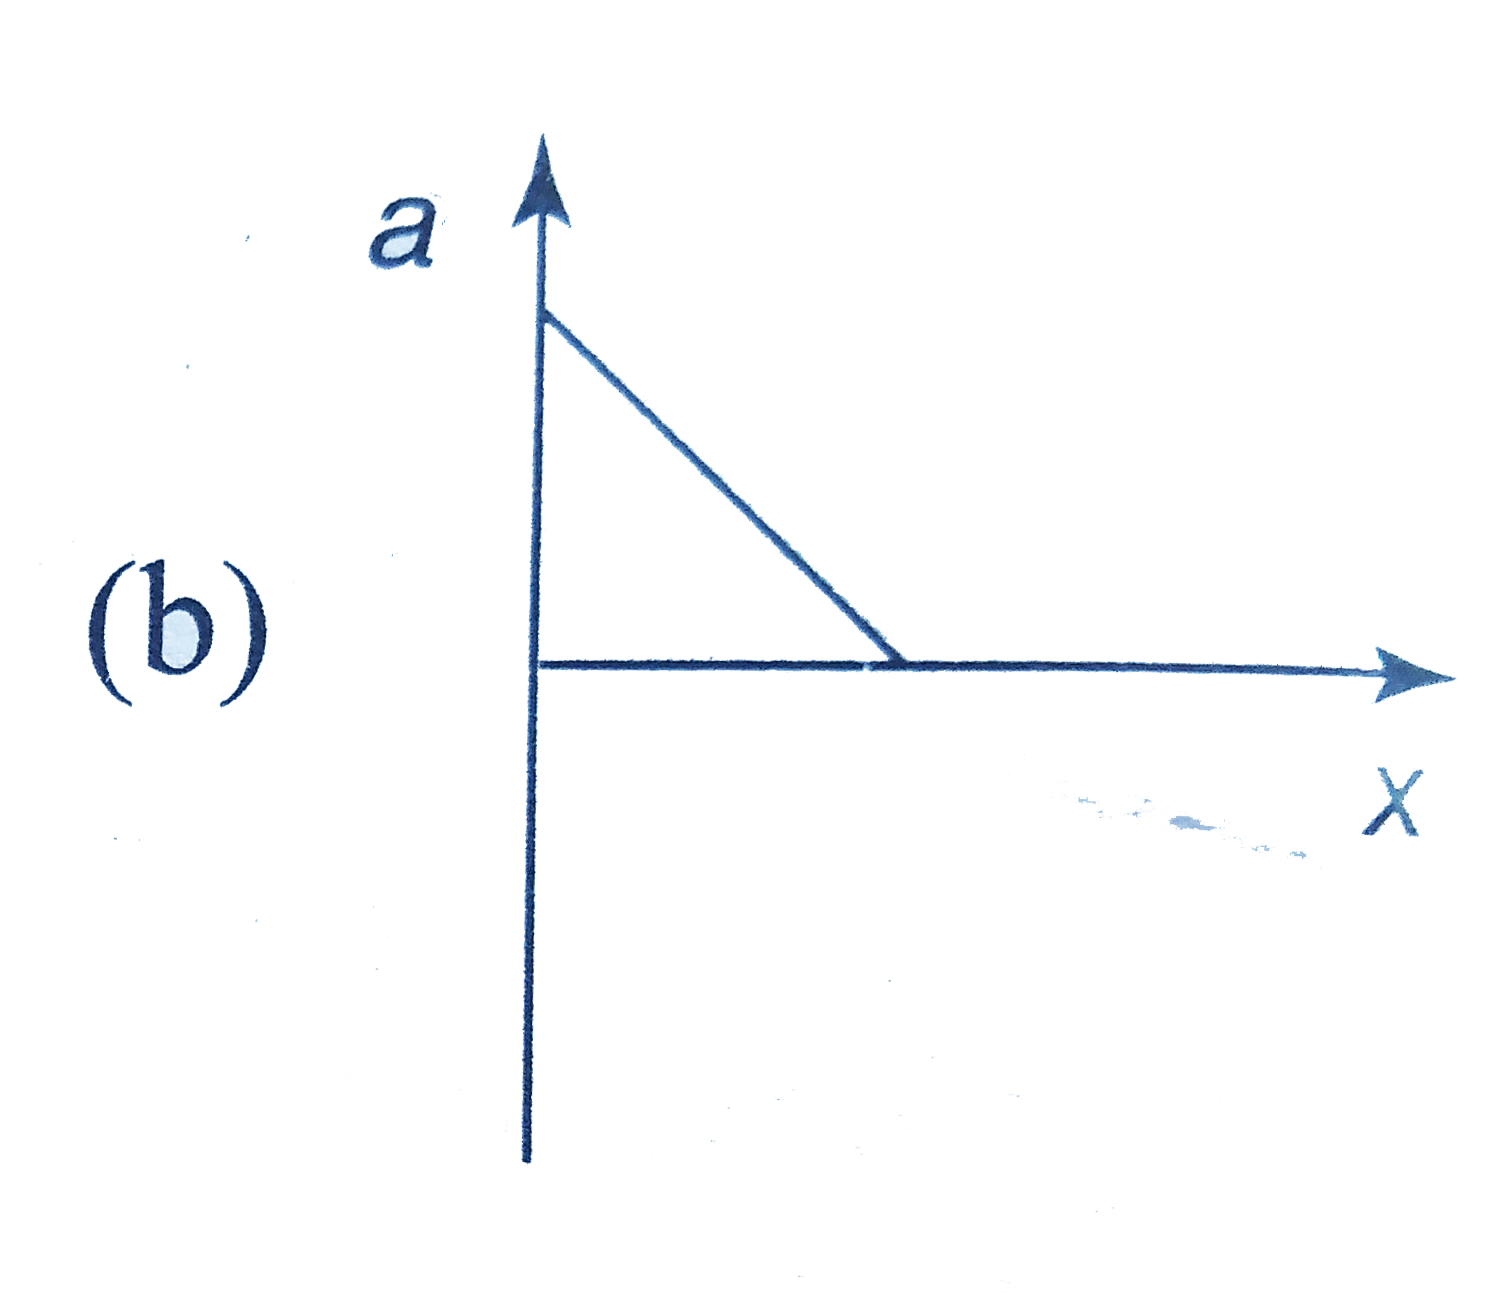 .C
.C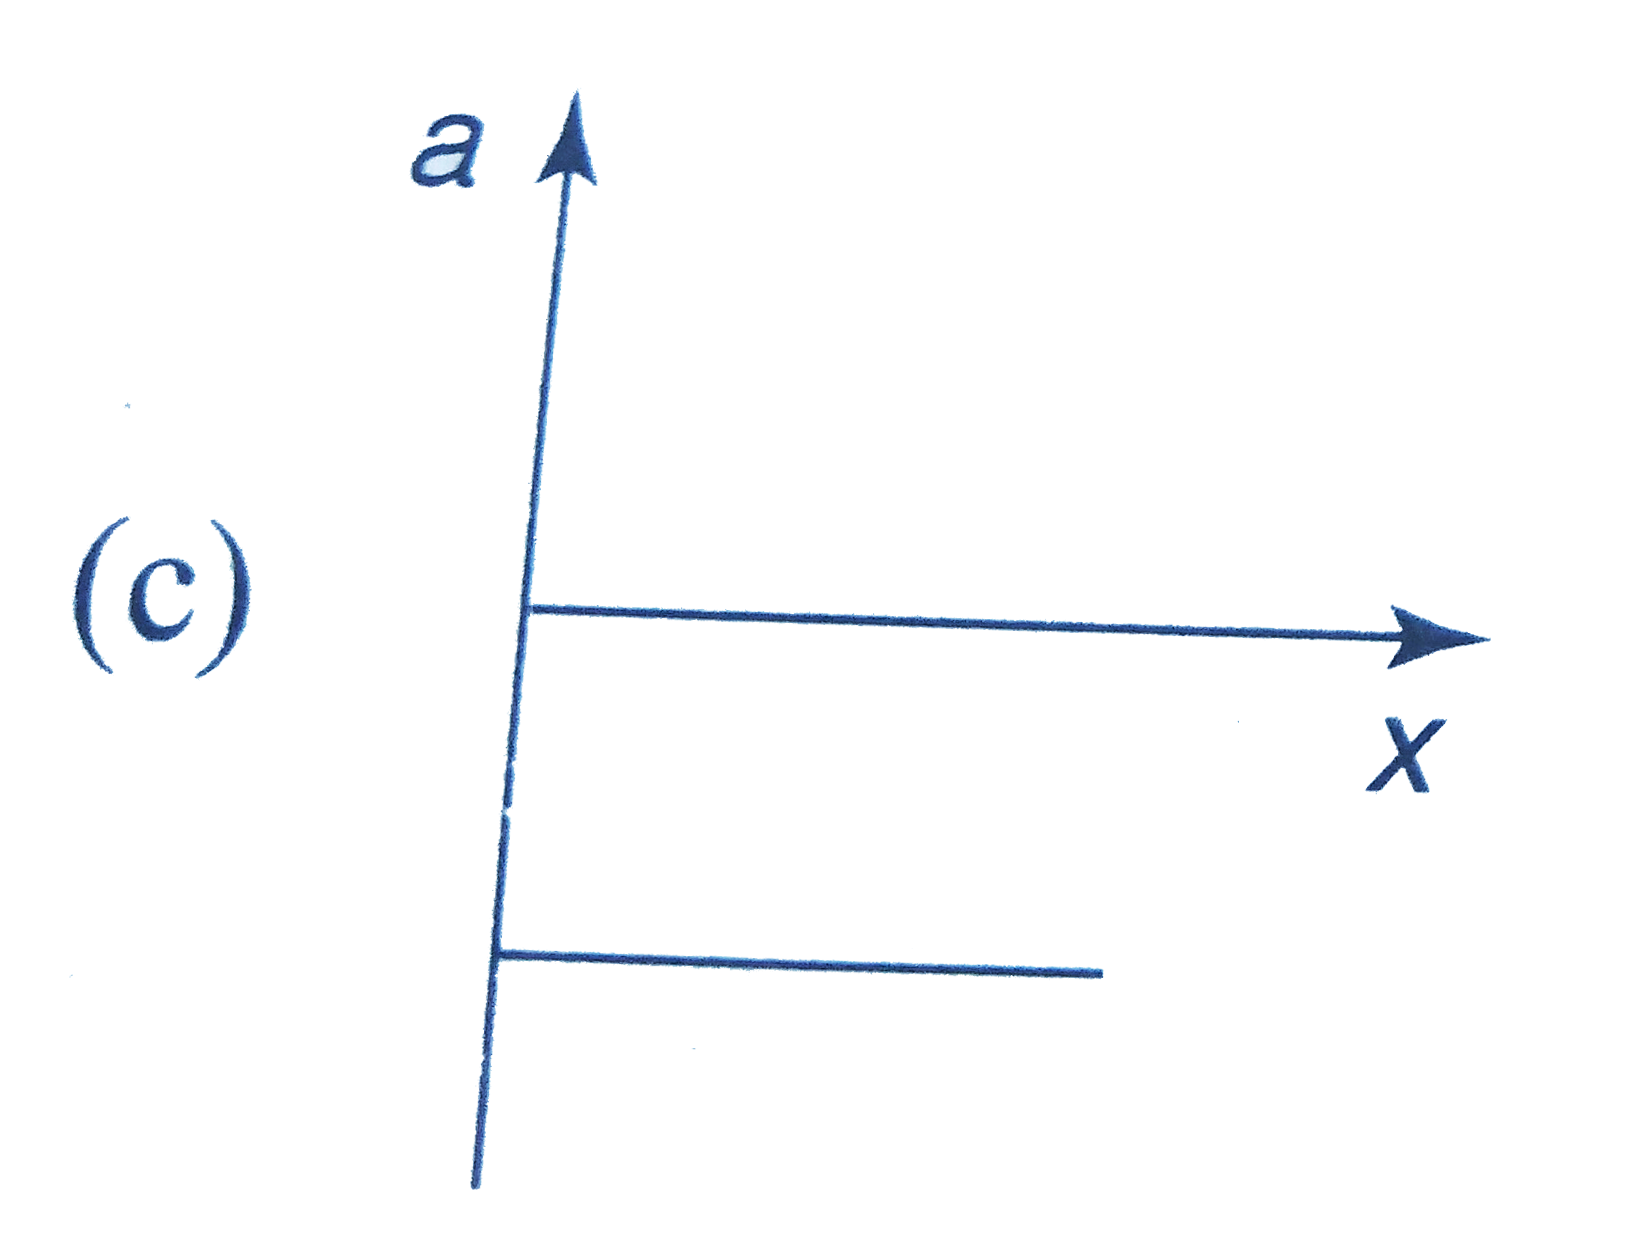 .D
.D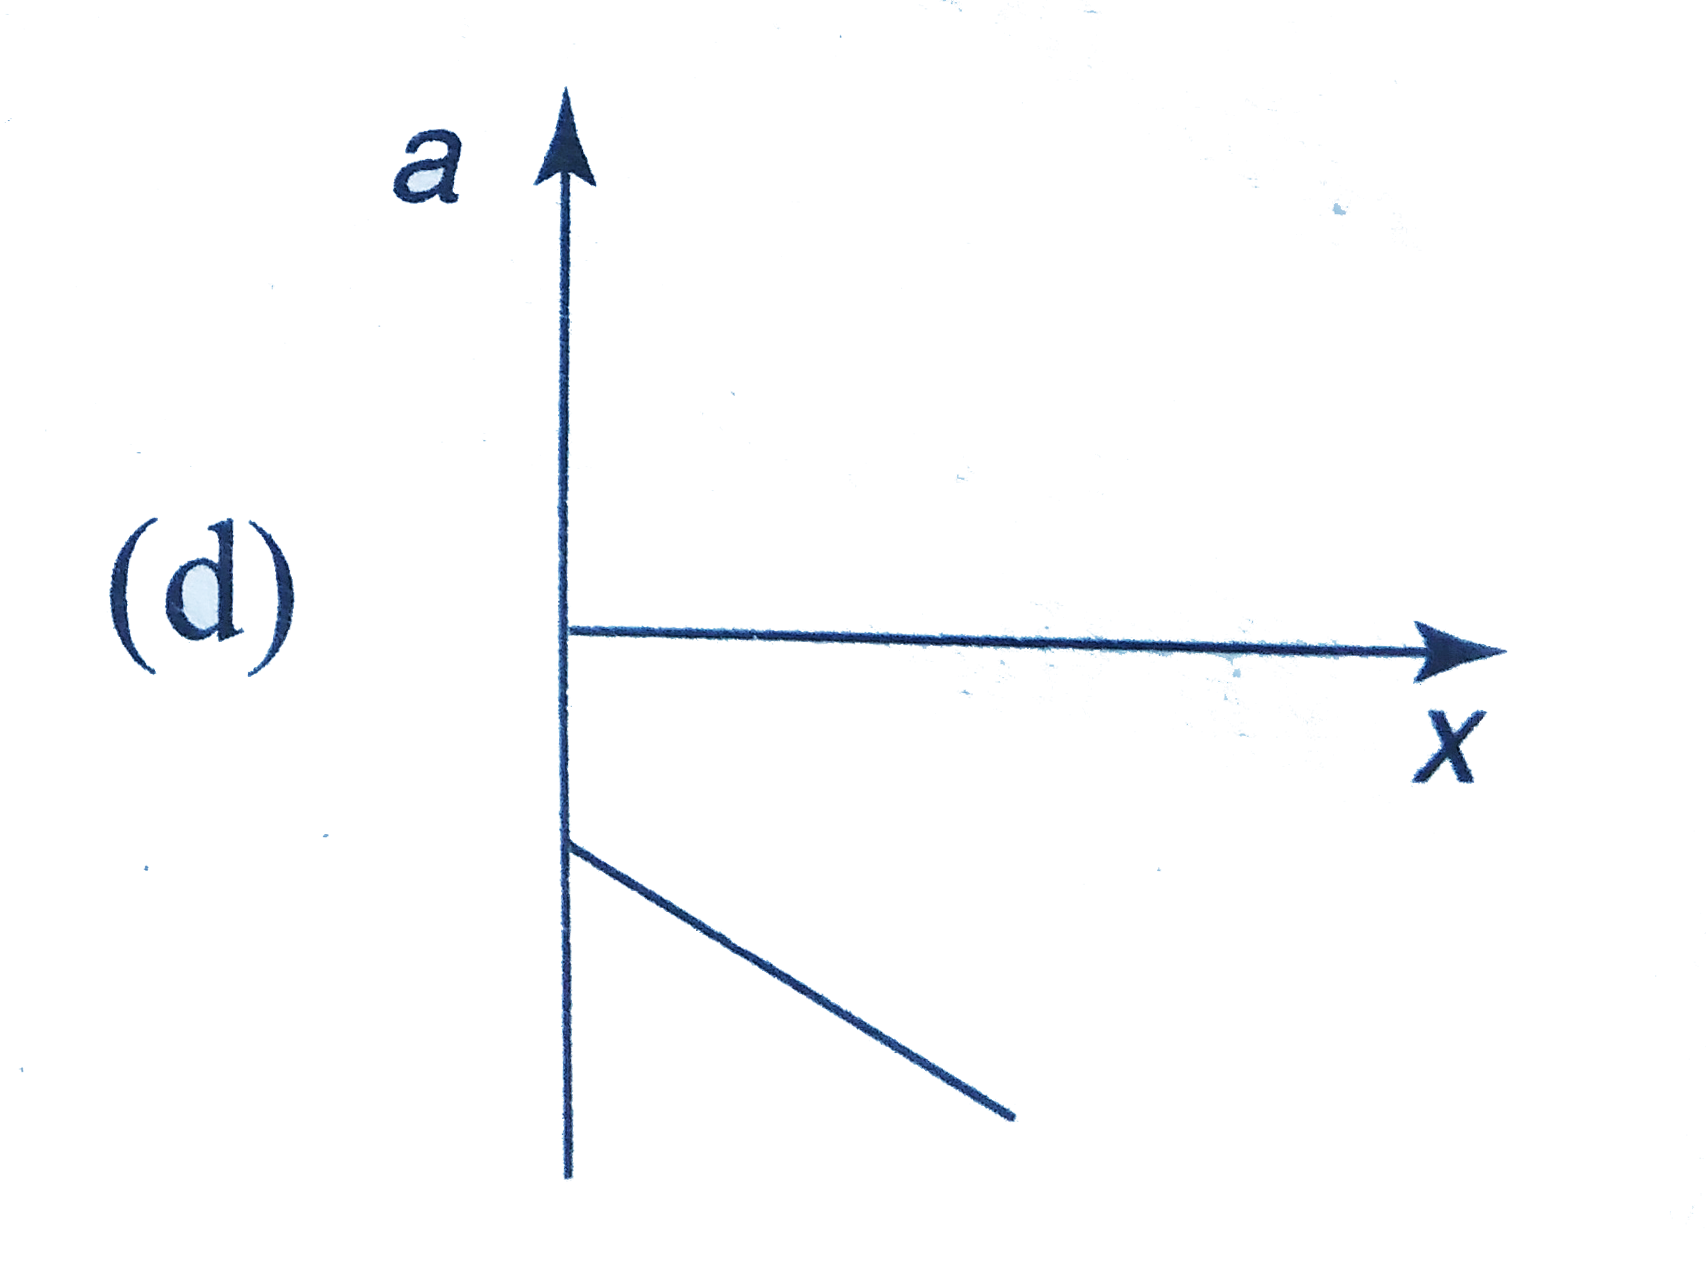 .
.The given P-U graph shows the variation of internal energy of an ideal gas with increase in pressure. Which of the following pressure-volume graph is equivalent to this graph?
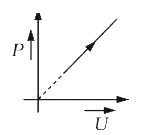 A
A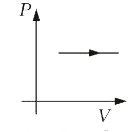 B
B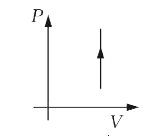 C
C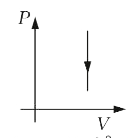 D
D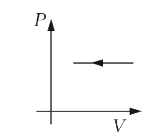
Which one of the following graphs represents correctly represent the variation of the gravitational field (E) with the distance (r) from the centre of a spherical shell of mass M radius R ?
A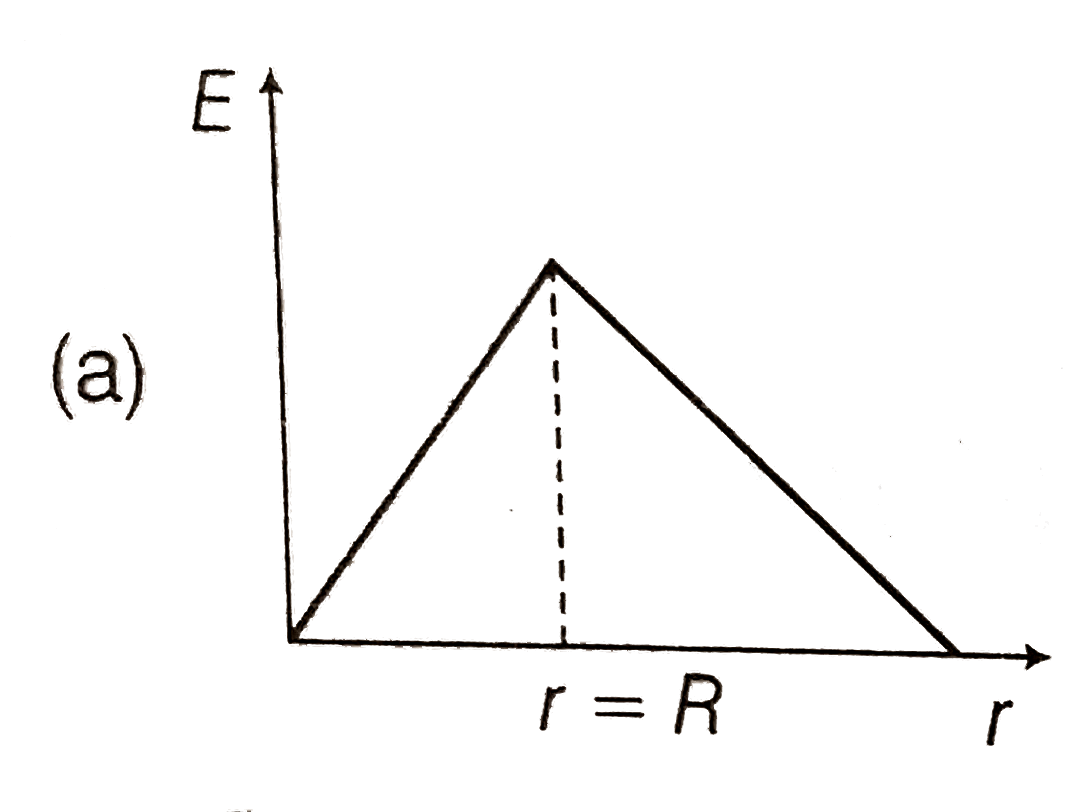 B
B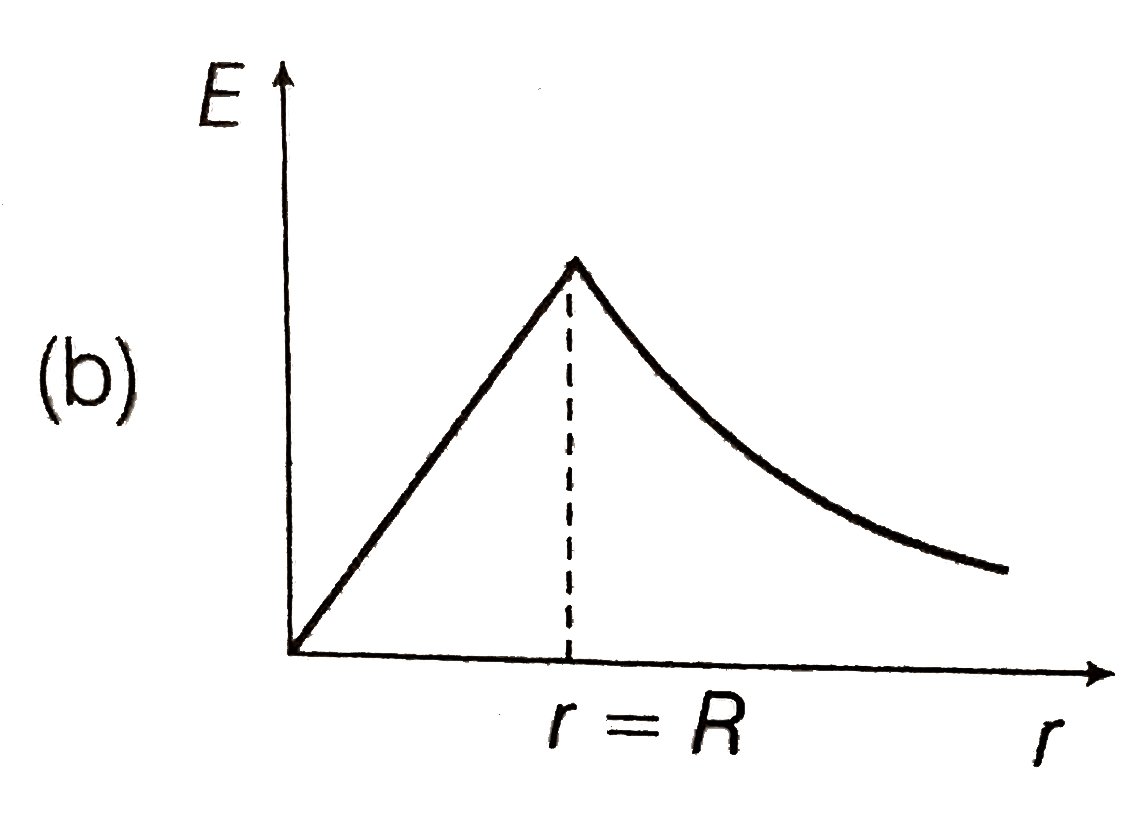 C
C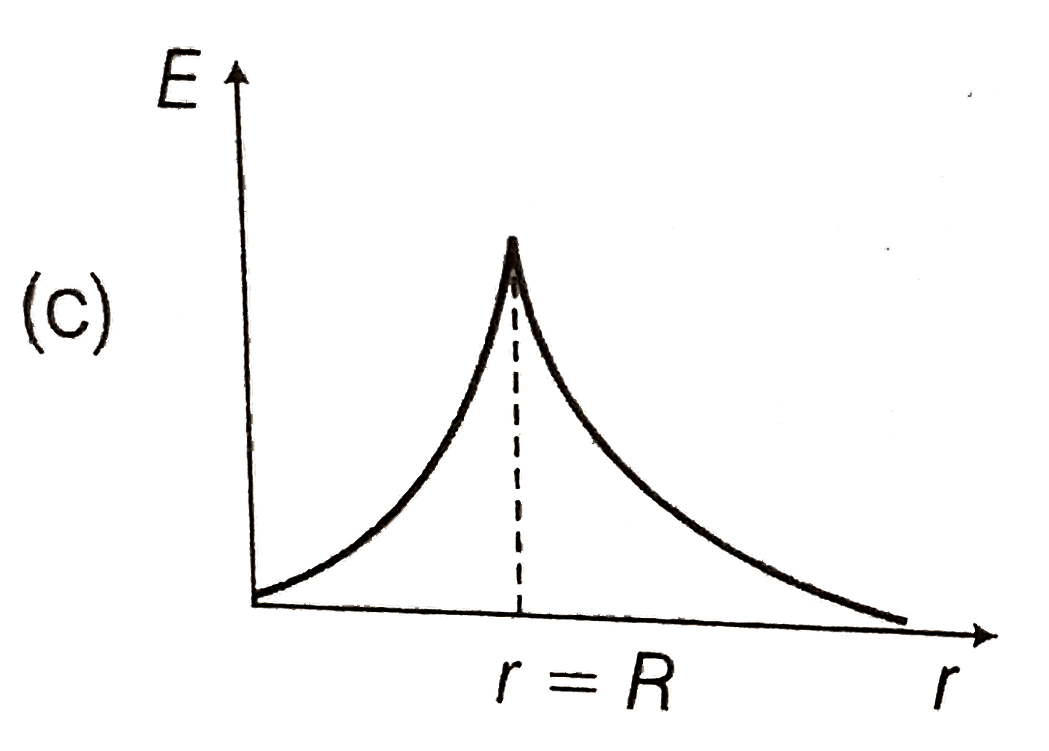 D
D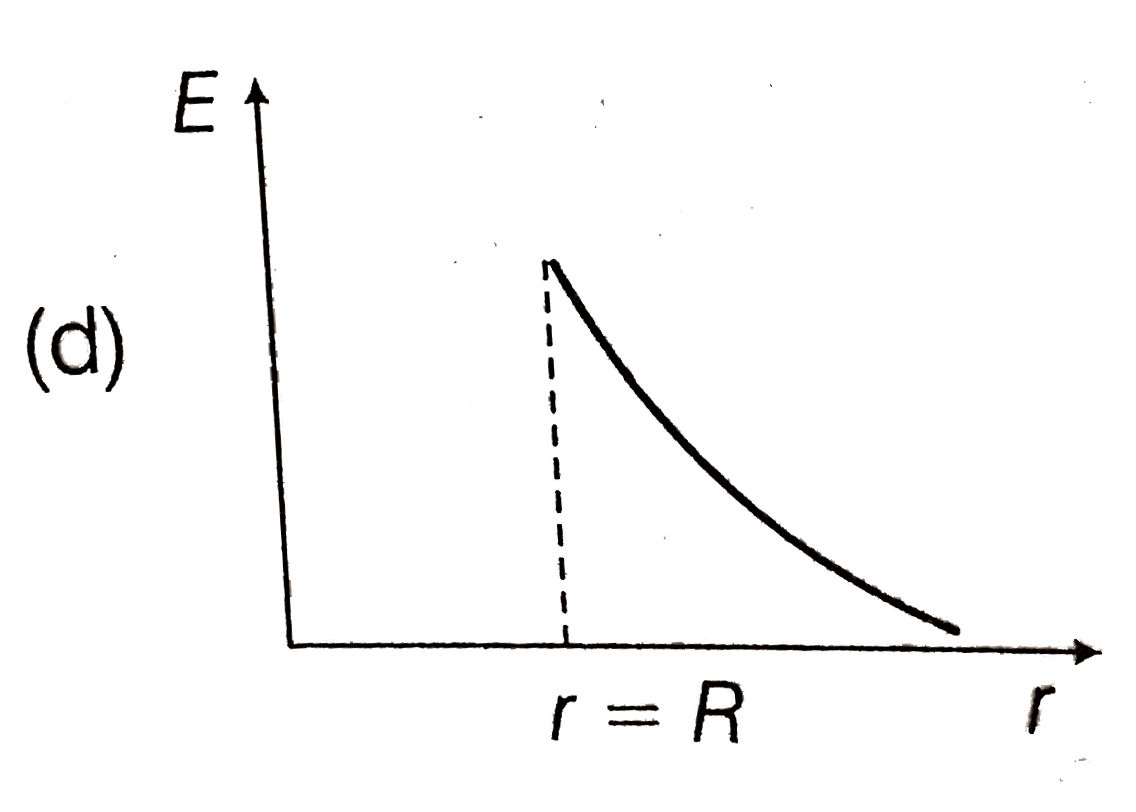
Draw a graph of electric field E(r) with distance r from the centre of the shell for 0≤r≤0 .
View SolutionWhich one of the following graphs represents the variation of electric field with distance r from the centre of a charged spherical conductor of radius R?
View SolutionDraw a plot showing variation of electric field with distance from the centre of a solid conducting sphere of radius R having a charge Q on its surface.
View SolutionThe magnetic field within cylindrical region whose cross - section is indicated starts increasing at a constant rate α tesla/sec . The graph showing the variation of induced field with distance r from the axis of cylinder is :

View SolutionThe variation of electrostatic potential with radial distance r from centre of positively charged metallic thin shell of radius R is given by graph
View Solution


