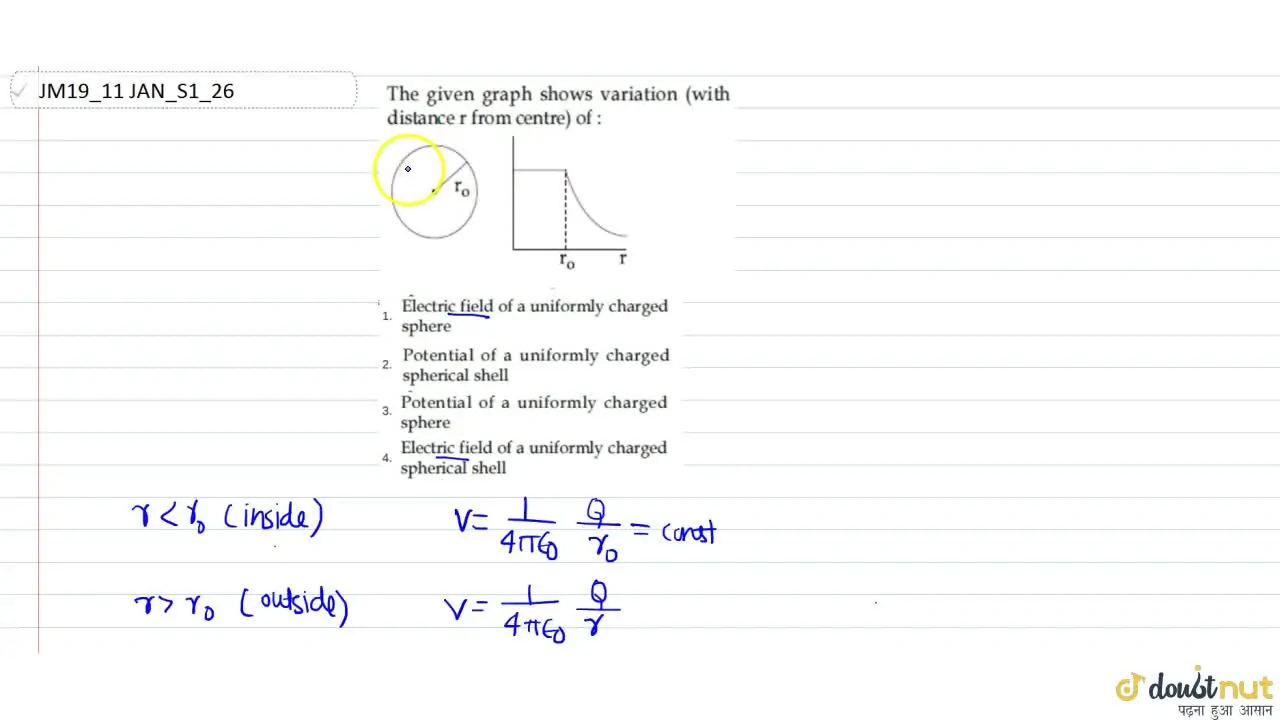
The given graph shows variation (with distance r form center) of :
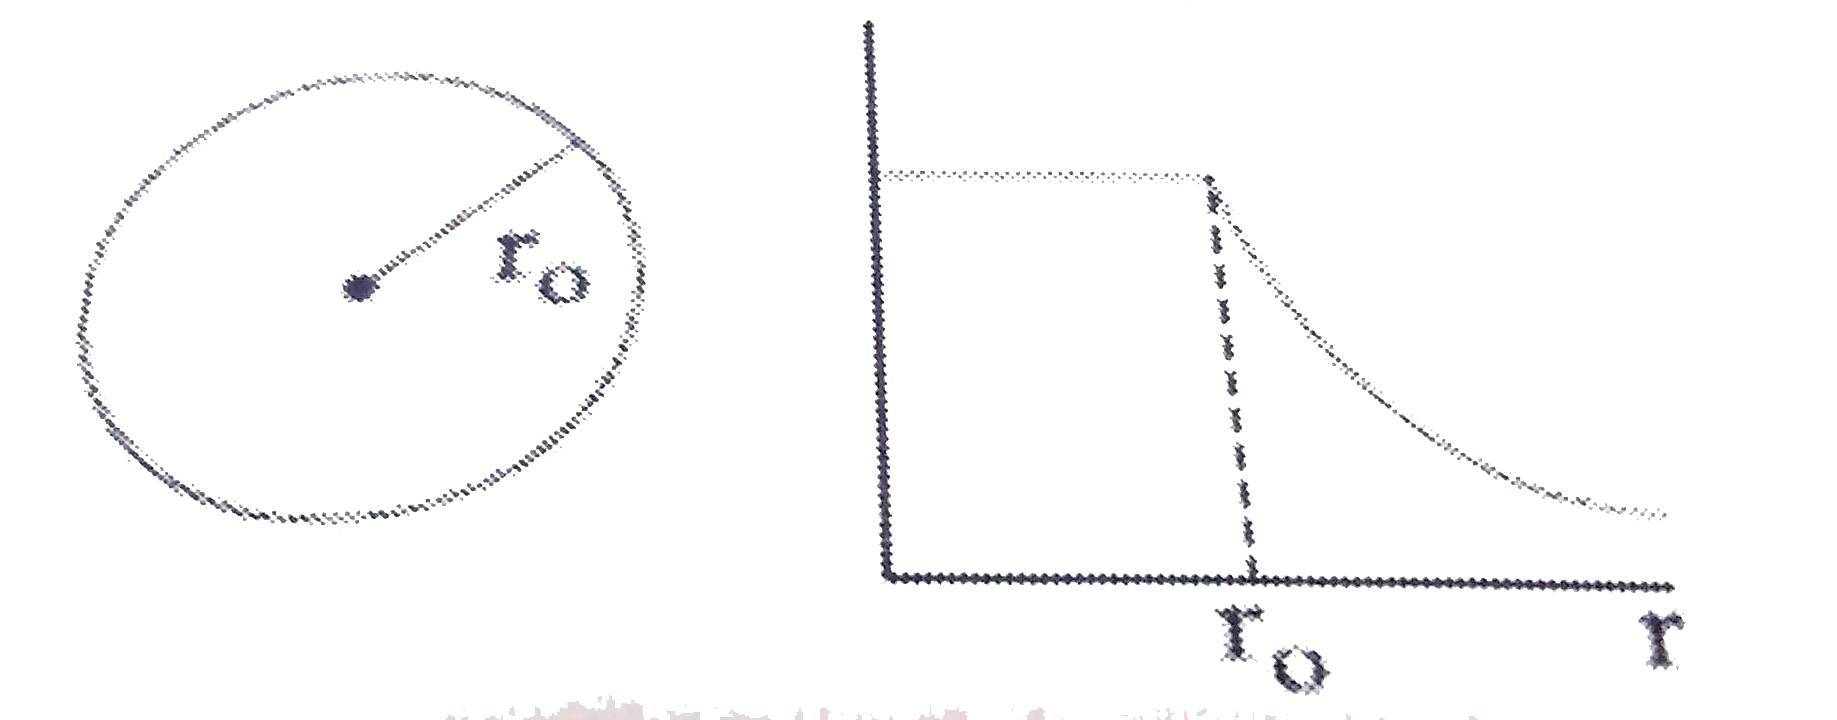
Electric field of a uniformly charged sphere
Potential of a uniformly charged spherical shell
Potential of a uniformly charged sphere
Electric field of a undiformly charged spherical shell
Step by step video & image solution for The given graph shows variation (with distance r form center) of : by Physics experts to help you in doubts & scoring excellent marks in Class 12 exams.
Related Playlists
Similar Questions
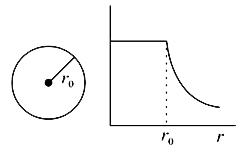
The given graph shows variation (with distance r from centre) of:
 View Solution
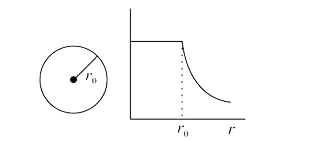
The given graph shows variation (with distance r from centre) of:
 View Solution
The given graph shows variation (with distance r from centre) of (A)Electric field of a uniformly charged conducting sphere (B)Electric field of a uniformly charged non-conducting sphere (C) Potential of a uniformly charged hollow sphere (D)Potential of a uniformly charged non- conducting solid sphere
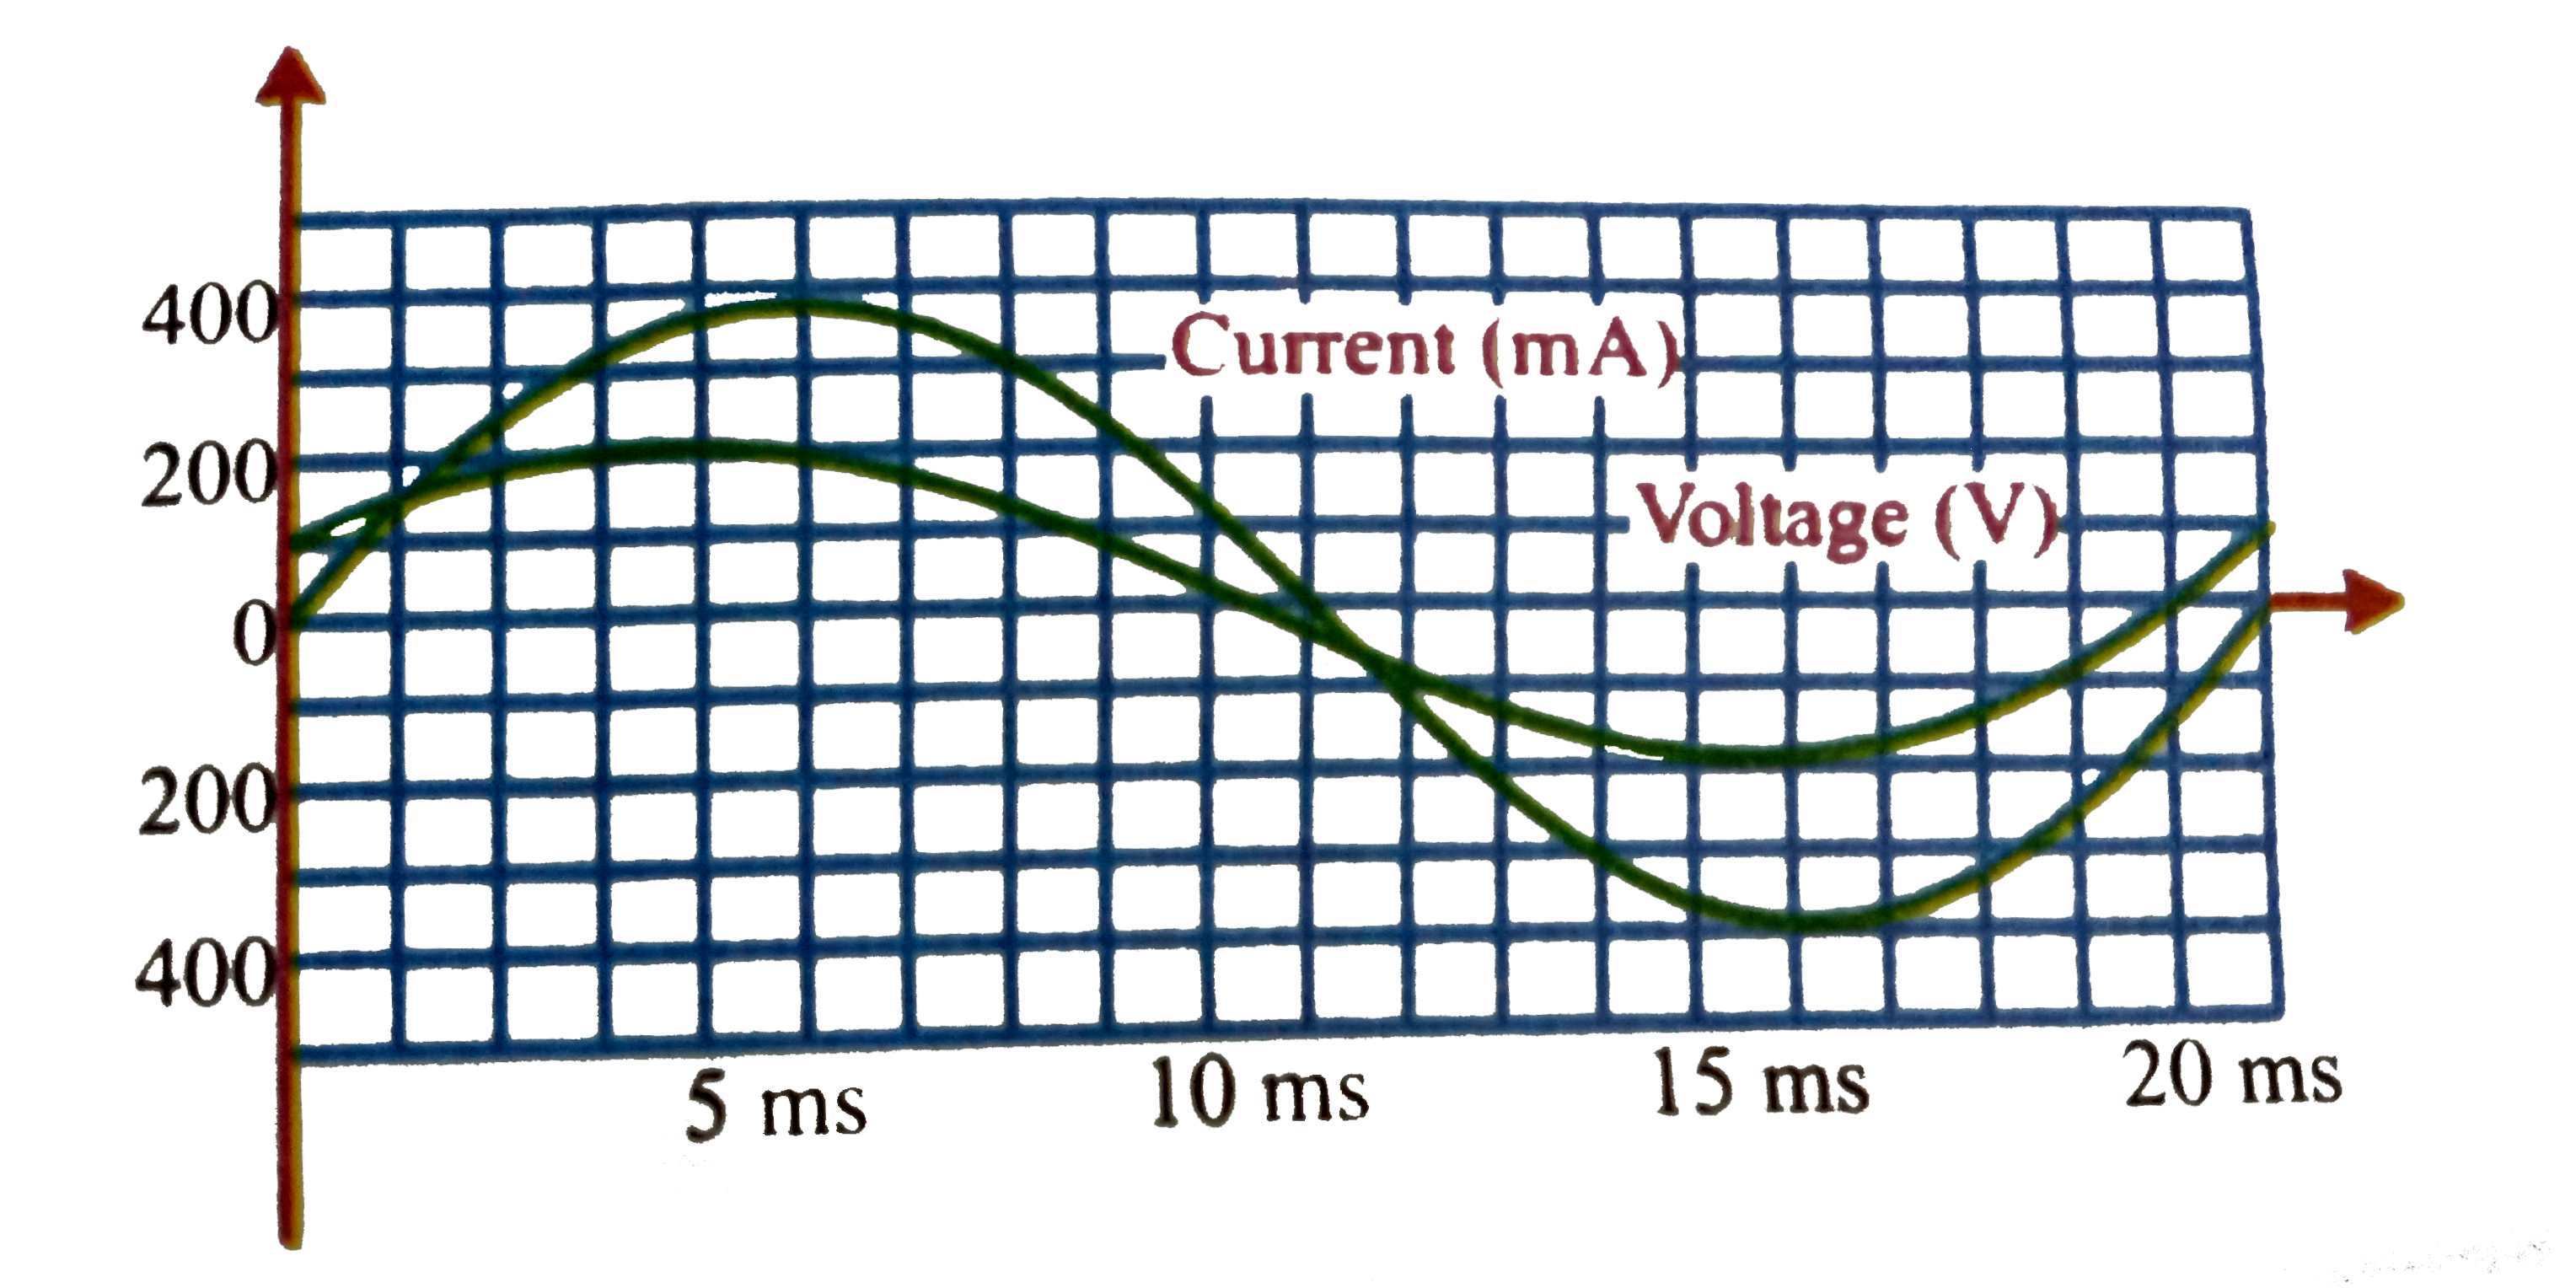
View SolutionThe given graph shows variation with time in the source voltage and steady state current drawn by a series RLC circuit. Given curve through origin is the current variation.
Which of the following statements is/are correct ?
 View Solution
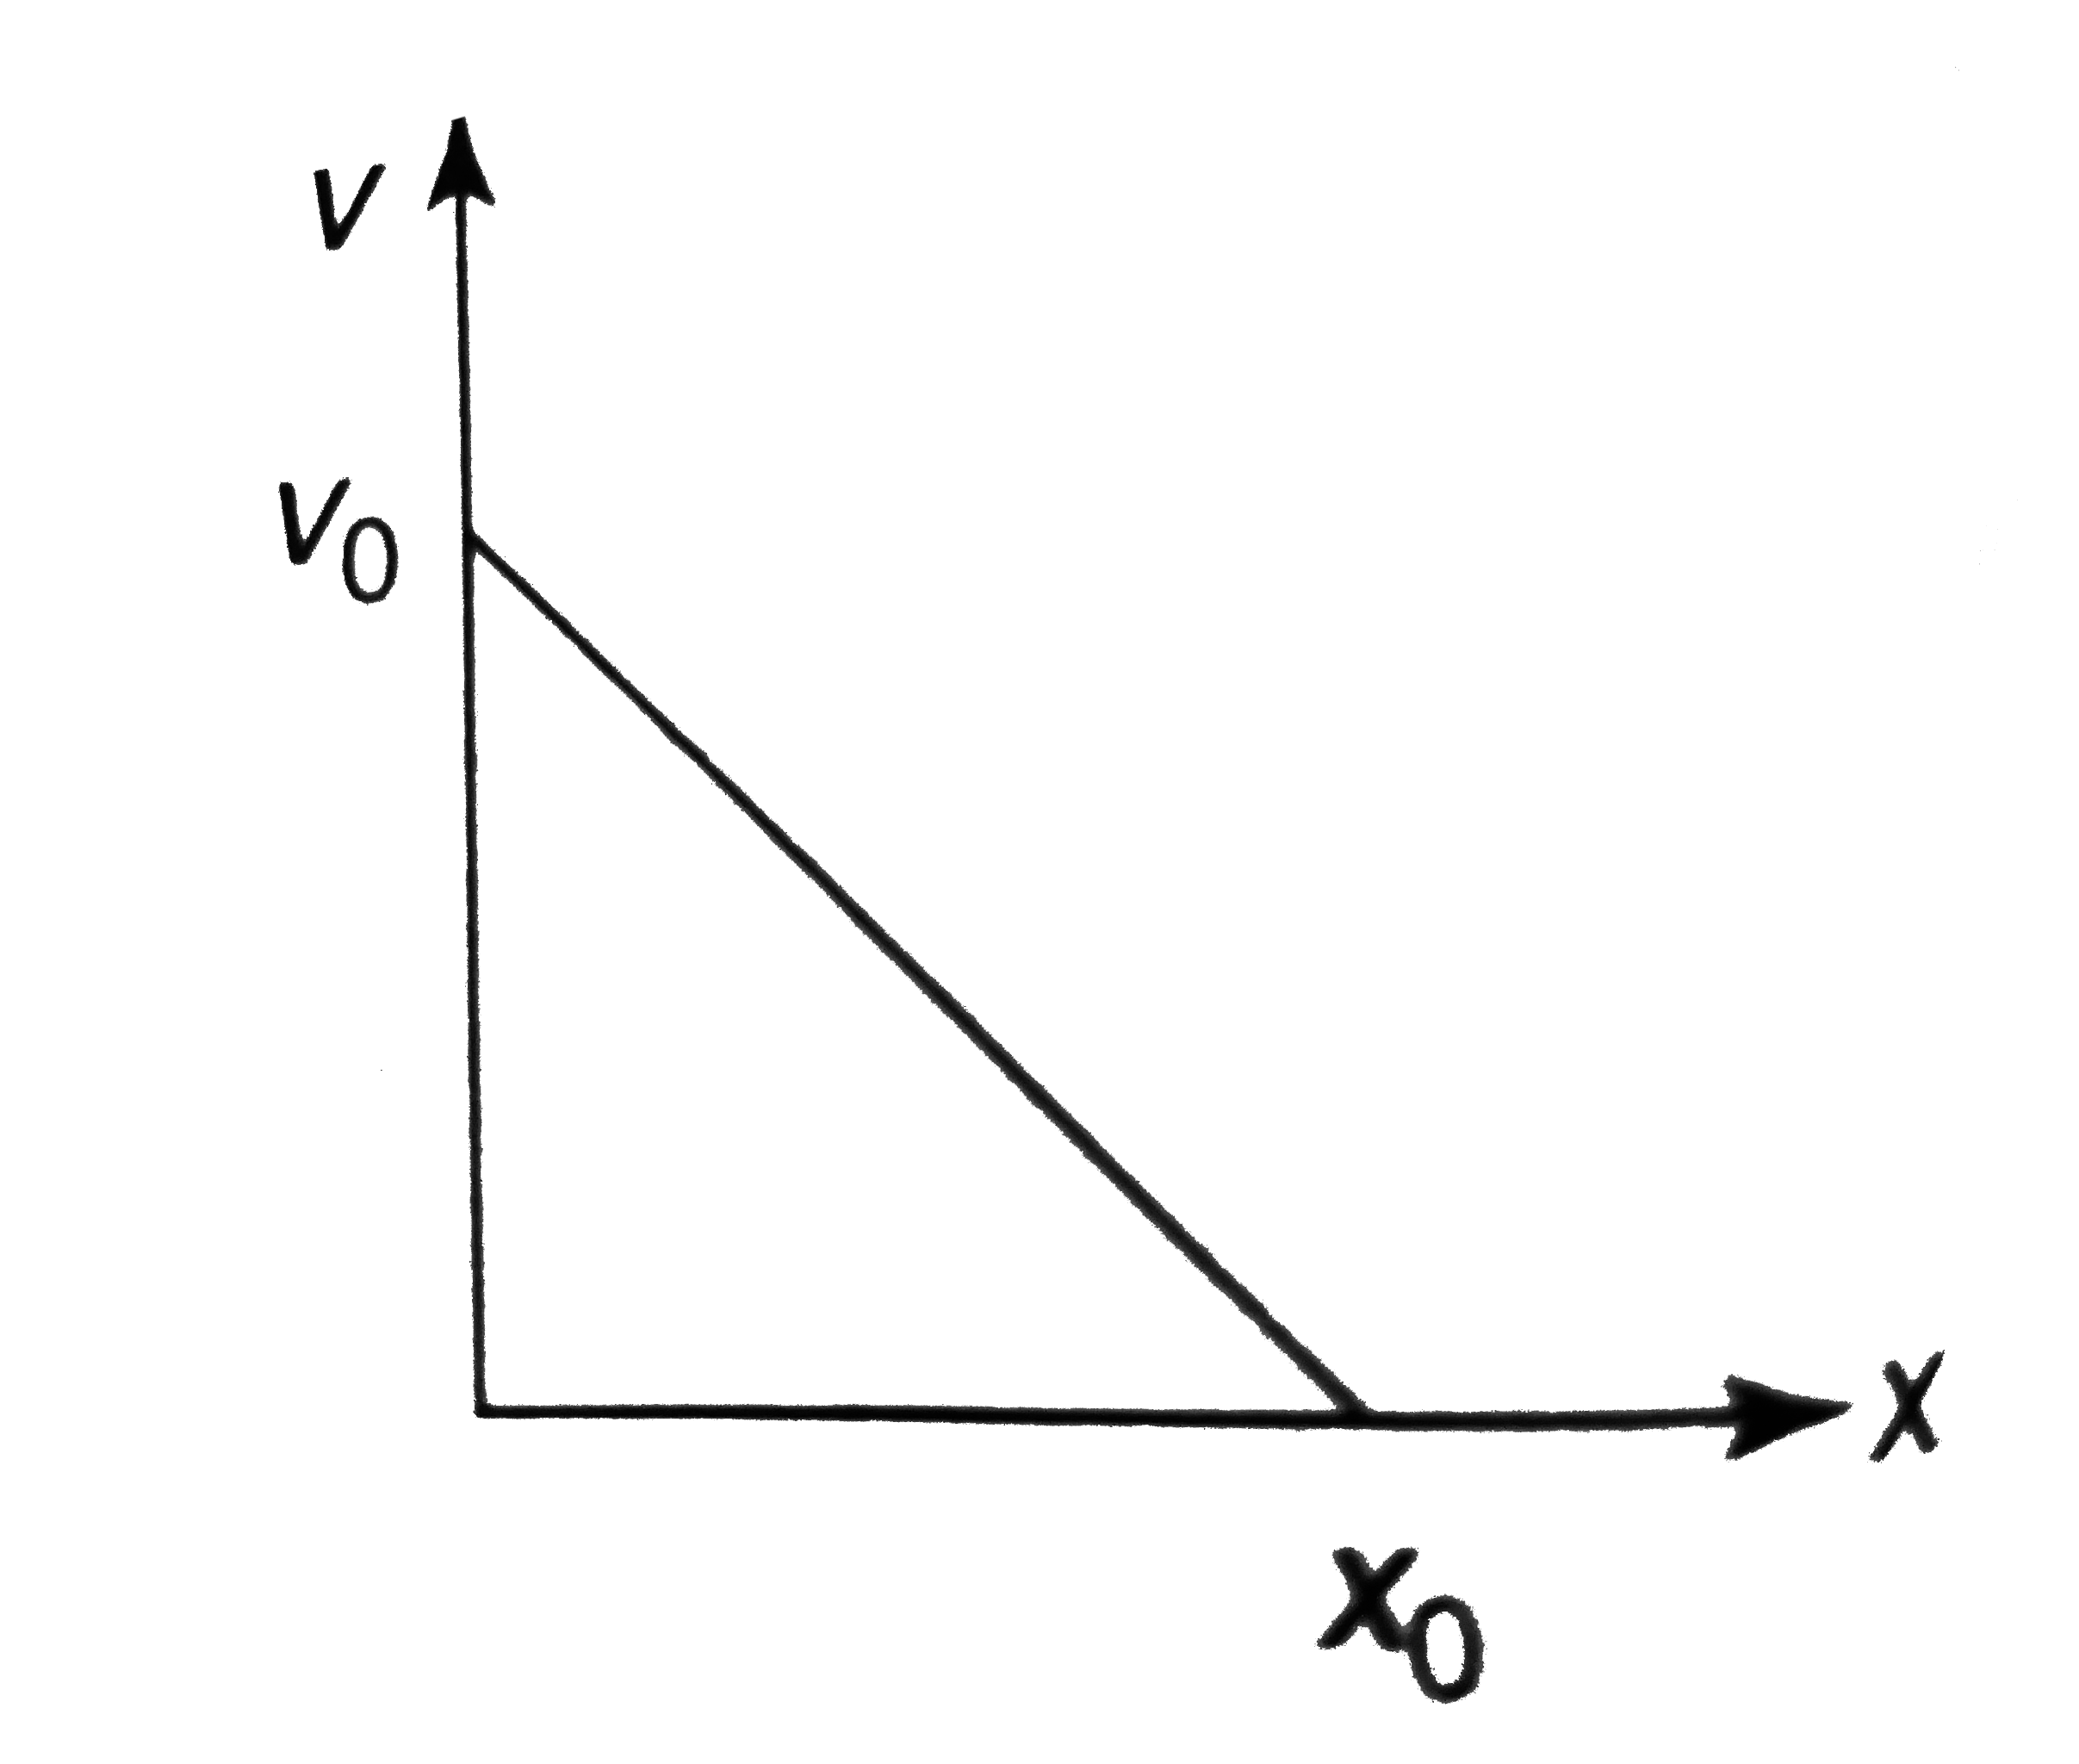
The given graph shows the variation of velocity with displacement. Which one of the graphs given below correctly represents the variation of acceleration with displacement ?
 View Solution
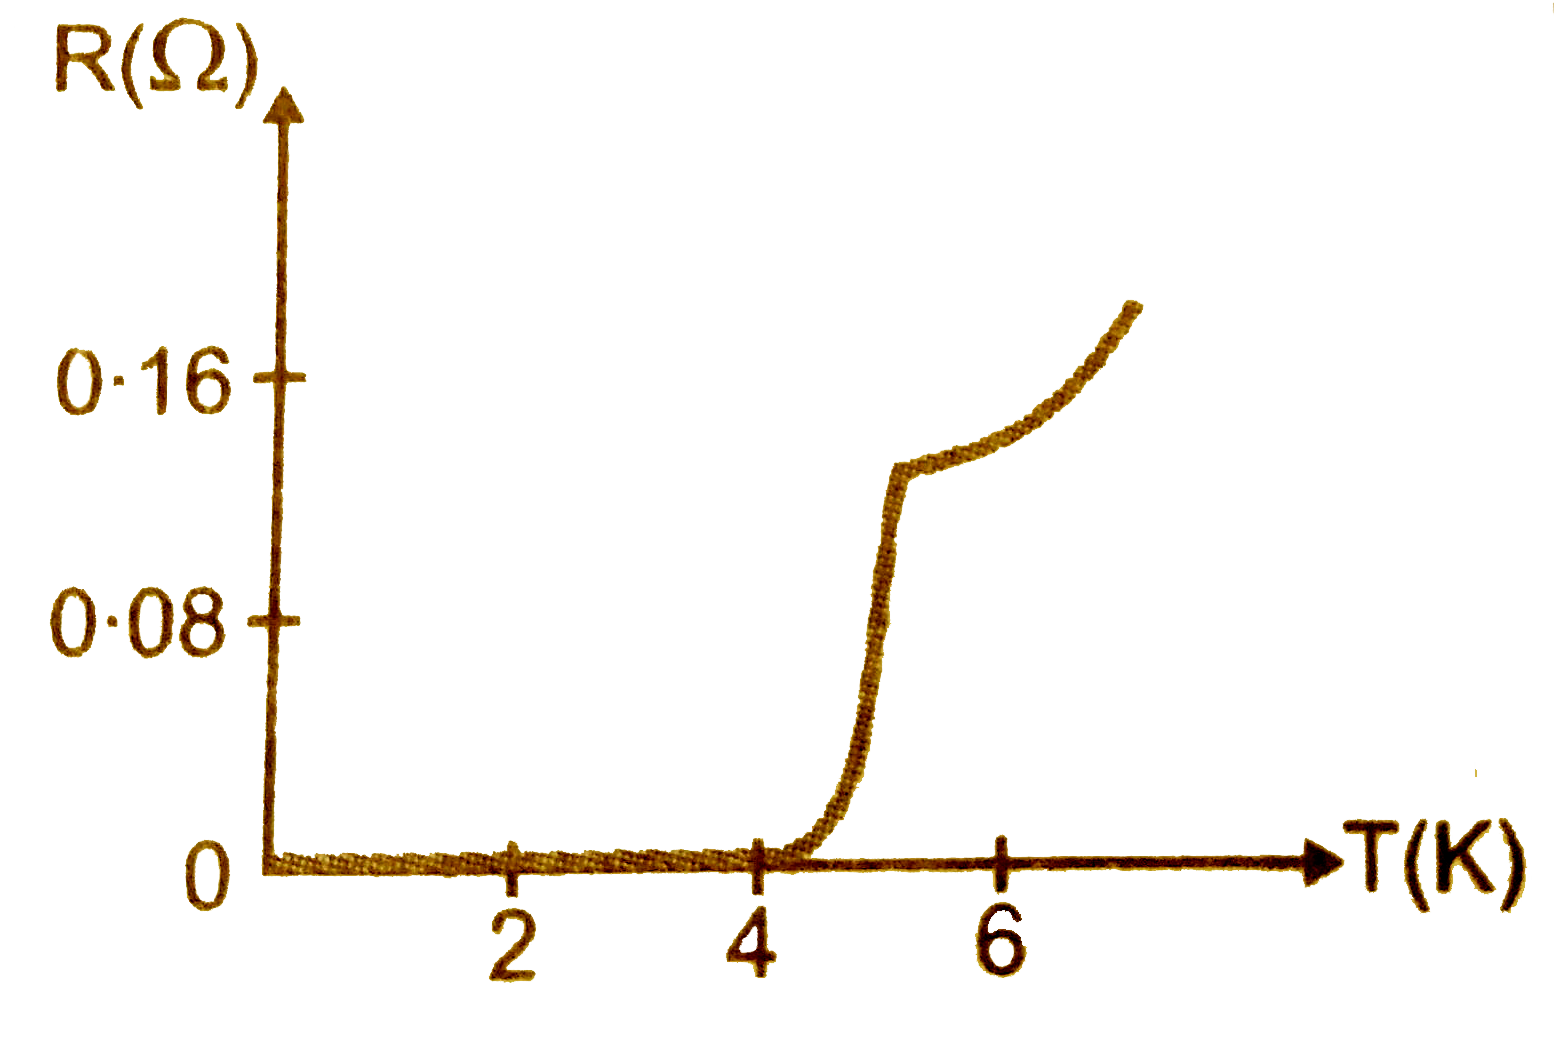
The given graph shows the variation of resistance of mercury in the temperature range 0 lt T lt 4 K. Name the phenomeon shown by the graph.
 View Solution
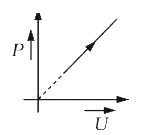
The given P-U graph shows the variation of internal energy of an ideal gas with increase in pressure. Which of the following pressure-volume graph is equivalent to this graph?
 View Solution
In the circuit shown below, the internal resistance of the cell is negligible. The distance of the slider from the left-hand end of the slide wire is l. The graph shows the variation with l of the current I in the cell.

Value of the resistance R is:View SolutionThe magnetic field within cylindrical region whose cross - section is indicated starts increasing at a constant rate α tesla/sec . The graph showing the variation of induced field with distance r from the axis of cylinder is :
 View Solution
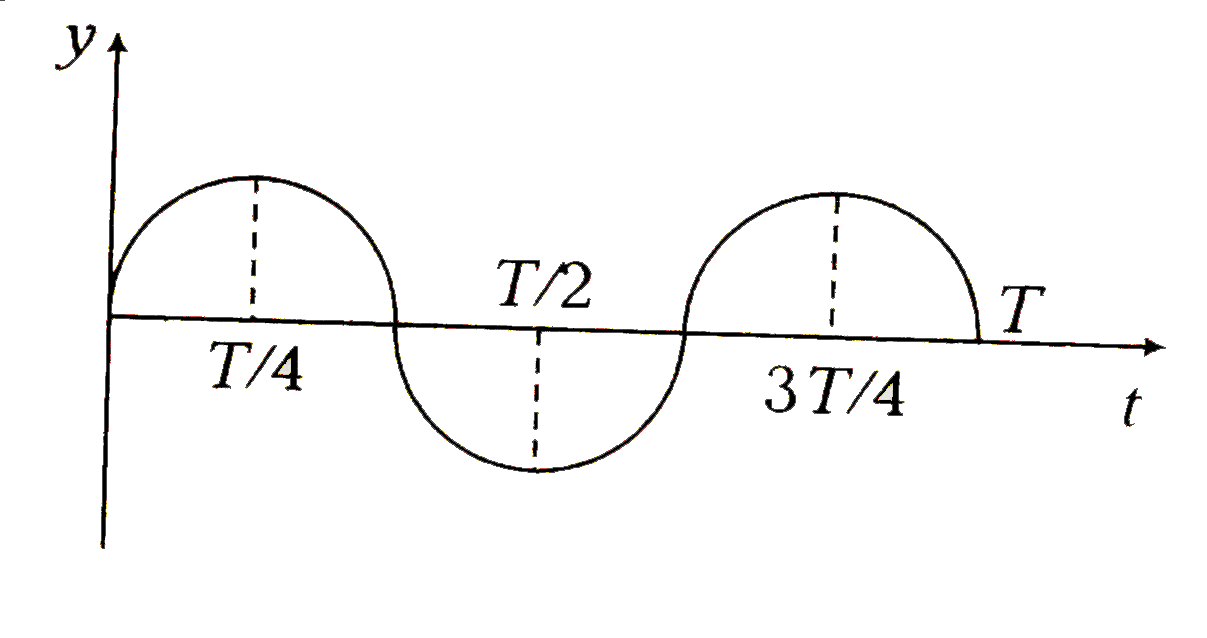
The graph shows the variation of displacement of a particle executing SHM with time . We infer from this graph that
 View Solution

