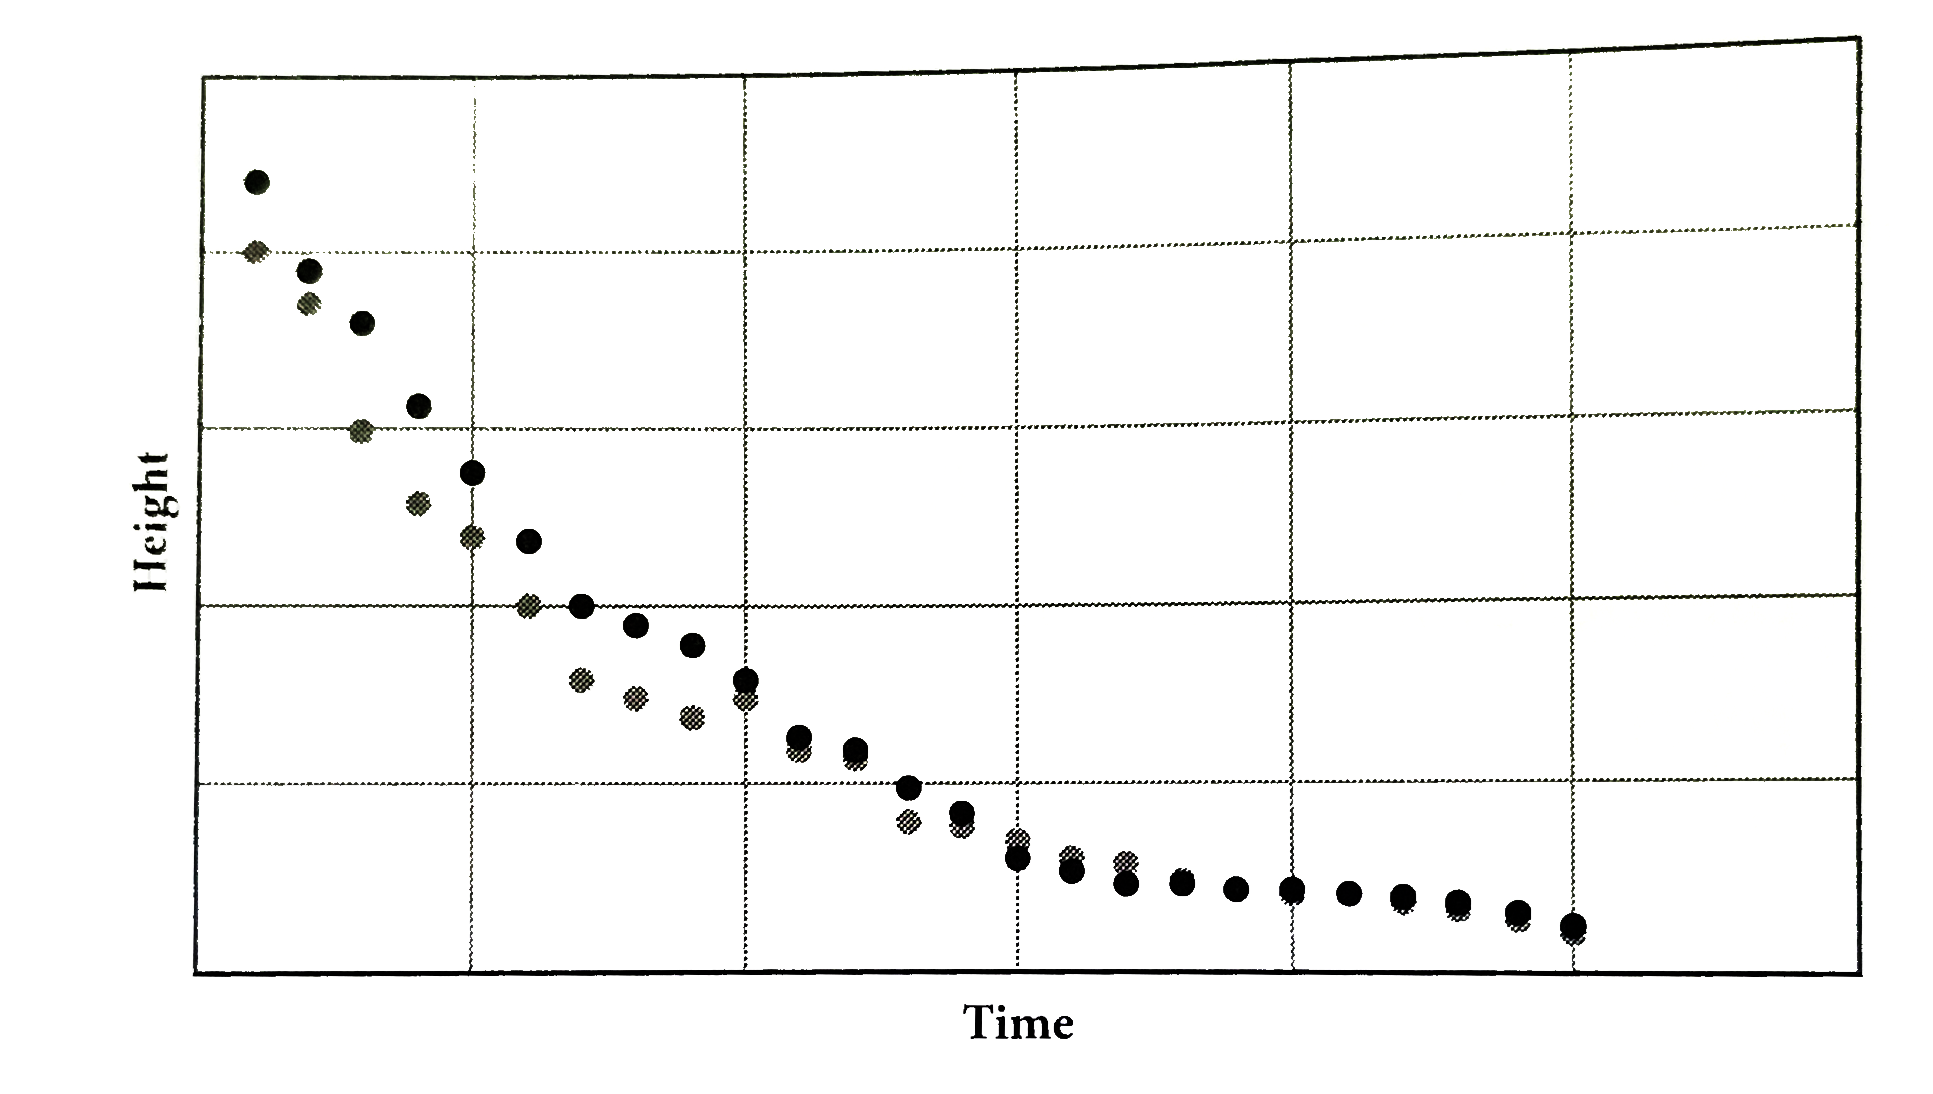
A drain at the bottom of a cylondrical water tank is opened and the height of the water is measured at regular time intervals. The tank is refilled and the process is then repeated. The scatterplot above shows the measured height on the y-axis and time on the x-axis for the trials. Which of the following conclusions can be drawn from the observations in the scatterplot?
Water flows out of the drain at a constant rate.
The flow rate from the tank decreases as the height of the water in the tank decreases.
The drain is inefficinetly designed.
The is no relationship between the height of the water in the tank and time.
The correct Answer is:B
A line of best fit for the scatterplot would show that the measured height of the water decreases over time, but the slope becomes less steep over time, too. The slope, change in height divided by change in time, represents the flow rate of water out of the tank. Since the flow changes as the height of the water changes, (A) is incorrect. Because the slope of the line of best fit becomes less steep as the height of the water decreases, it follows that the flow rate decreases as the height of the water decreases. (B) is correct. (D) is incorrect because the height of the water decreases (through at an even slower rate) as time progresses, so there is a relationship between the height of the water and time. (C ) is incorrect because the data presented doesn't imply anything about the efficiency of the drain design.
Topper's Solved these Questions
- SCATTERPLOTSBook:KAPLANChapter:SCATTERPLOTSExercise:LINE OF BEST FIT
Explore 1 Video
- SCATTERPLOTSBook:KAPLANChapter:SCATTERPLOTSExercise:SCATTERPLOT MODELING
Explore 1 Video
- SCATTERPLOTSBook:KAPLANChapter:SCATTERPLOTSExercise:SCATTERPLOT MODELING
Explore 1 Video
- SAT MATH: TIMING ANS SECTION MANAGEMENT STRATEGIESBook:KAPLANChapter:SAT MATH: TIMING ANS SECTION MANAGEMENT STRATEGIESExercise:TRY ON YOU OWN
Explore 5 Videos
- SYSTEMS OF LINEAR EQUATIONSBook:KAPLANChapter:SYSTEMS OF LINEAR EQUATIONSExercise:NUMBER OF POSSIBLE SOLUTIONS
Explore 1 Video
Similar Questions

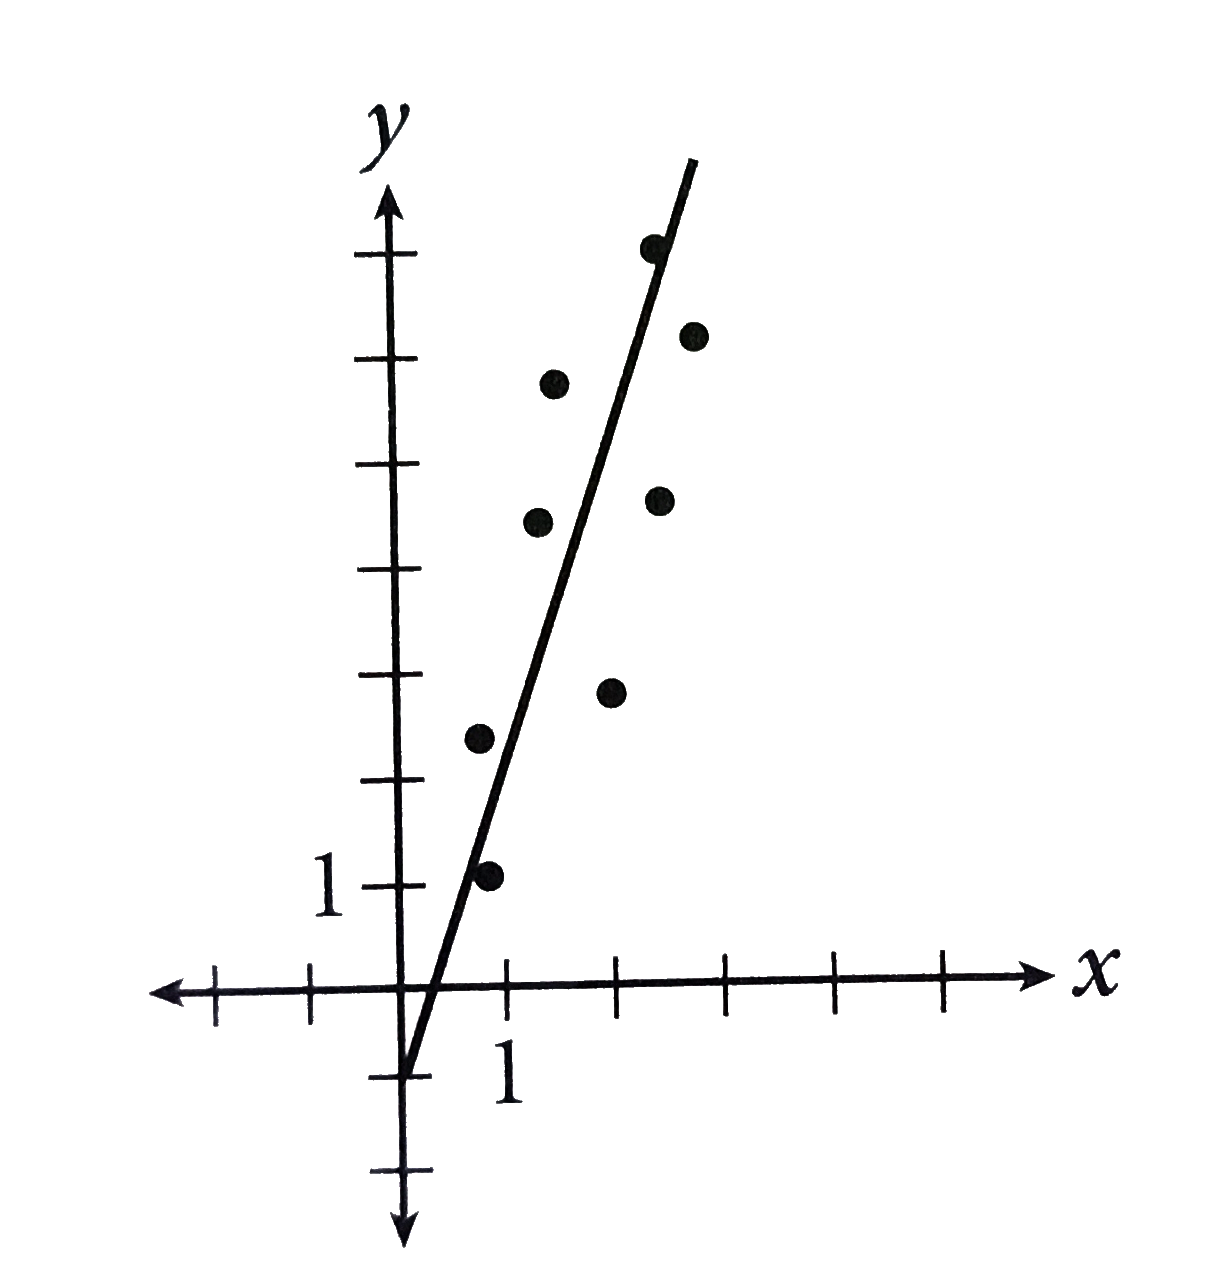
Which of the following equation corresponds to the line of best fit for the data set shown above ?
View Solution
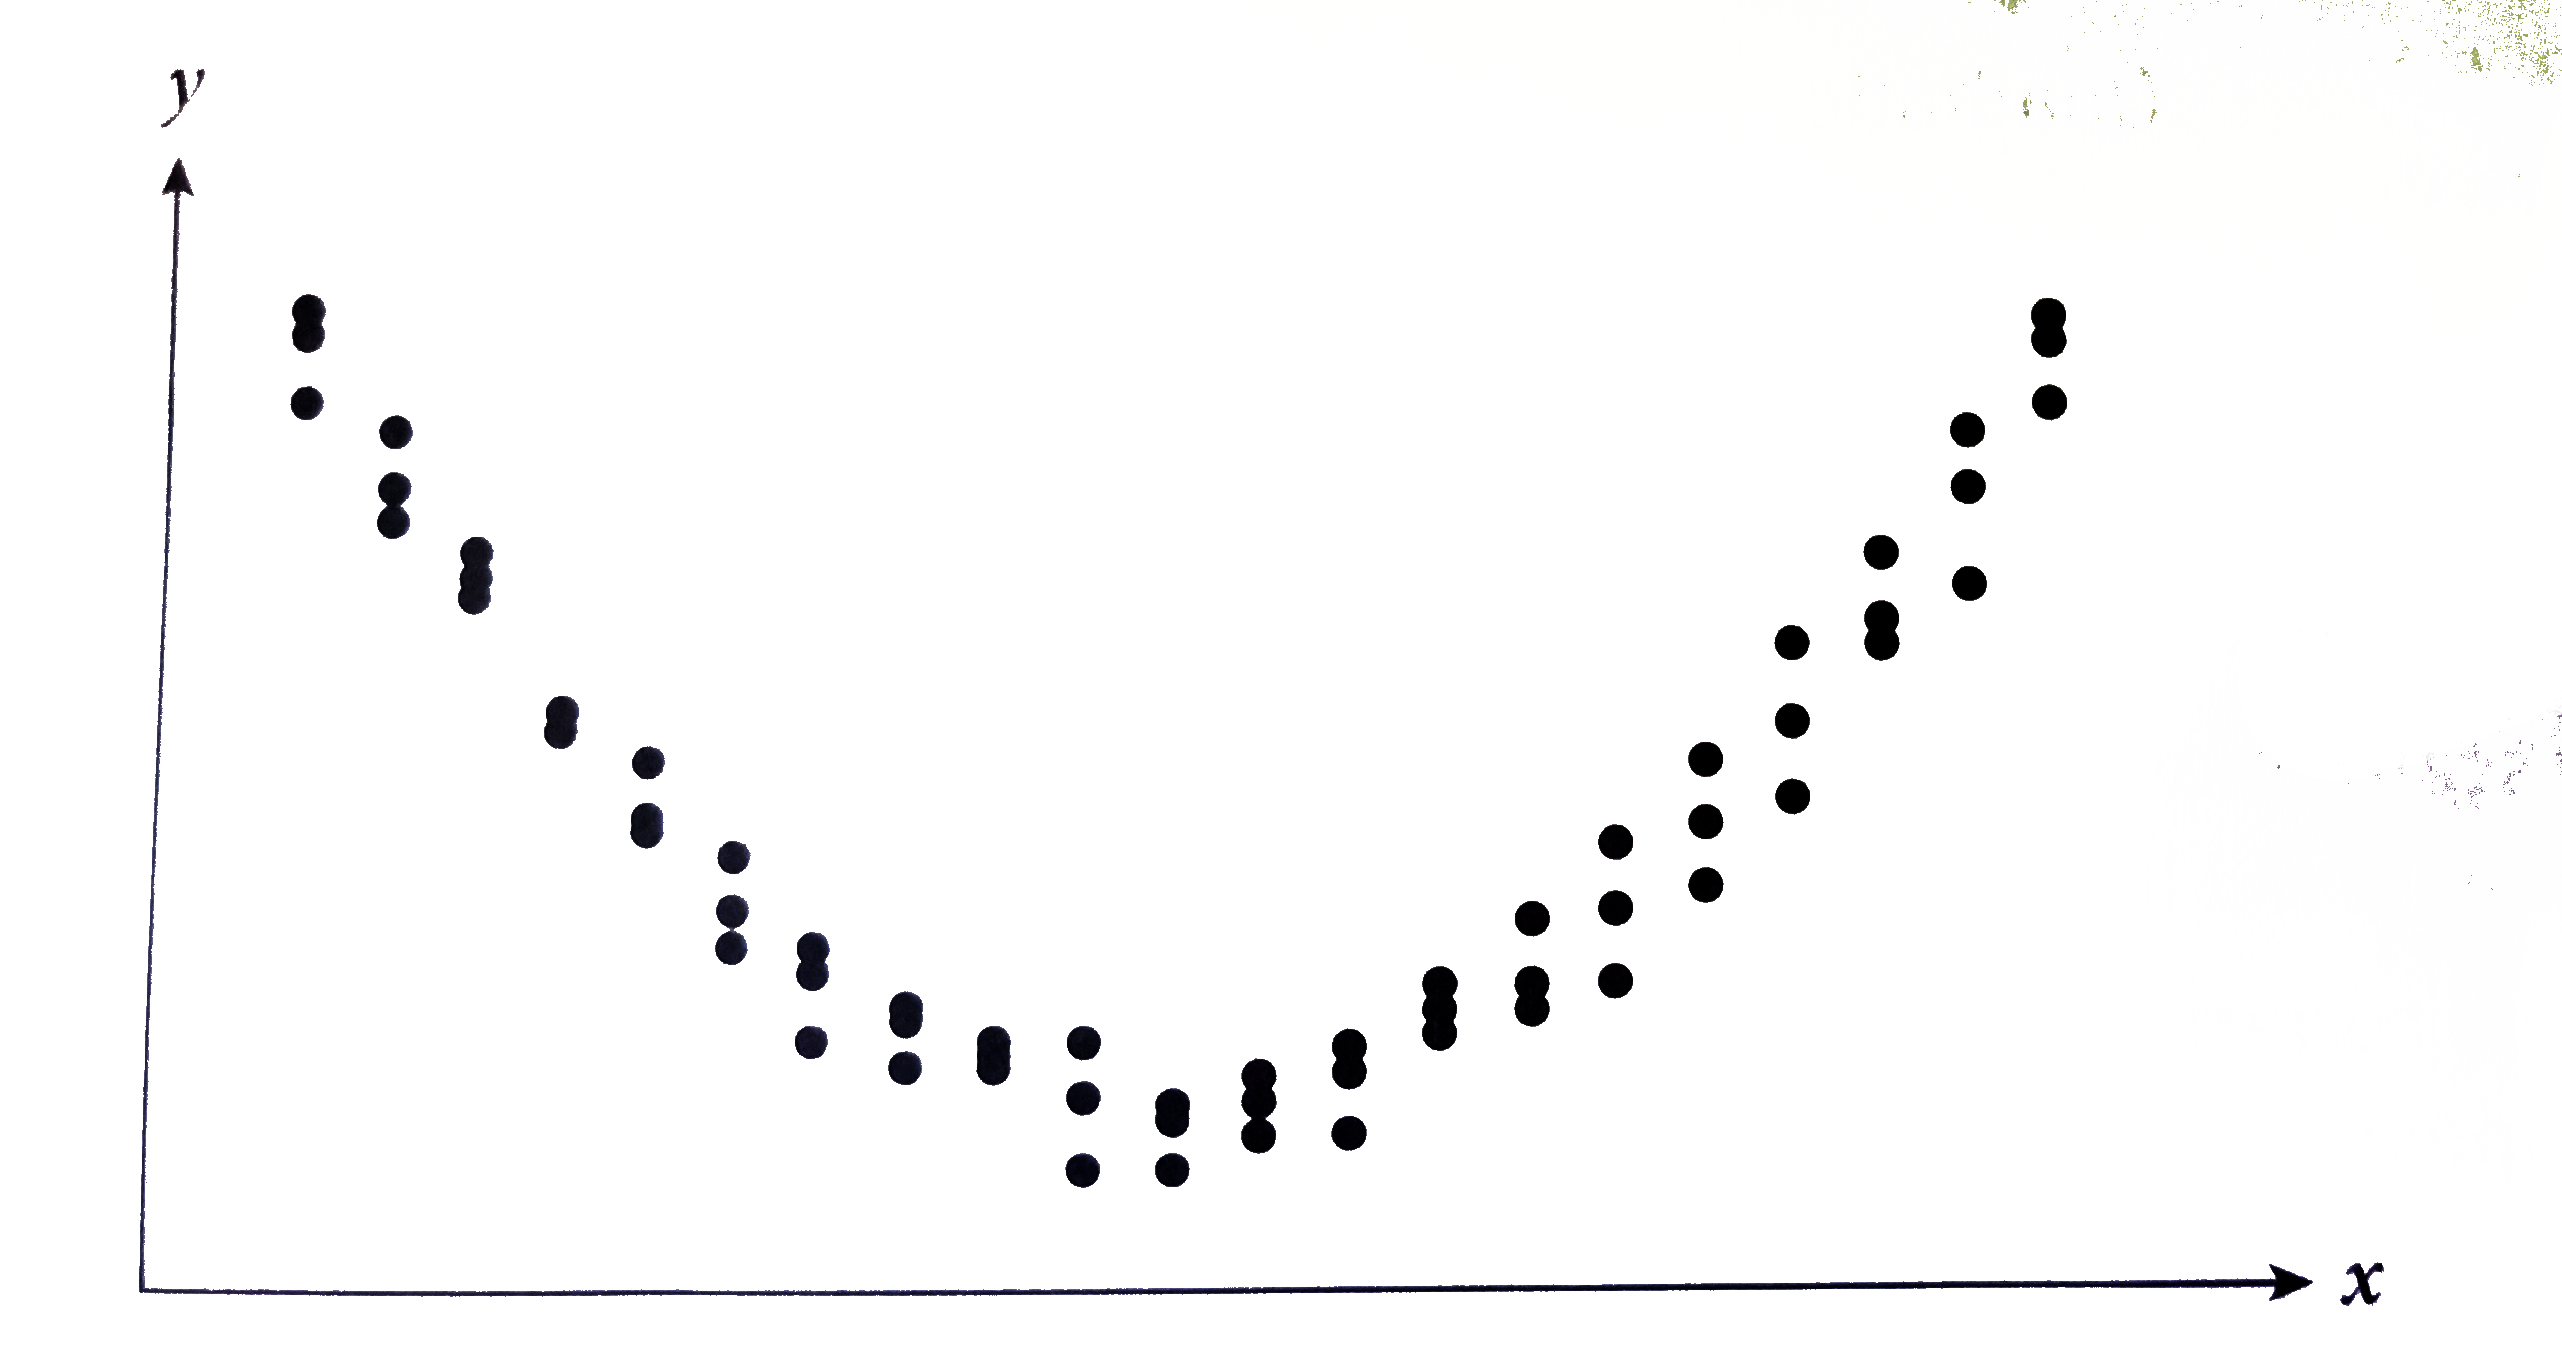
Given that a,b, and c are constants and that a>0, which of the following is the equation for the line of best fit for the above scatterplot ?
View Solution
Given that a,b, and c are constants and that a>0, which of the following is the equation for the line of best fit for the above scatterplot ?
View SolutionIf 79x−16x=13+12, what is the value of x ?
View Solution{5x−3y=106y=kx−42
In the system of linear equations above, k represents a constant. If the system of equations has no solution, what is the value of 2k?
View SolutionHow many lines of symmetry does the above figure have ?
View SolutionWhich of the following are correct chain isomers of butane ? (i)
View SolutionDetermine the point of symmetry of a regular hexagon.
View SolutionComplete adjectant figure so that X-axis and Y-axis are the lines of symmetry of the completed figure.
View SolutionDtermine the images of the following figure about the given line :
View SolutionMatch the following Column A to Column B

View SolutionMatch the following Column A to Column B

View SolutionMatch the following Column A to Column B

View SolutionThe inequation represented by the graph given below is :
View SolutionThe inequation that best describes the graph given below is _________
View Solution