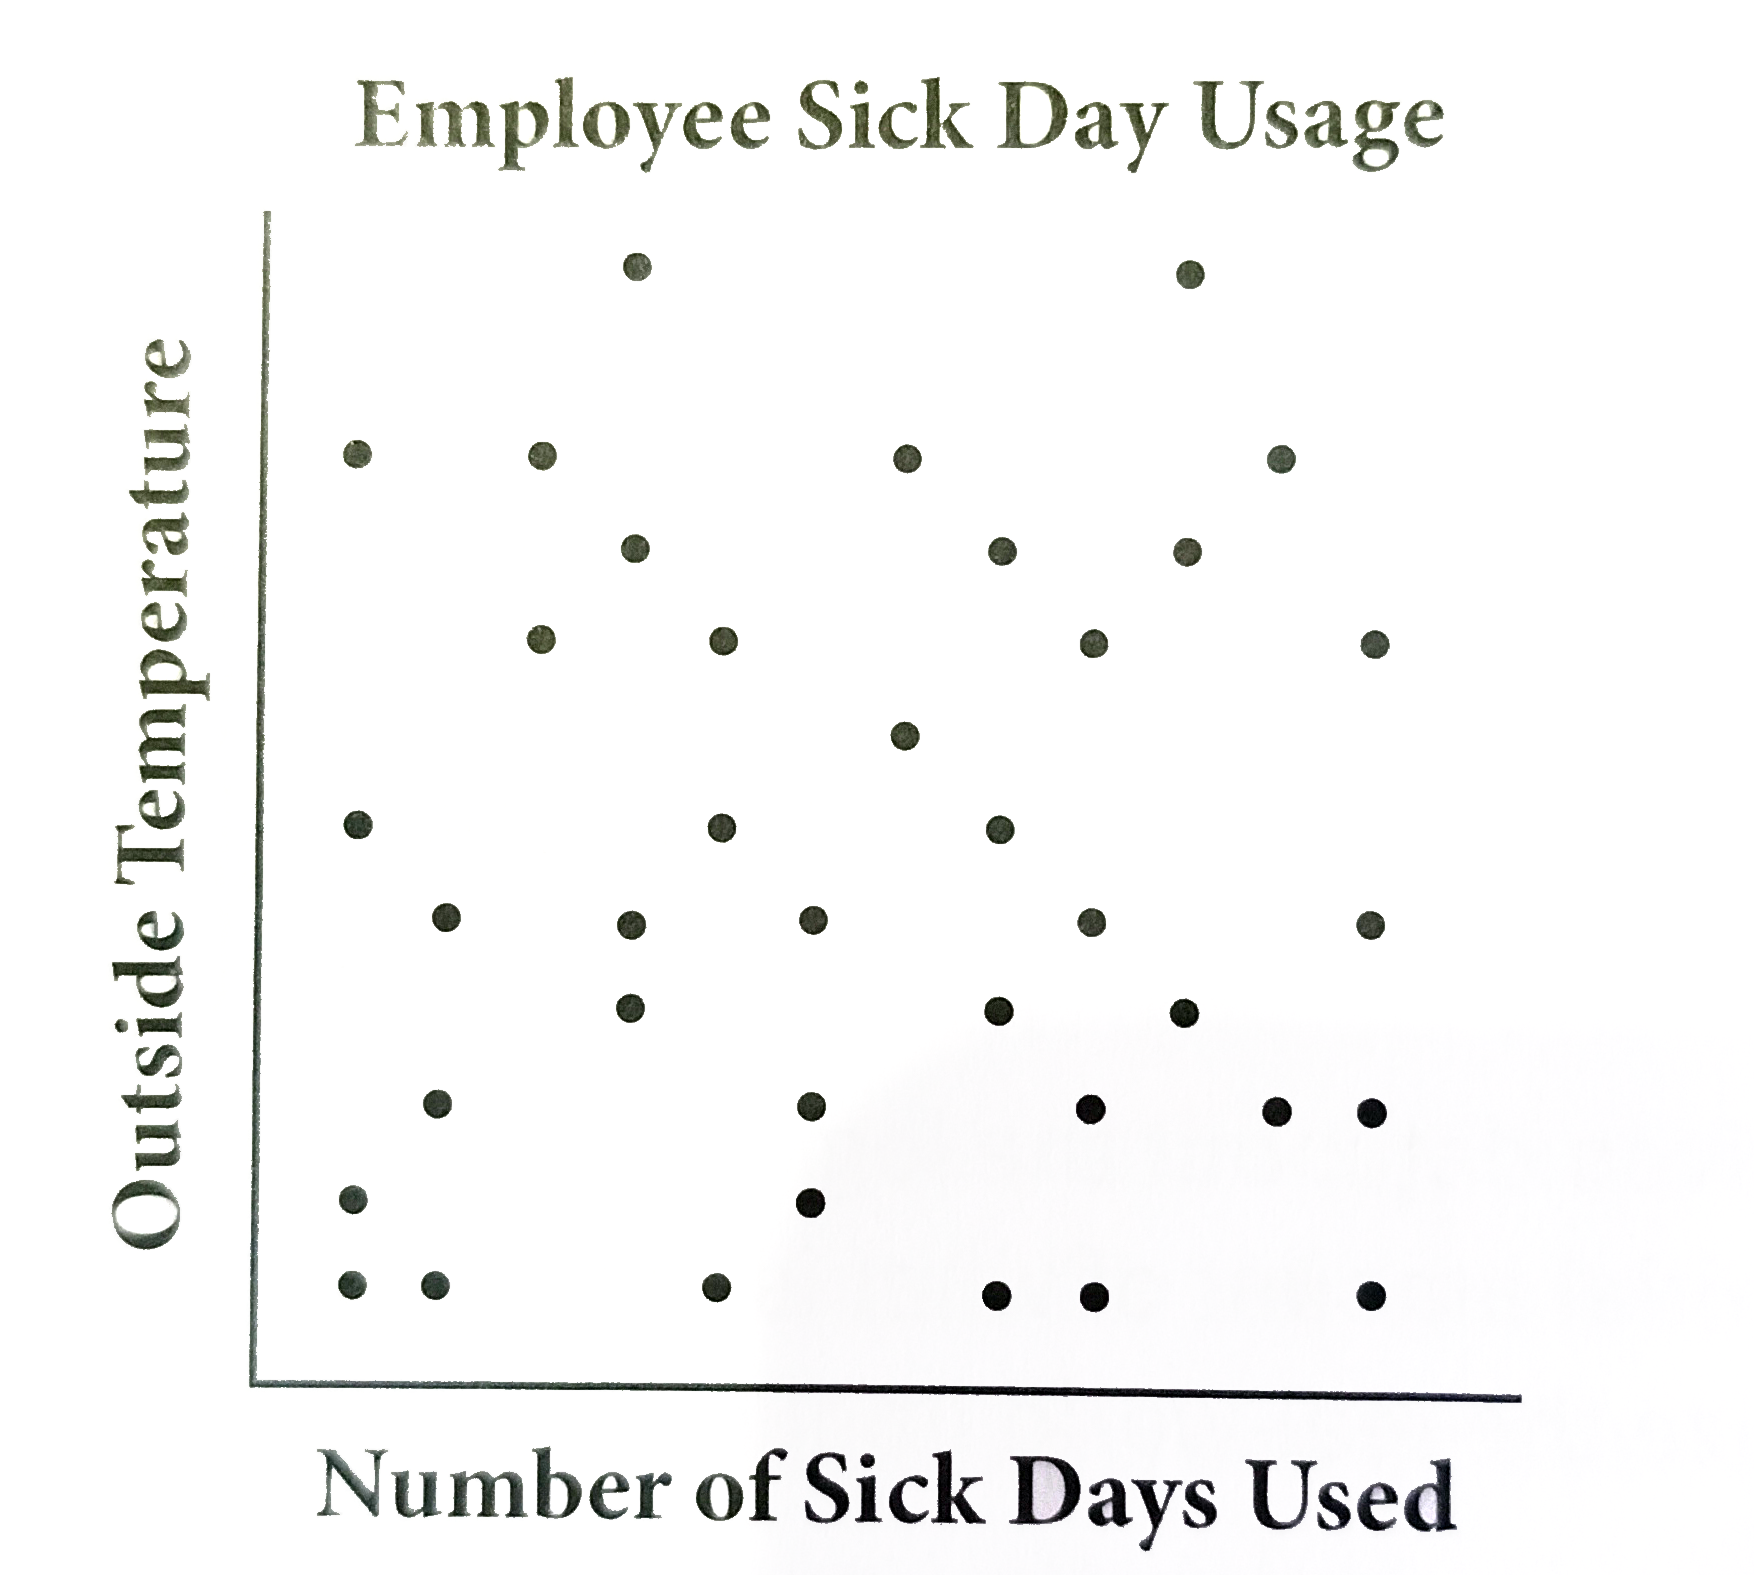
The Human Resources department of a company tracks employee sick day usage to see if there are patterns. One of the HR representatives decides to check employee sick day usage against outside to check employee sick day usage against outside temperature. He compiles the information for the eimpl,oyees' sick day usage and temperature in the scatterplot above. Which of the following conclusion can he draw based on this data ?
There is no relationship between the number of sick days used by employees in general and outside temperature.
There is no relationship between the number of sick days used by this company's employees and outside temperature.
No conclusions can be drawn about the number of sick days used by this company,s employees and outside temperature.
There is a relationship, but not a causal link, between the number of sick days used by this company's employees and outside temperature.
The correct Answer is:B
There are two things to keep in mind for a question like this: correlation does not prove causatin, and as a general rule, conclusions can be drawn only about the population studide, not about all populations. The population studied, not about all populations. The population in the study is only the employees at the company, not all employees in general, so eliminate (A). The data points are scattered and do not form any discernible pattern. This means there is no correlation, which is another way of saying the two variables aren't related, so you can eliminate (D). You can also eliminate (C ) because the HR representative is able to draw a conclusion-that there is no relationship. Therefore, (B ) is correct.
Topper's Solved these Questions
- SCATTERPLOTSBook:KAPLANChapter:SCATTERPLOTSExercise:LINE OF BEST FIT
Explore 1 Video
- SCATTERPLOTSBook:KAPLANChapter:SCATTERPLOTSExercise:SCATTERPLOT MODELING
Explore 1 Video
- SCATTERPLOTSBook:KAPLANChapter:SCATTERPLOTSExercise:SCATTERPLOT MODELING
Explore 1 Video
- SAT MATH: TIMING ANS SECTION MANAGEMENT STRATEGIESBook:KAPLANChapter:SAT MATH: TIMING ANS SECTION MANAGEMENT STRATEGIESExercise:TRY ON YOU OWN
Explore 5 Videos
- SYSTEMS OF LINEAR EQUATIONSBook:KAPLANChapter:SYSTEMS OF LINEAR EQUATIONSExercise:NUMBER OF POSSIBLE SOLUTIONS
Explore 1 Video
Similar Questions

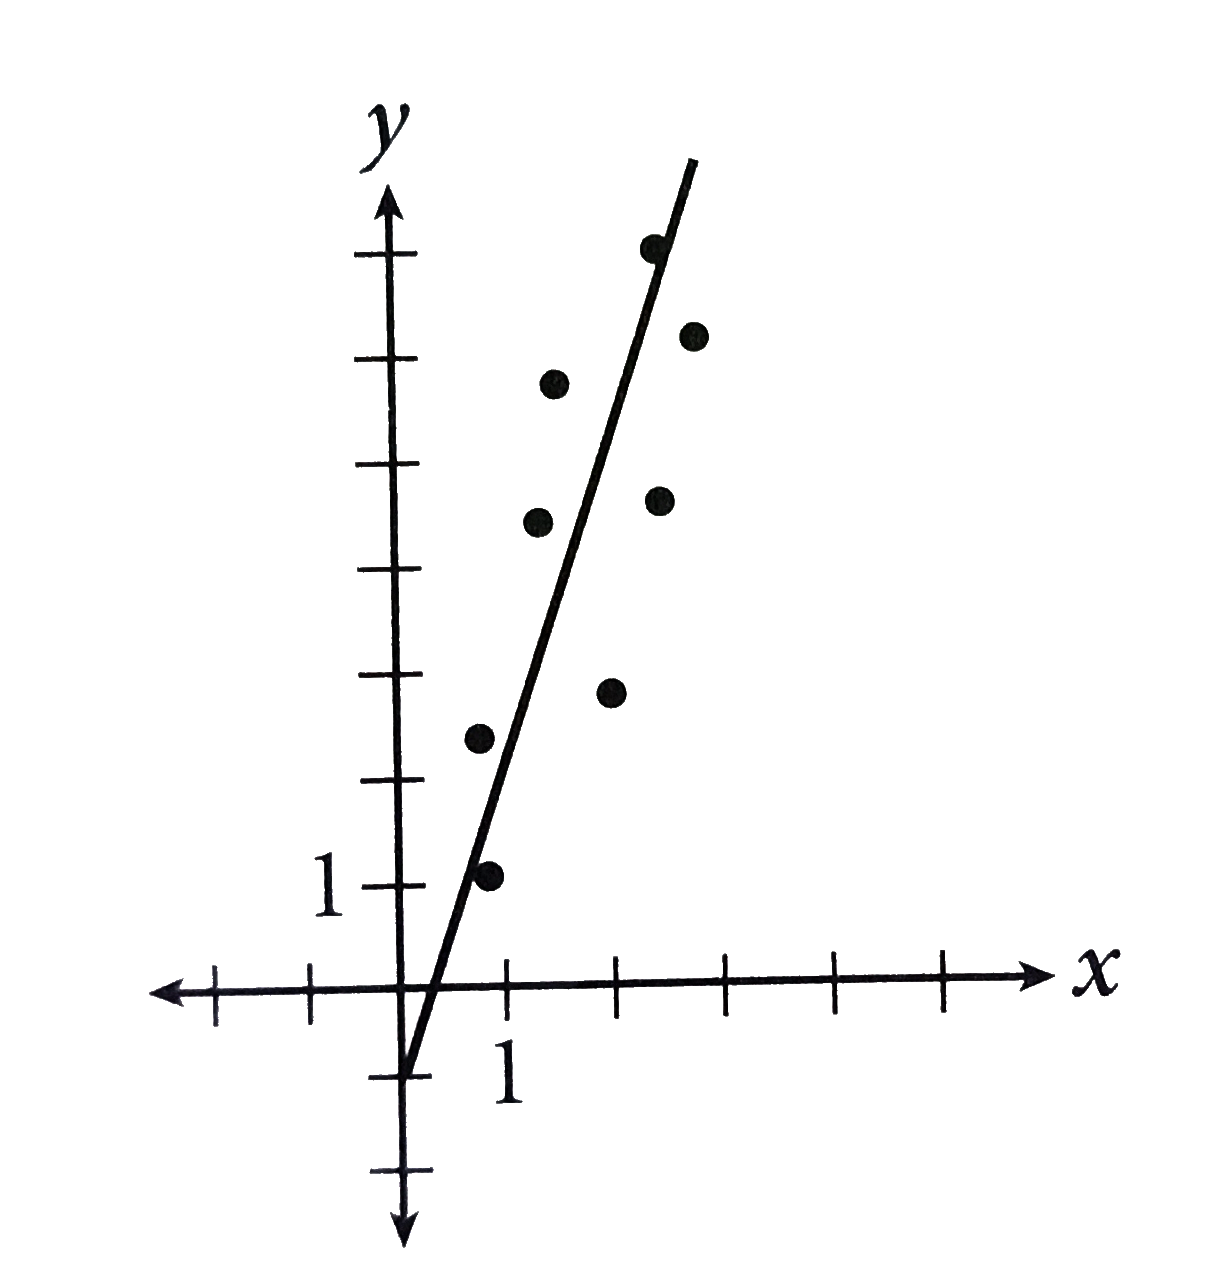
Which of the following equation corresponds to the line of best fit for the data set shown above ?
View Solution
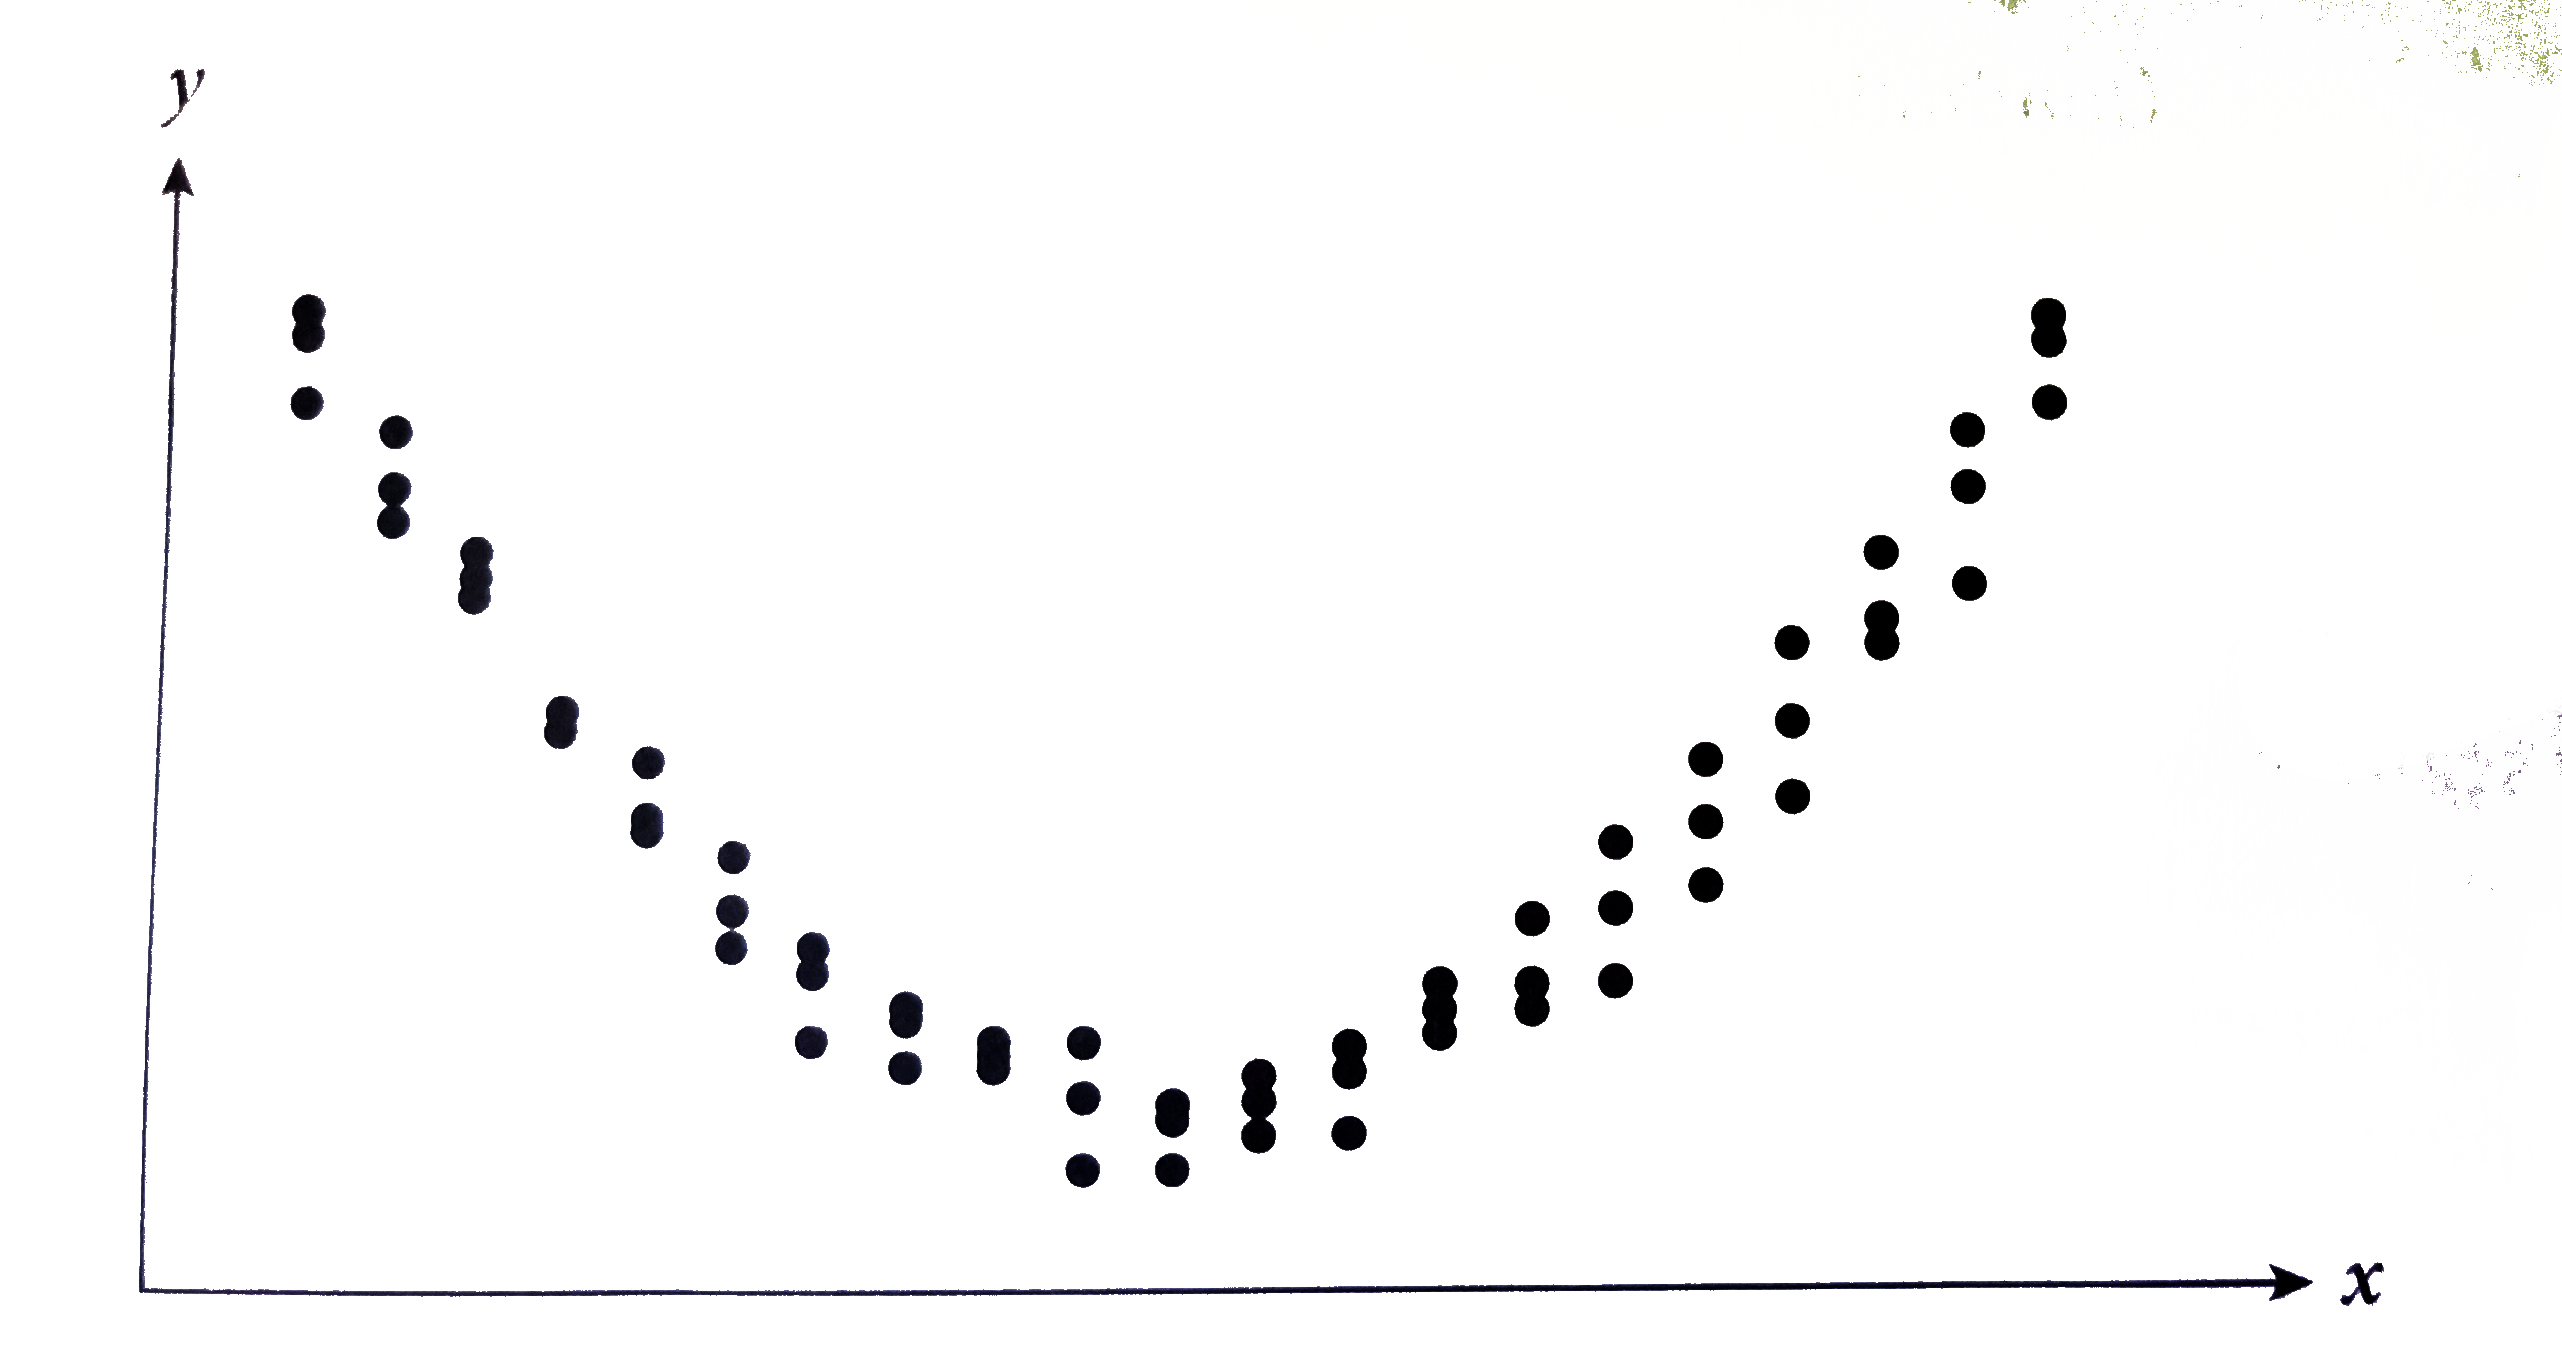
Given that a,b, and c are constants and that a>0, which of the following is the equation for the line of best fit for the above scatterplot ?
View Solution
Given that a,b, and c are constants and that a>0, which of the following is the equation for the line of best fit for the above scatterplot ?
View SolutionIf 79x−16x=13+12, what is the value of x ?
View Solution{5x−3y=106y=kx−42
In the system of linear equations above, k represents a constant. If the system of equations has no solution, what is the value of 2k?
View SolutionHow many lines of symmetry does the above figure have ?
View SolutionWhich of the following are correct chain isomers of butane ? (i)
View SolutionDetermine the point of symmetry of a regular hexagon.
View SolutionDtermine the images of the following figure about the given line :
View SolutionDraw the bisector of ∠AOB=58∘
ltimg src="https://d10lpgp6xz60nq.cloudfront.net/physics_images/PS_MATH_VII_C05_S01_009_Q01.png" width="80%"gt
View SolutionMatch the following Column A to Column B

View SolutionMatch the following Column A to Column B

View SolutionMatch the following Column A to Column B

View SolutionThe inequation represented by the graph given below is :
View SolutionThe inequation that best describes the graph given below is _________
View Solution

