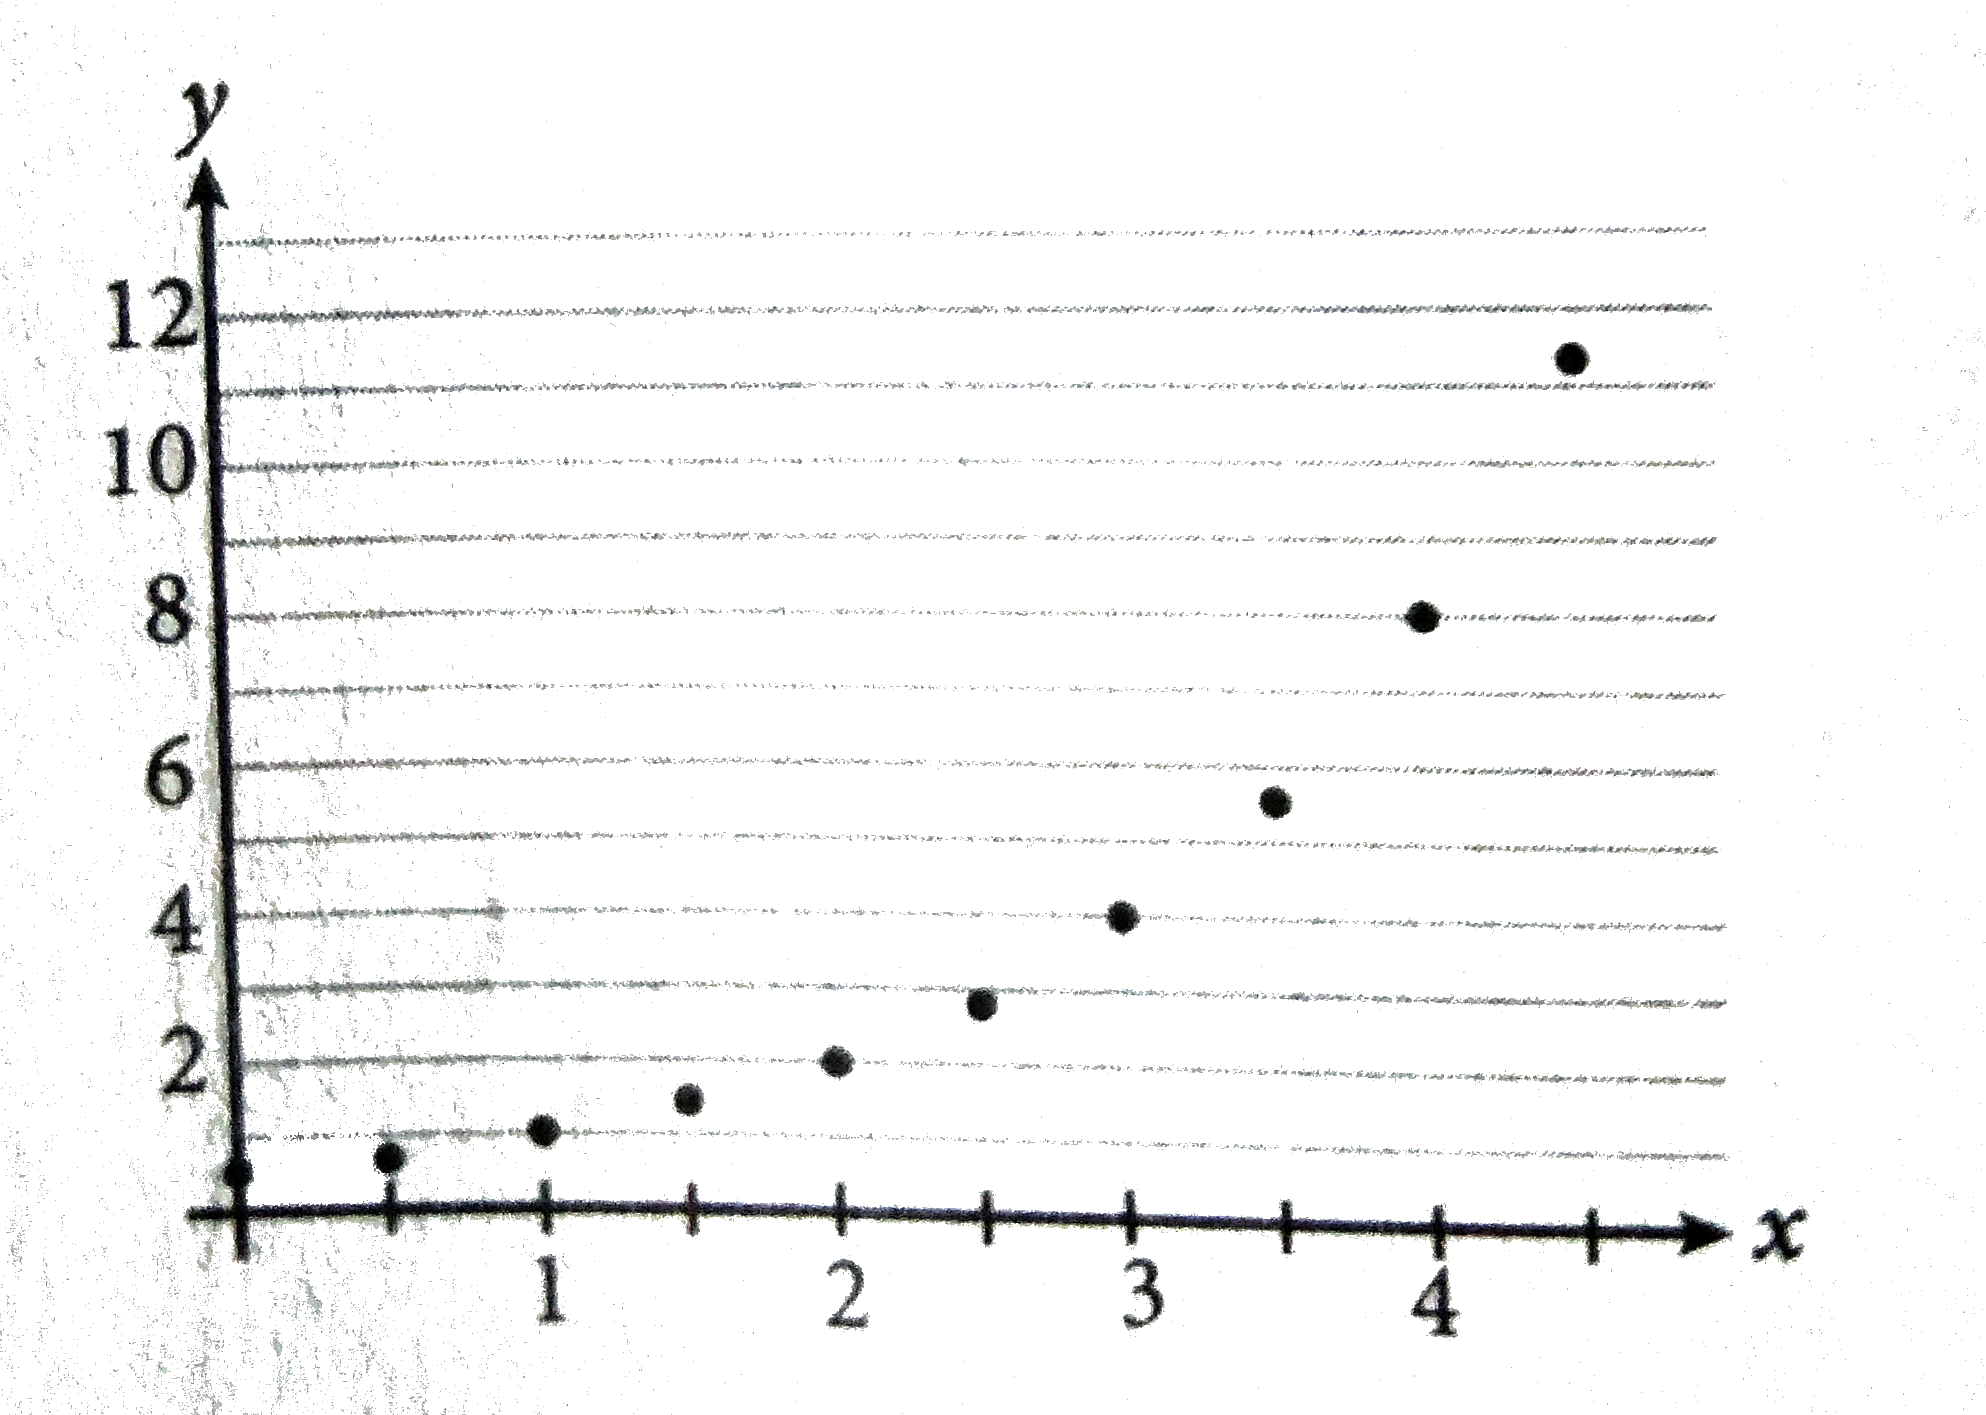
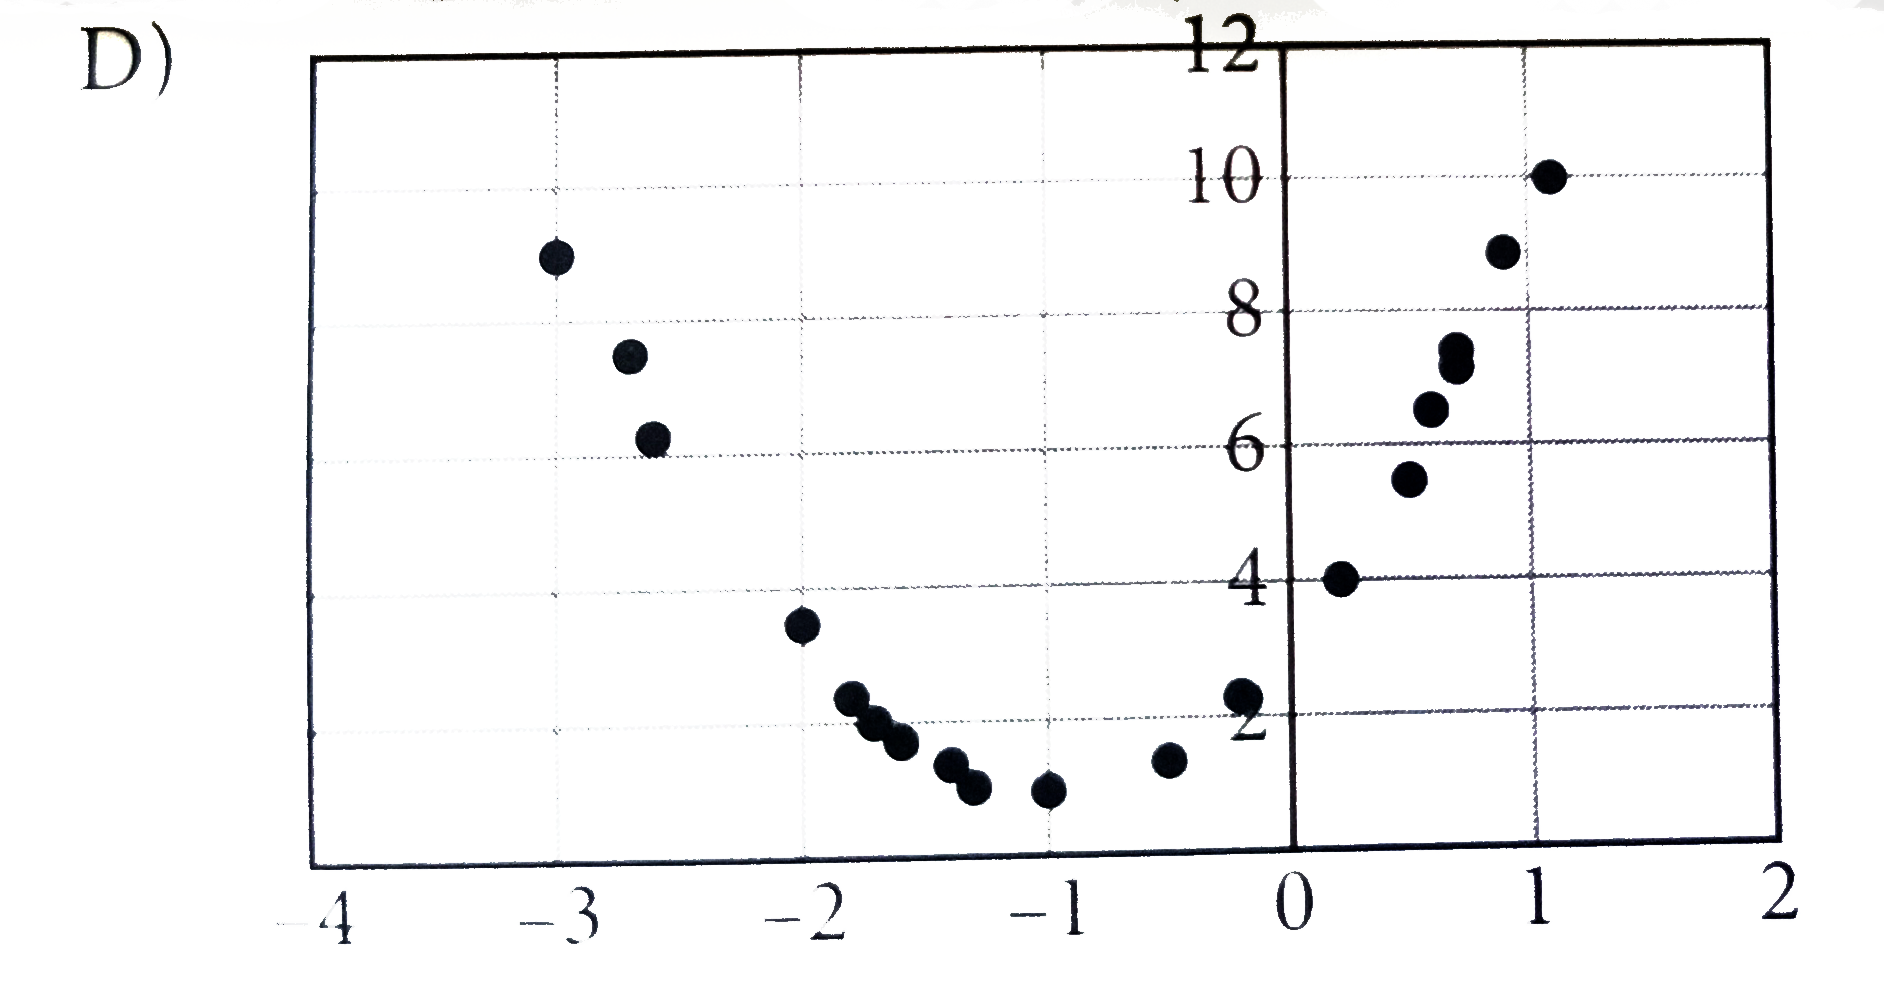
Which of the following scatterplots shows a ralationship that is appropriately modeled with the equation y=−ax2+bx−c, where a and c are negative and b is positive ?
A
B
C
D
Video Solution
Text Solution
The correct Answer is:D
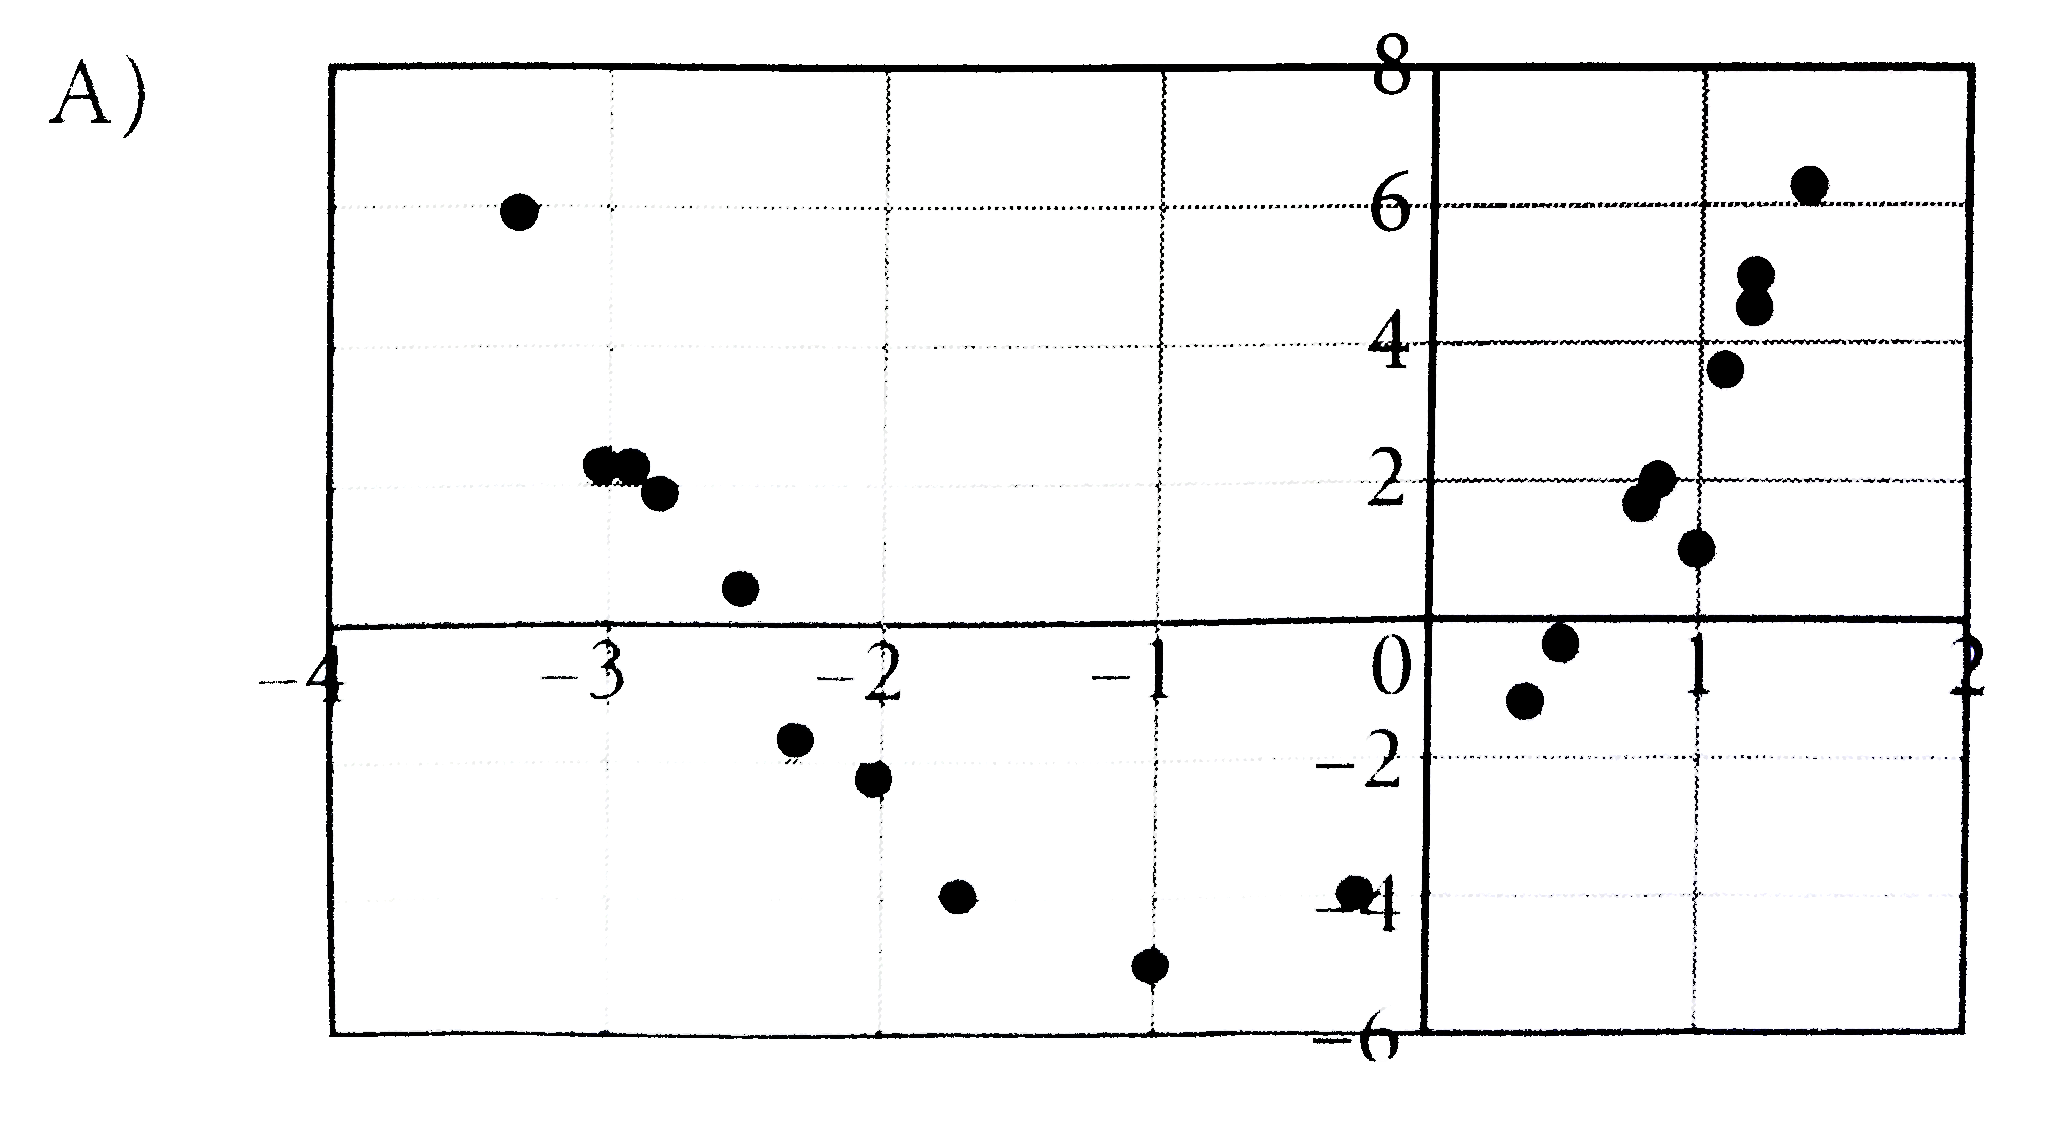
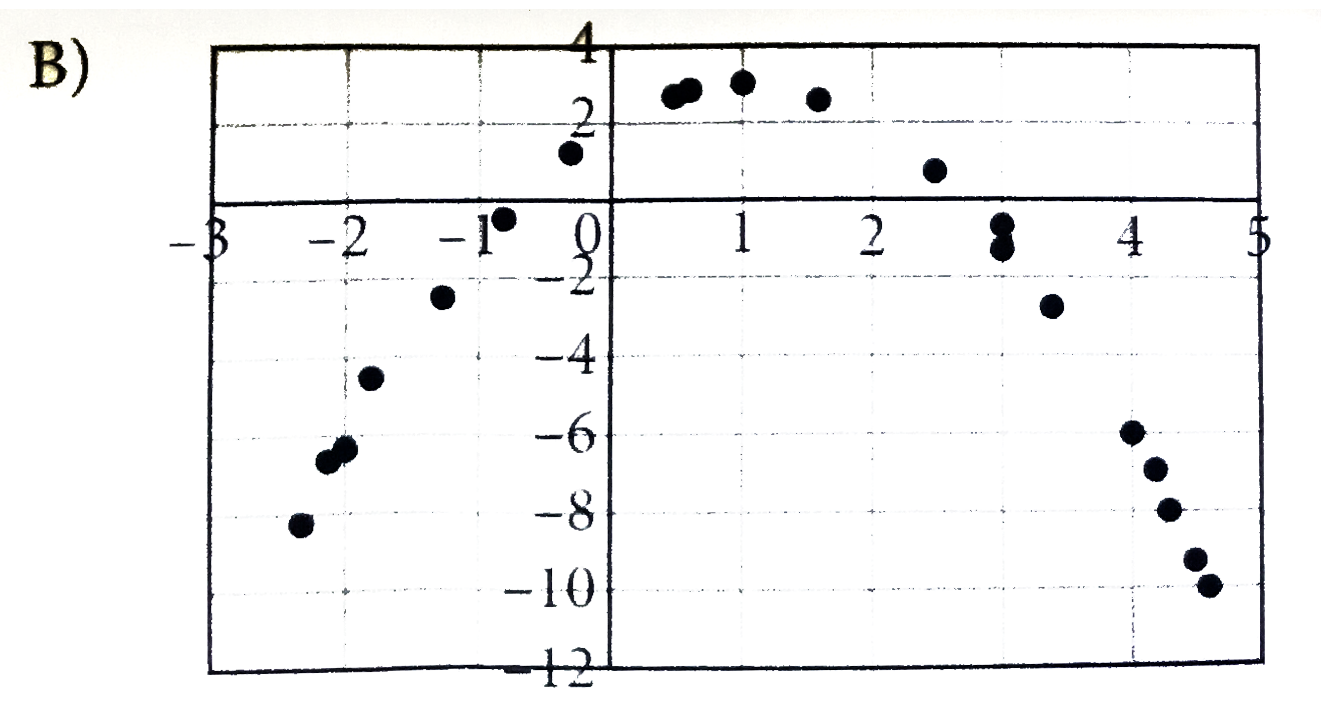
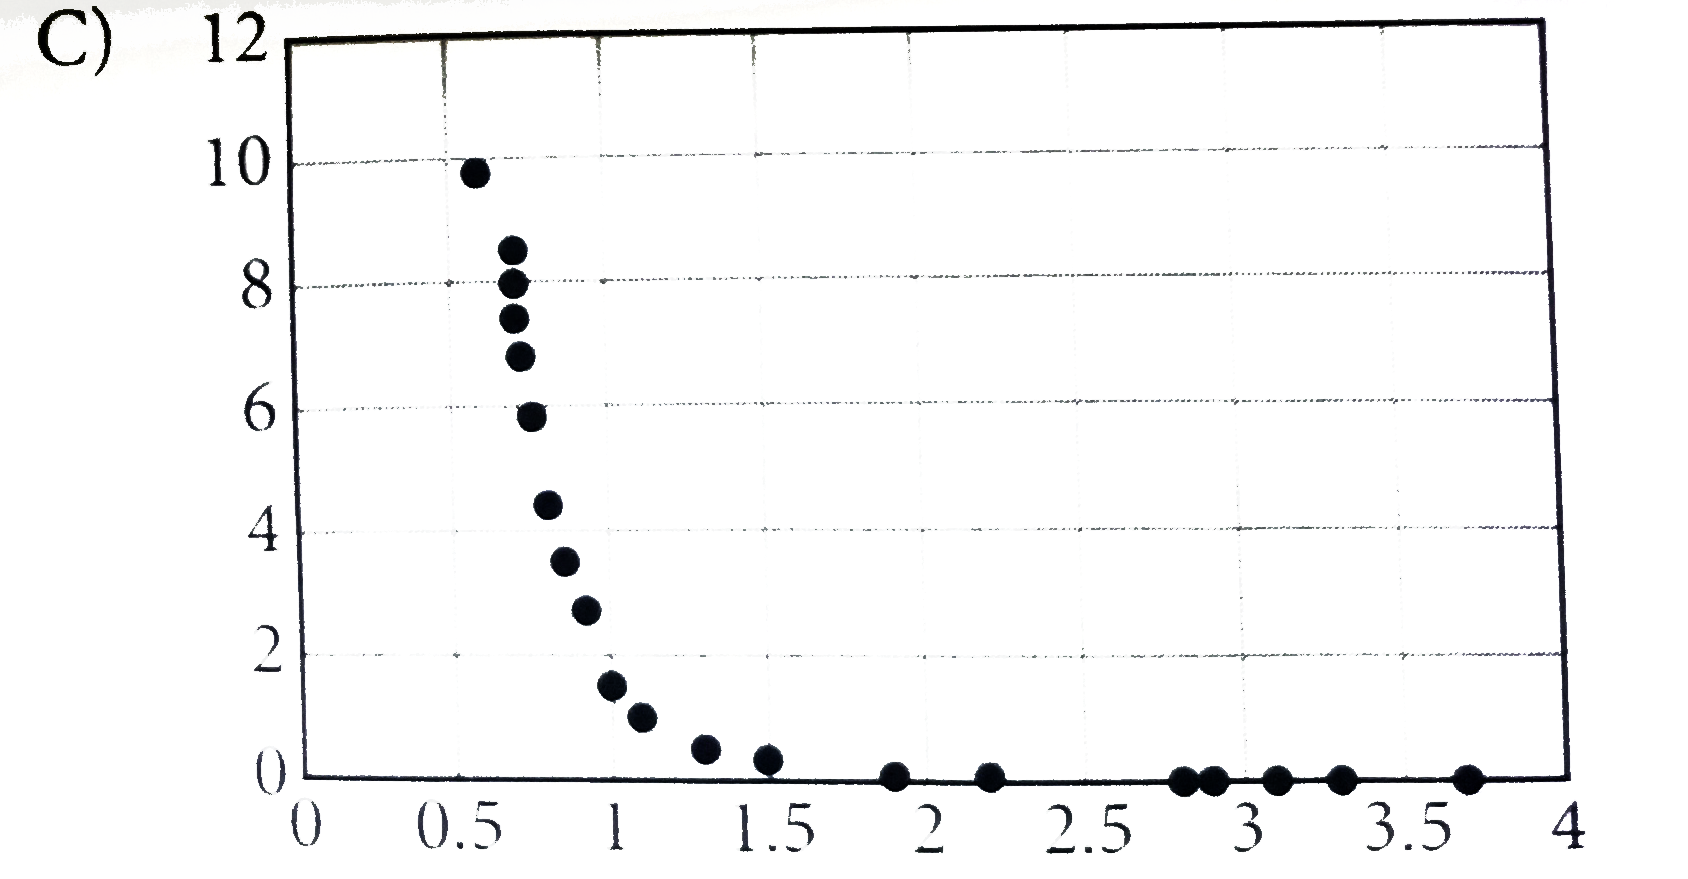
Sketch in the lines of best fit for the answer choices. (A) and (D) are parabilas that open up, (B) is a parabola that opens doen, can (C ) is an exponetial curve. The equation that needs to be modeled is y=−ax2+bx−c, which is quadratic and graphs as a parabola. Eliminate (C ). Pay careful attention to the details "a and c are negative and b is positive. " The coefficient in front of the x2 term determines whether the parabola opens up or down. The negative sign in front of the a multiplies by the negative value for a to create a positive coefficient in front of the x2 term, which means that the parabola opens up. Eliminate (B). Finally, the c coefficient in the equatino determines the y-intercept for the graph. Again, the negative sign in front of c multiplies by the negative value of c to create a positive y-intercept. Eliminate (A) because the best fit parabola has a negative y-intercept (D) is correct.
|
Topper's Solved these Questions
- SCATTERPLOTSBook:KAPLANChapter:SCATTERPLOTSExercise:LINE OF BEST FIT
Explore 1 Video
- SCATTERPLOTSBook:KAPLANChapter:SCATTERPLOTSExercise:SCATTERPLOT MODELING
Explore 1 Video
- SCATTERPLOTSBook:KAPLANChapter:SCATTERPLOTSExercise:SCATTERPLOT MODELING
Explore 1 Video
- SAT MATH: TIMING ANS SECTION MANAGEMENT STRATEGIESBook:KAPLANChapter:SAT MATH: TIMING ANS SECTION MANAGEMENT STRATEGIESExercise:TRY ON YOU OWN
Explore 5 Videos
- SYSTEMS OF LINEAR EQUATIONSBook:KAPLANChapter:SYSTEMS OF LINEAR EQUATIONSExercise:NUMBER OF POSSIBLE SOLUTIONS
Explore 1 Video
Similar Questions
Knowledge Check
Which of the following scatterplots shows a relationship that is appropriately modeled with the equation y=axb , where a is positive and b is negative?
A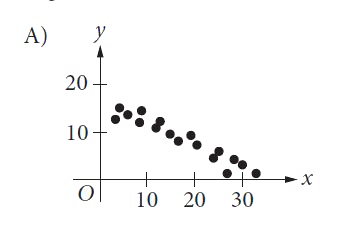 B
B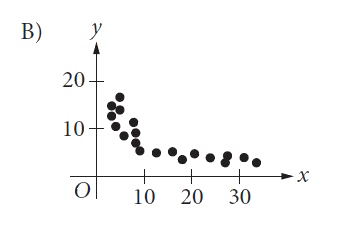 C
C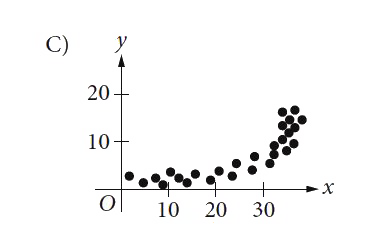 D
D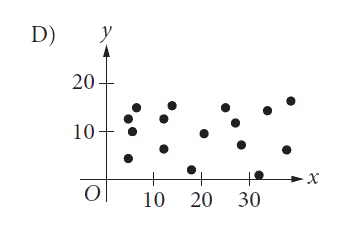
Which of the following scatterplot could be modeled by the equation y=abx, where a and b are constant such that a>1andx<−1?
A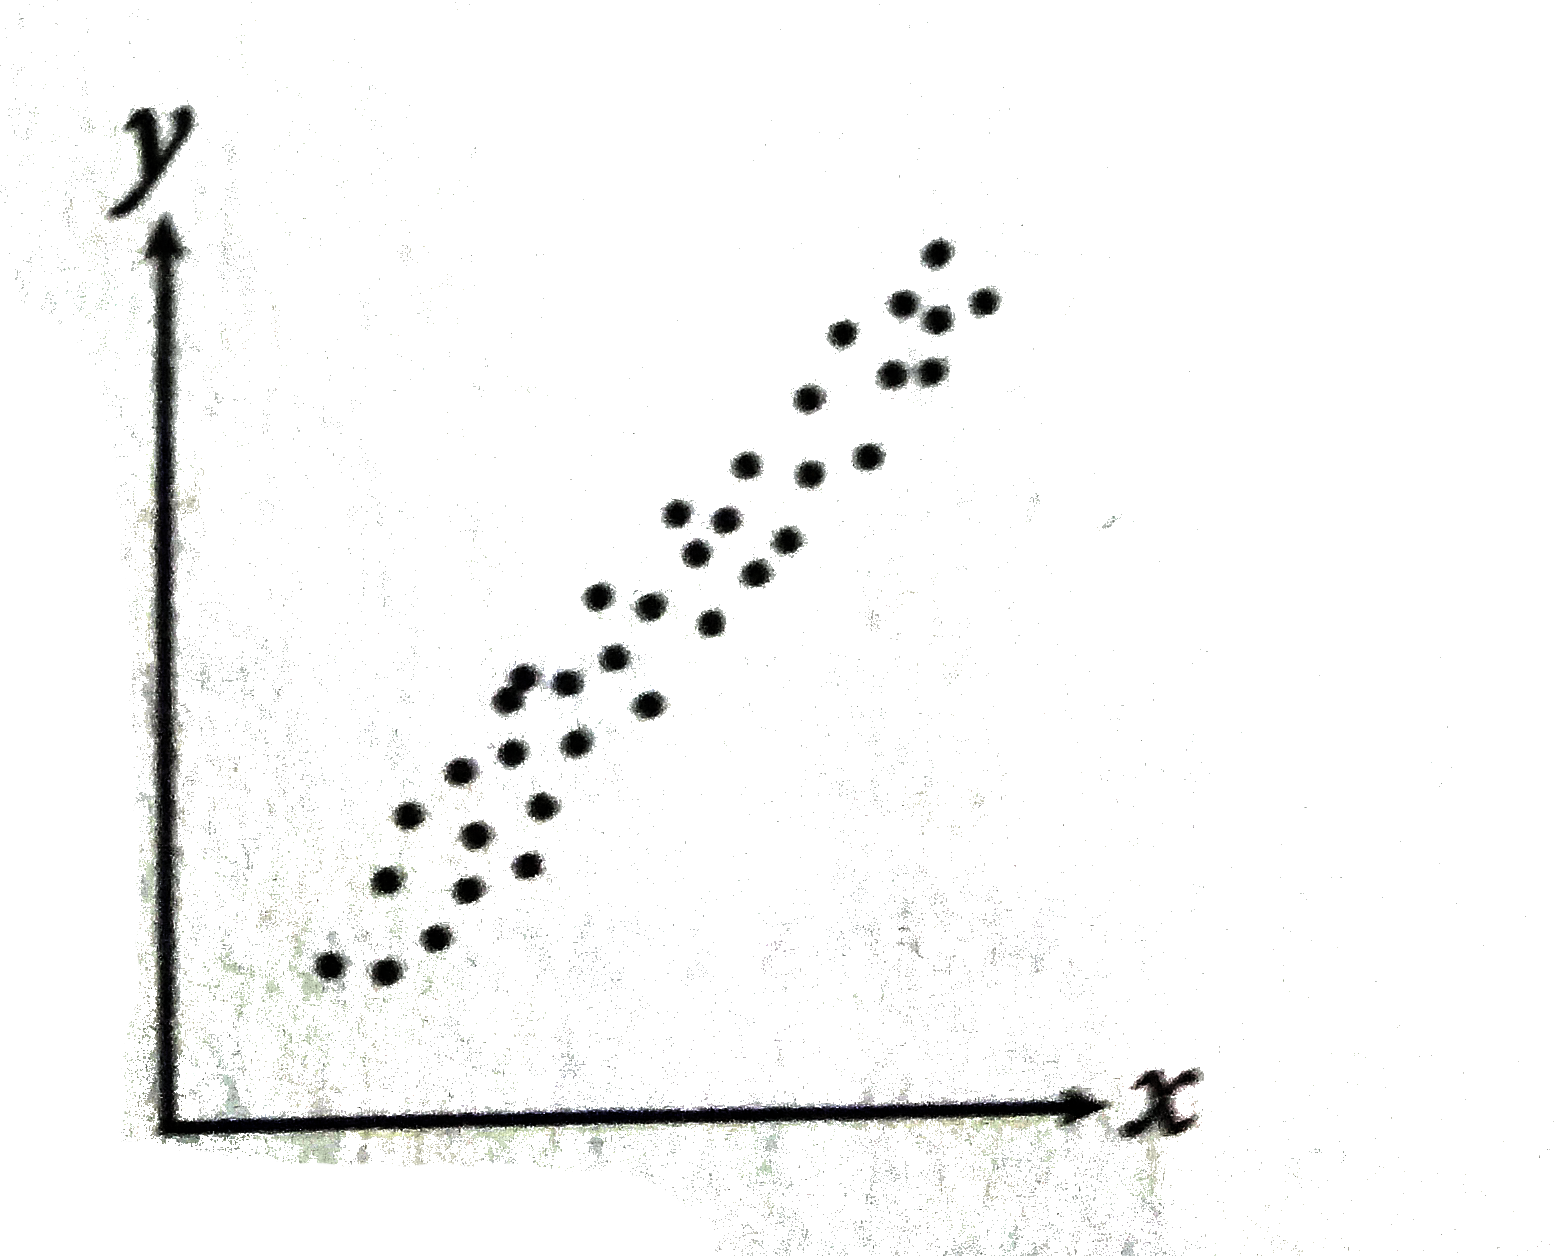 B
B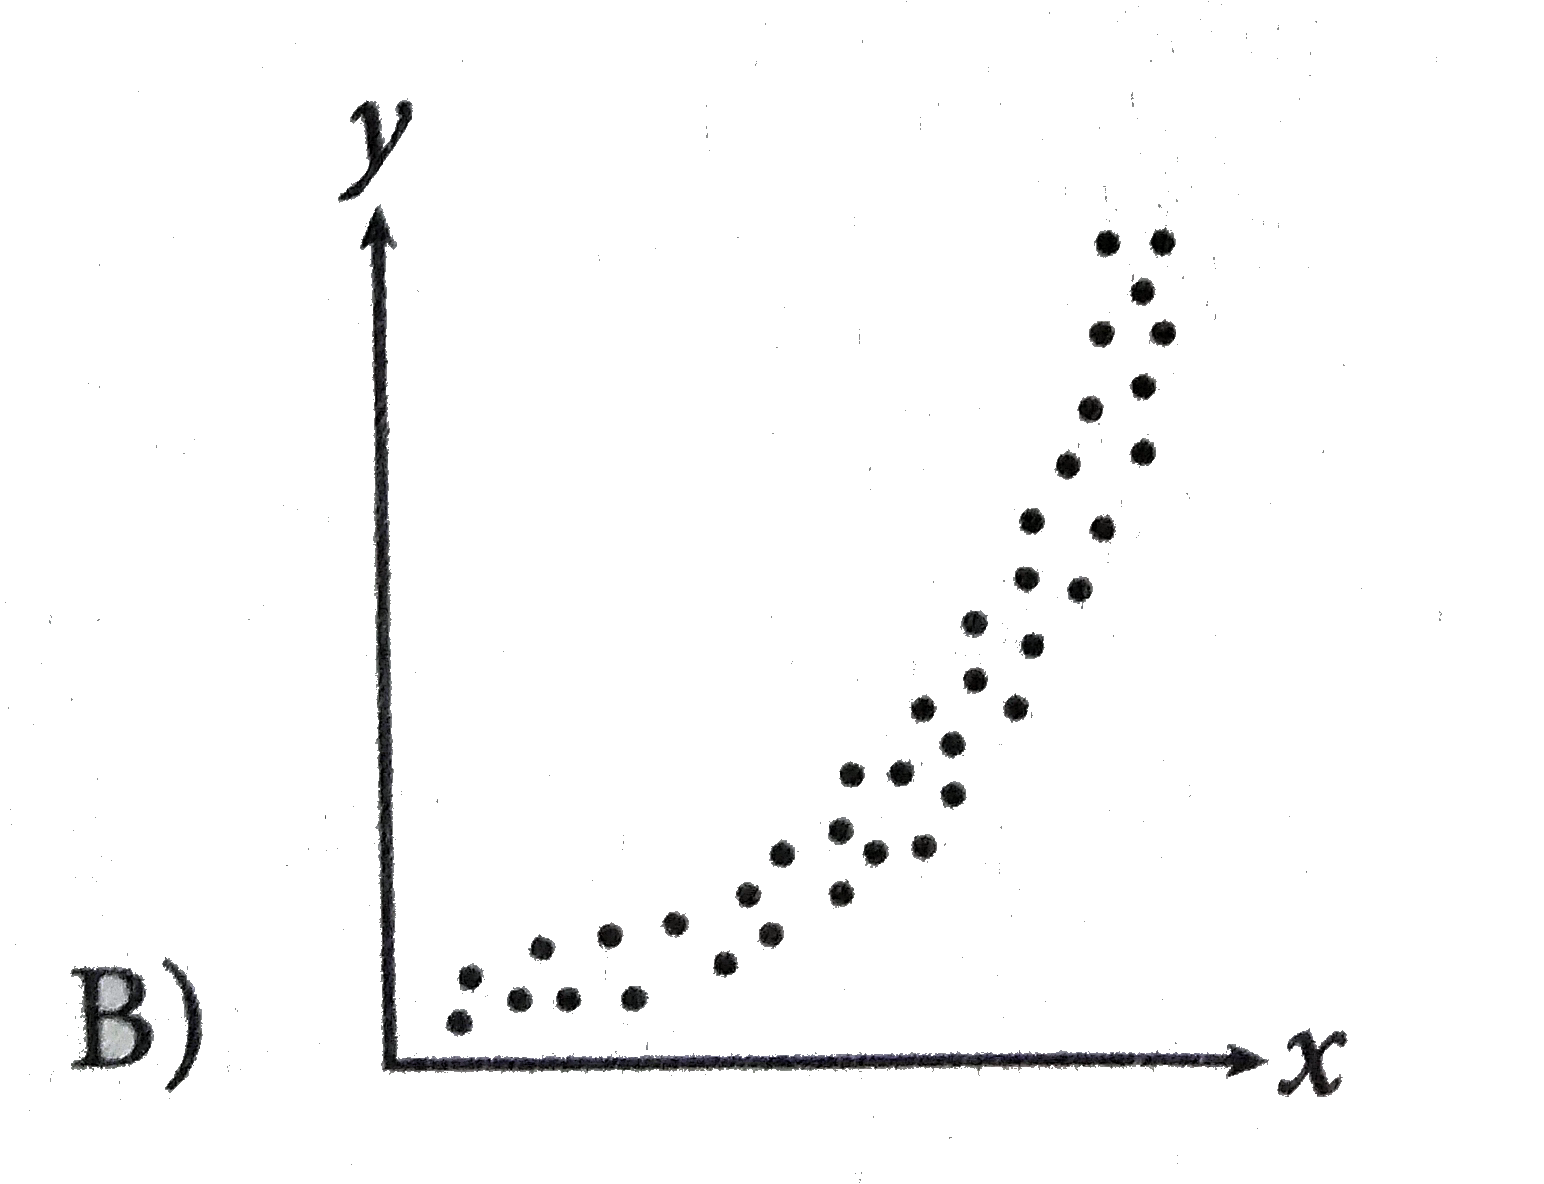 C
C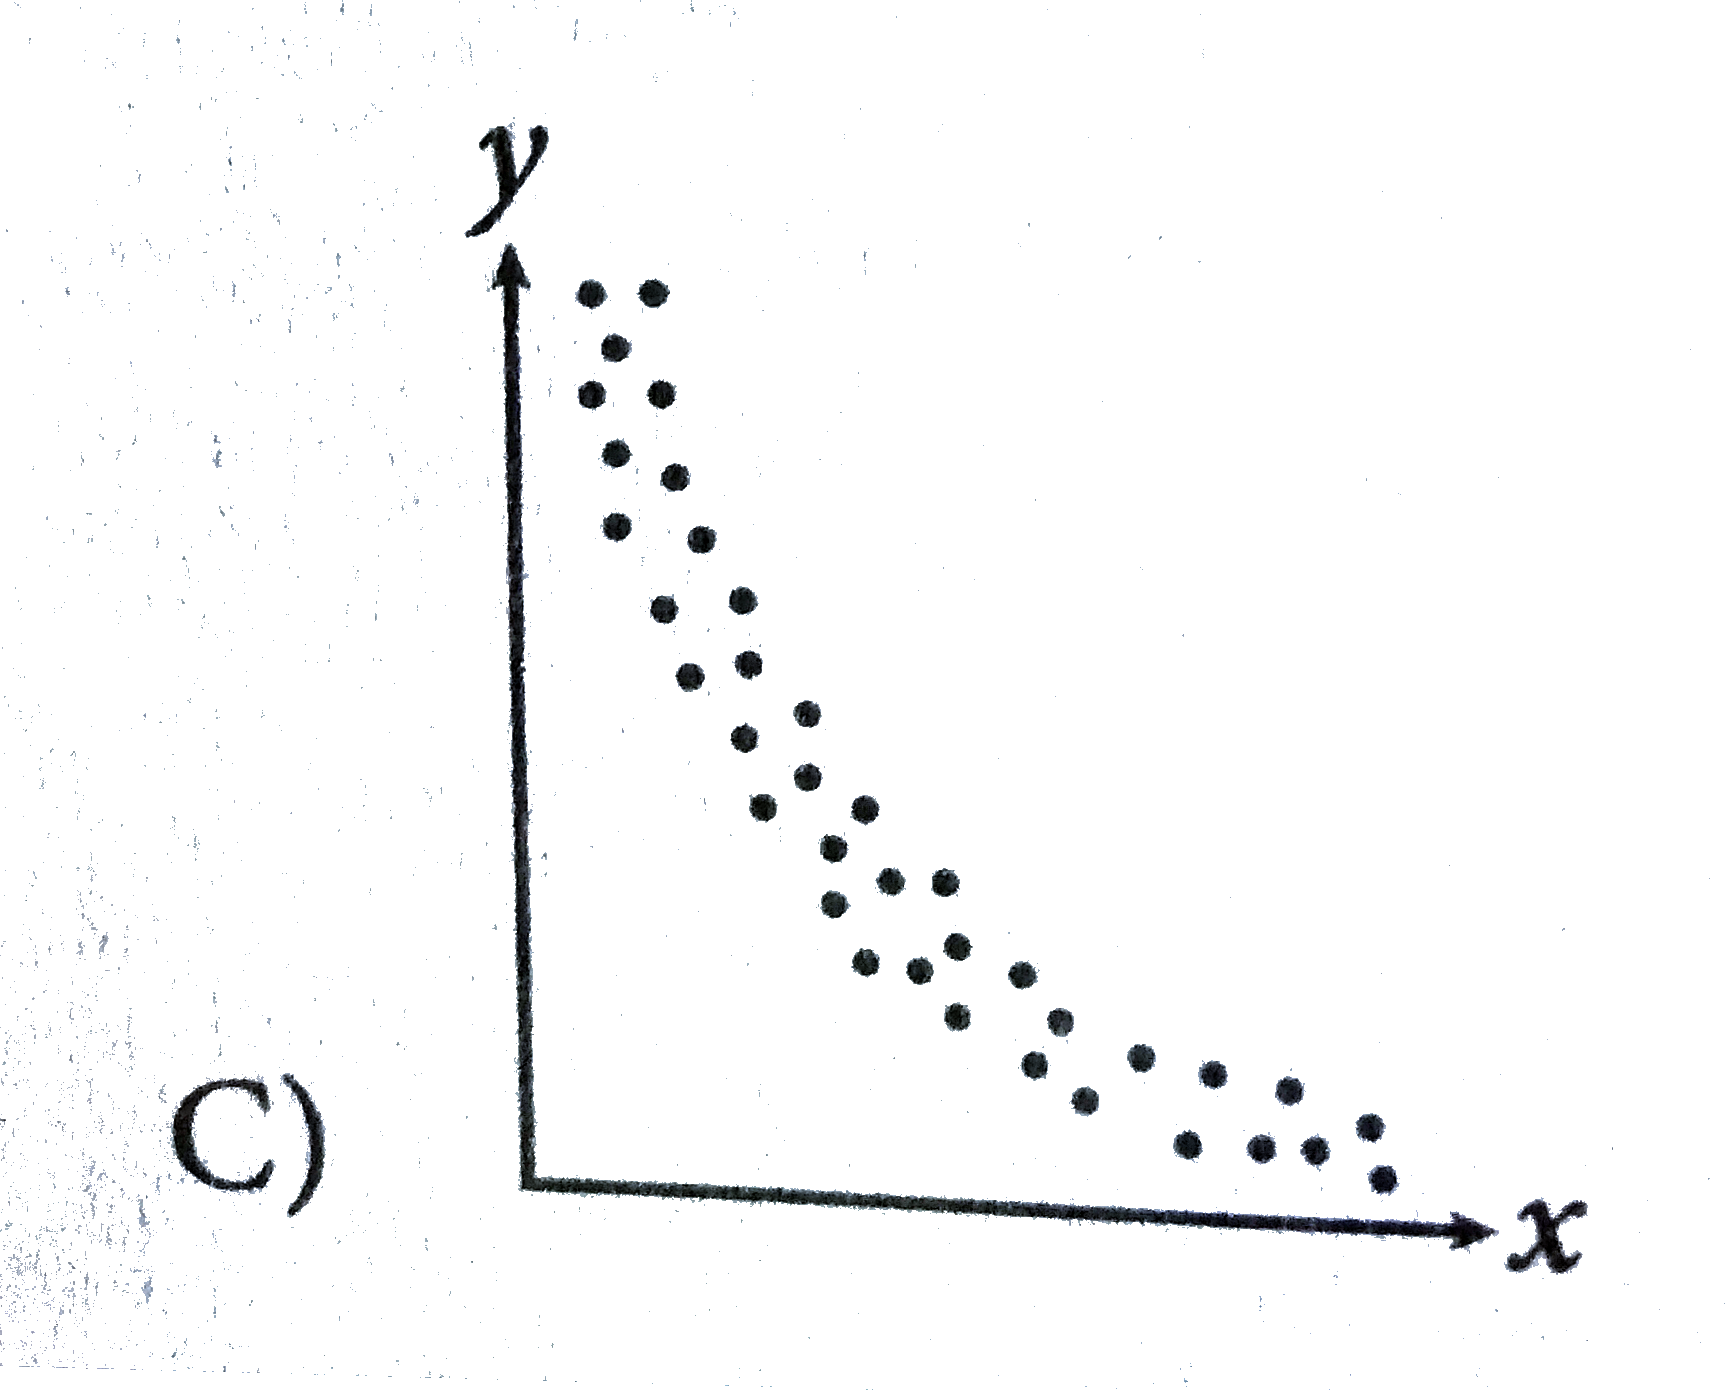 D
D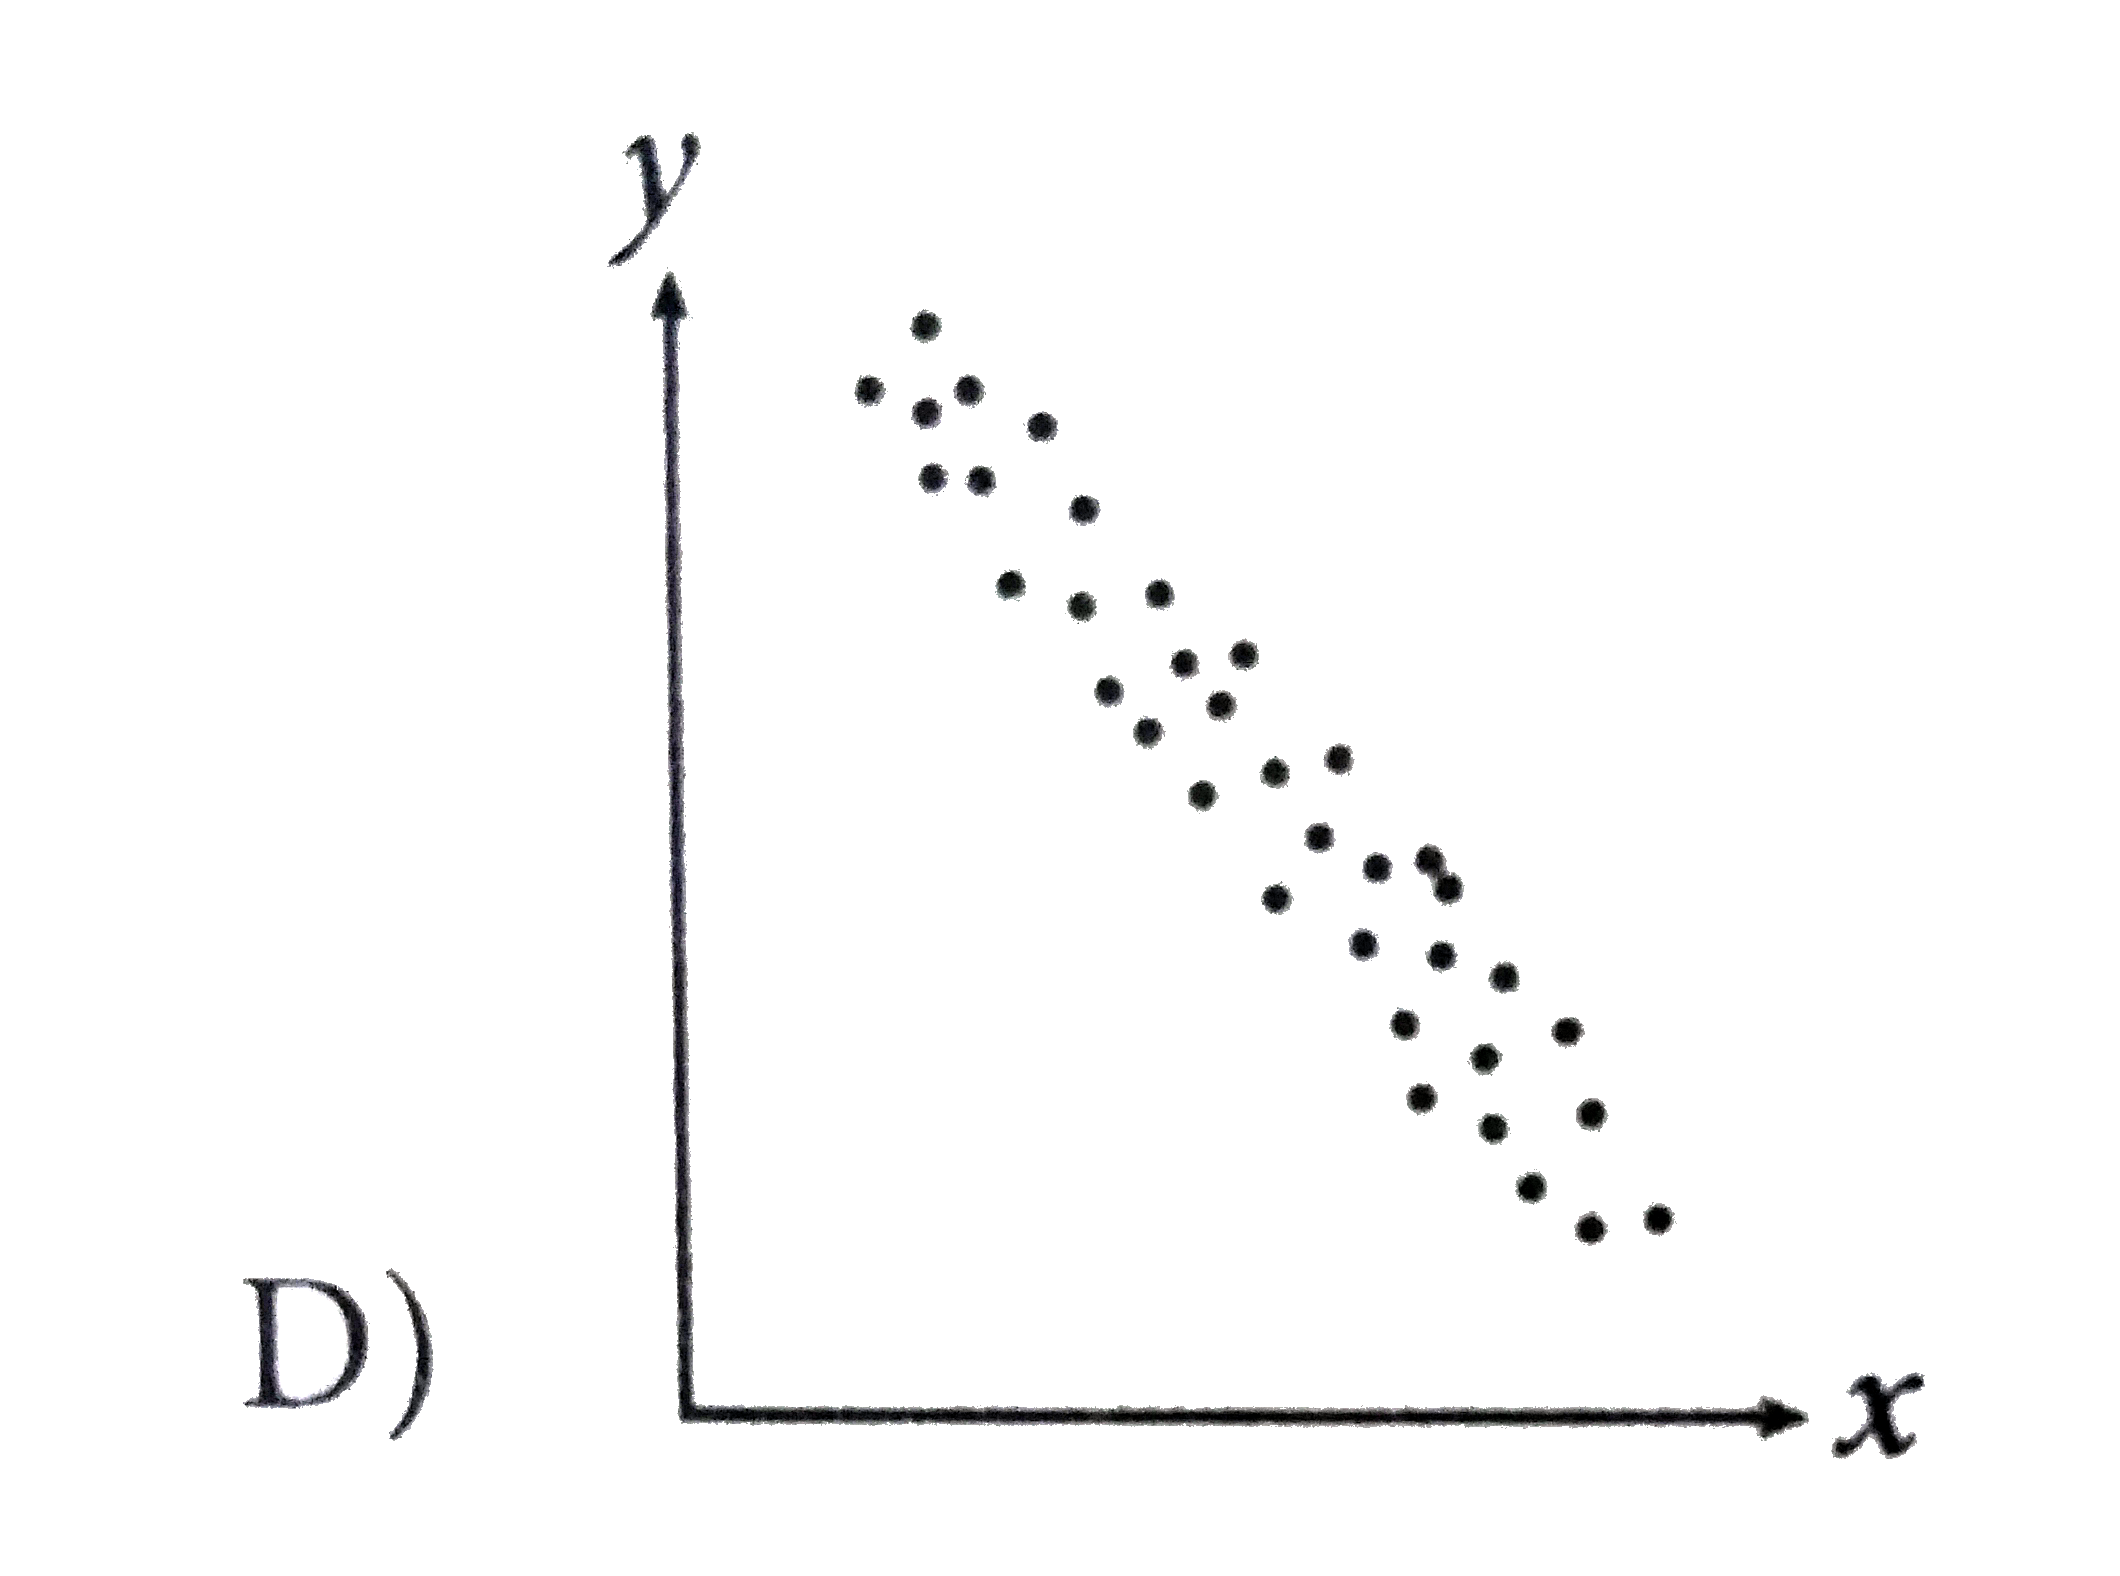
When (2x−3)2 is written in the form ax2+bx+c where a, b and c are integers, a + b + c = ?
A−17B−5C1D−1
If the equation x3−3ax2+3bx−c=0 has positive and distinct roots, then
View SolutionMaximum number of real solution for the equation
axn+x2+bx+c=0,where a,b,c∈R and n is an even positive number, is
View SolutionIf sinθand−cosθ are the roots of the equation ax2−bx−c=0, where a, b, and c are the sides of a triangle ABC, then cosB is equal to
View SolutionIf the equation ax2+bx+c=0,a,b,c,∈ R have non -real
roots, then
View SolutionFor which of the following graphs the quadratic expression y=ax2+bx+c the product abc is negative ?
View Solution


