Consider the following statements.
(a) An oleum sample can be labelled as 127%
(b) Mole fraction is temperature dependent
(c) Slope of log V us log T graph is constant. (At constant P and n for ideal gas).
(d) 1 gm of C6H12O6 contains more number of atoms than 1 gm of CH3COOH.
(e) Intercept of log P vs log (1/T) is always positive. (At constant V and n for ideal gas)
Select the correct code regarding true and false statement.
FFTFF
TFTFF
TFTTF
FFTFT
The correct Answer is:A
Step by step video, text & image solution for Consider the following statements. (a) An oleum sample can be labelled as 127% (b) Mole fraction is temperature dependent (c) Slope of log V us log T graph is constant. (At constant P and n for ideal gas). (d) 1 gm of C_(6)H_(12)O_(6) contains more number of atoms than 1 gm of CH_(3)COOH. (e) Intercept of log P vs log (1//T) is always positive. (At constant V and n for ideal gas) Select the correct code regarding true and false statement. by Chemistry experts to help you in doubts & scoring excellent marks in Class 12 exams.
Updated on:21/07/2023Topper's Solved these Questions
- GRAPHICAL INTERPRETATIONBook:GRB PUBLICATIONChapter:GRAPHICAL INTERPRETATIONExercise:C. Atomic Sturcture
Explore 1 Video
- GRAPHICAL INTERPRETATIONBook:GRB PUBLICATIONChapter:GRAPHICAL INTERPRETATIONExercise:Atomic Sturcture
Explore 9 Videos
- GRAPHICAL INTERPRETATIONBook:GRB PUBLICATIONChapter:GRAPHICAL INTERPRETATIONExercise:B. Gaseous State
Explore 1 Video
- F-BLOCK ELEMENTSBook:GRB PUBLICATIONChapter:F-BLOCK ELEMENTSExercise:Subjective type
Explore 7 Videos
- HYDROCARBON (ALIPHATIC)Book:GRB PUBLICATIONChapter:HYDROCARBON (ALIPHATIC)Exercise:Previous years jee questions
Explore 28 Videos
Similar Questions
Knowledge Check
The plot of log V against log P at constant temperature for a fixed mass of gas is :
A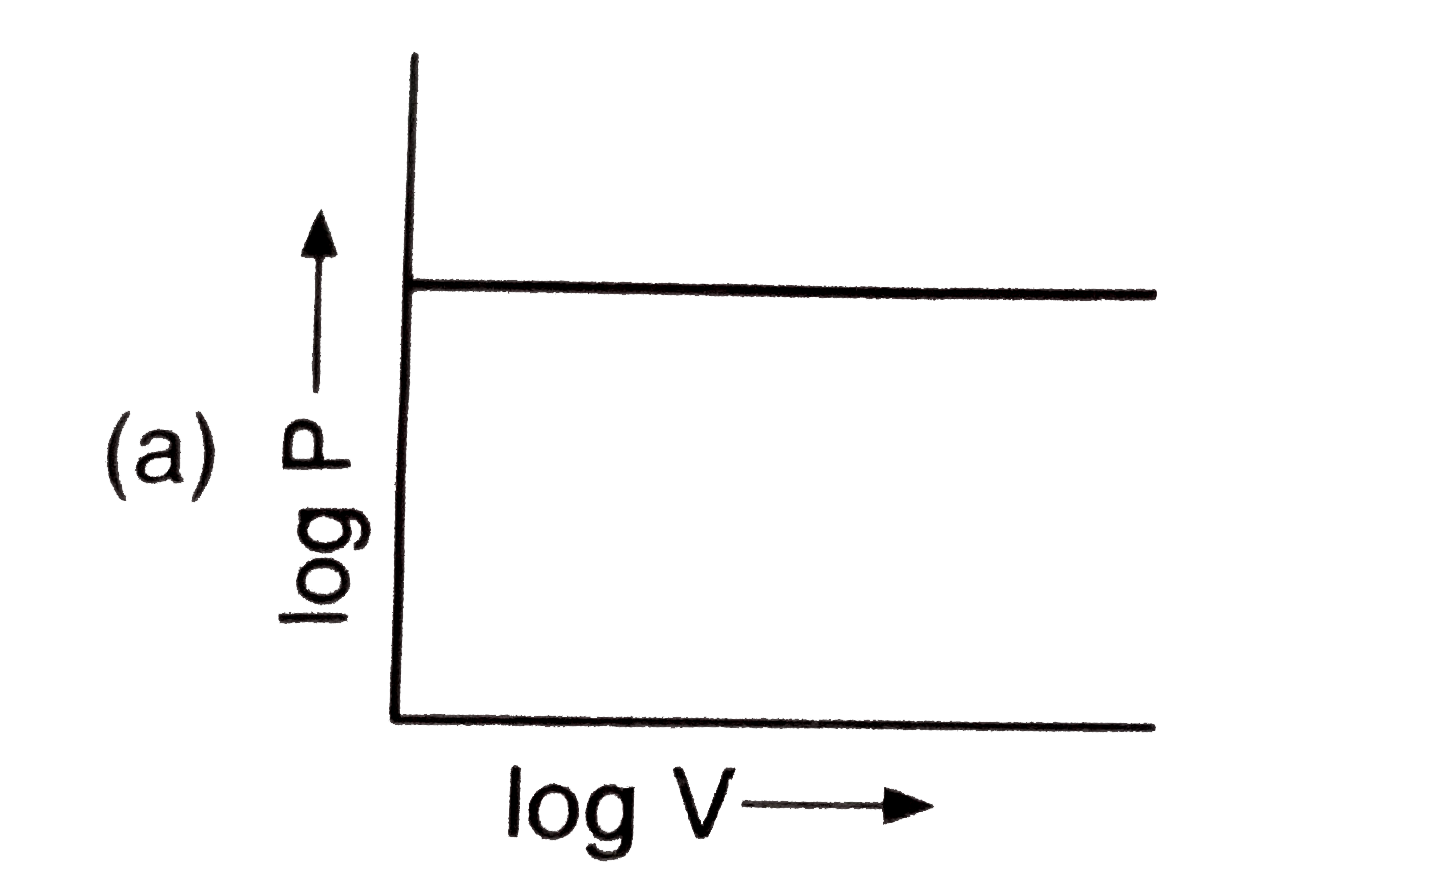 B
B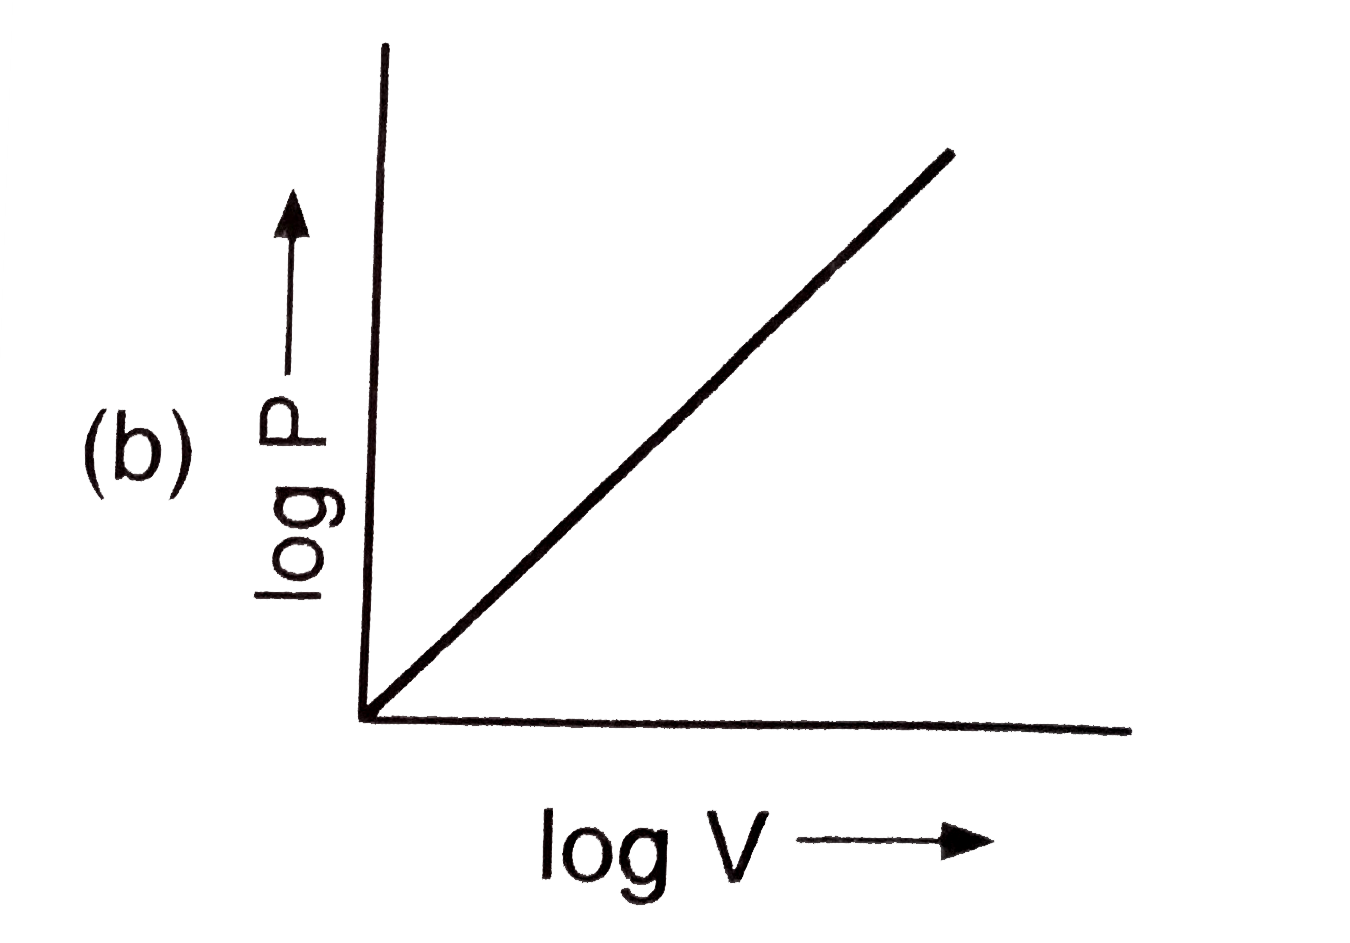 C
C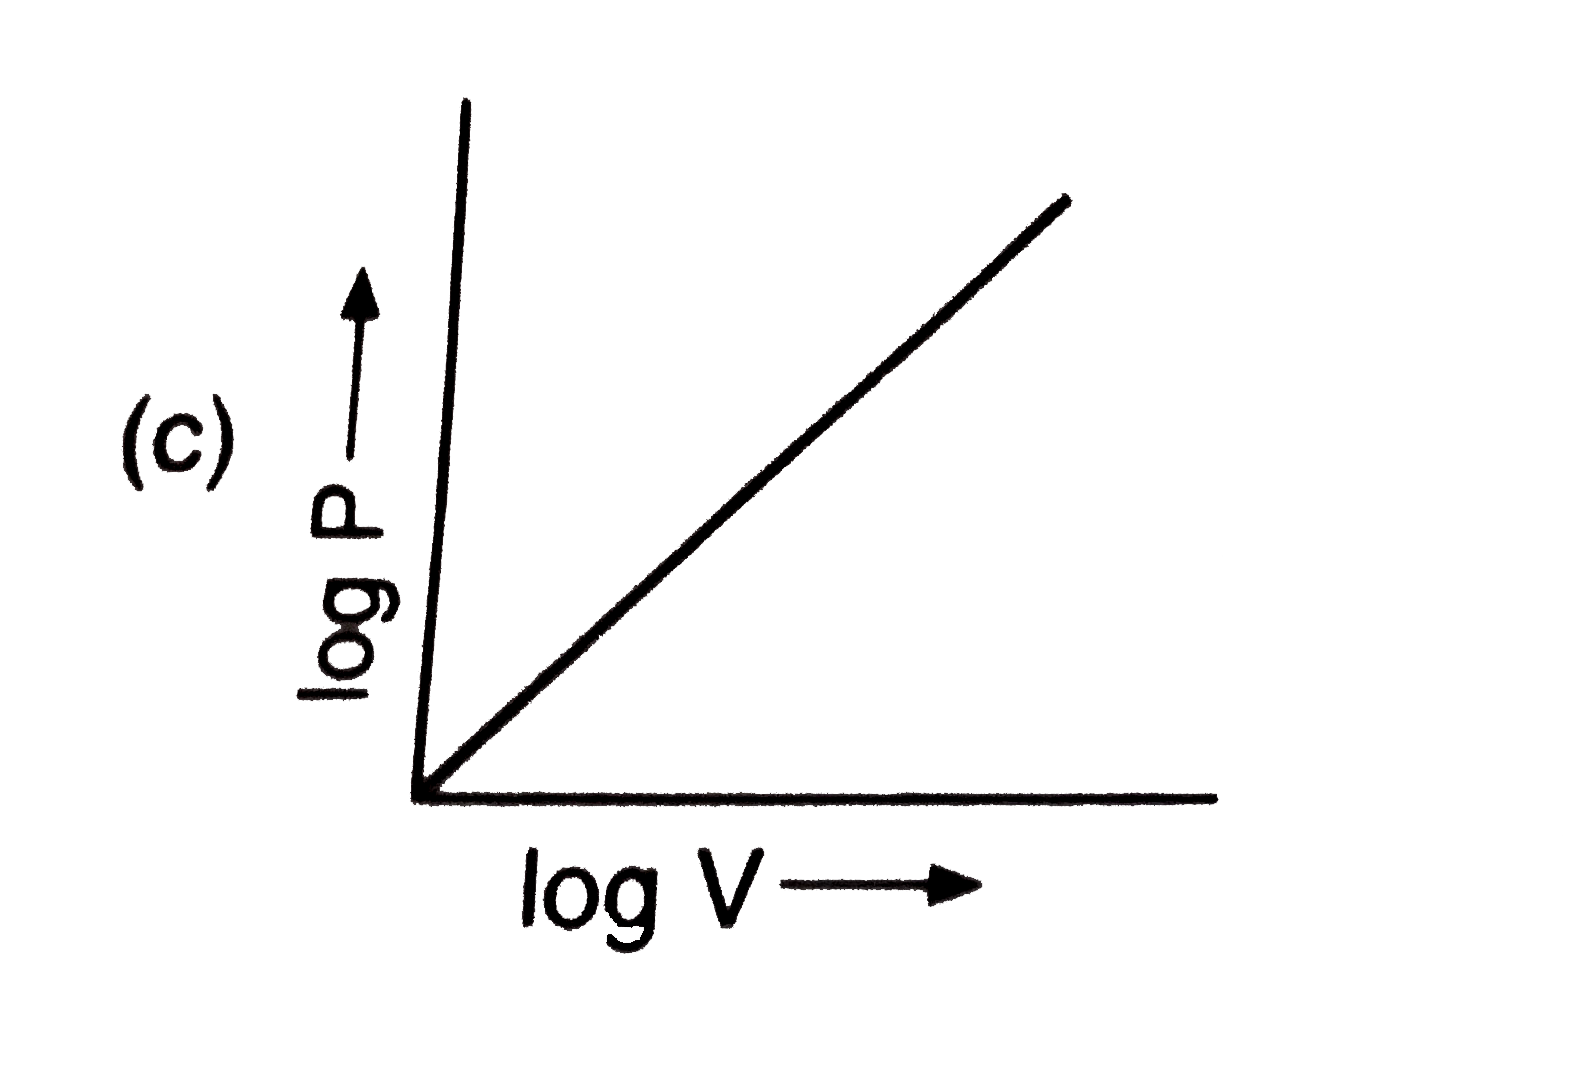 D
D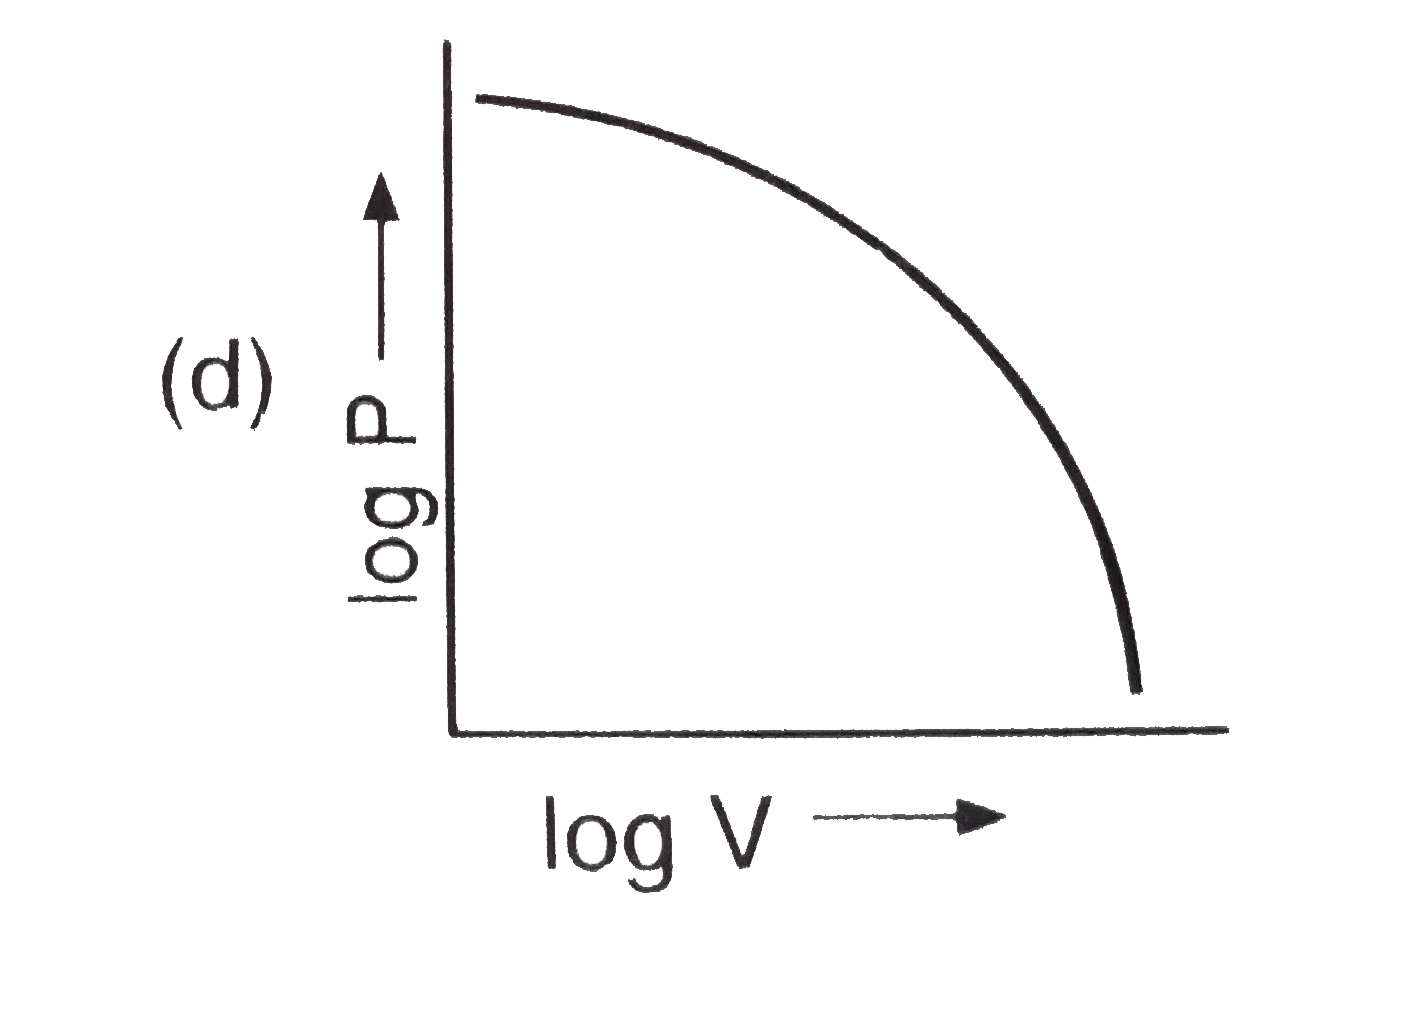
Select the incorrect statements about the plots of ln K vs 1/T
ALinear with slope equal to ΔG∘R and intercept ΔHBCurveCLinear with slope −ΔH∘R and intercept ΔS∘RDnone of theseIf standard heat of dissociation of PCl5 is 230 atm cal than slope of the graph of logk vs1T is :
 A+50B−50C10DNone
Draw a graph of logP and log(1/V) for a fixed amount of gas at constant temperature.
View SolutionThe slope of the graph between log P and log V at constant temperature for a given mass of gas is
View SolutionWhat is the type of graph between log P and log(1V) at constant temperature for a given amount of gas ?
View SolutionLog P vs log V curve is plotted for an ideal gas, which is true for the gas ?

View SolutionFor same mass of two different ideal gases of molecular weights M1andM2 plots of log V vs log P at a given constant temperature are shown. Identify the correct option.
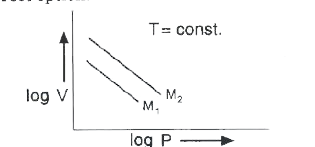
View Solution

