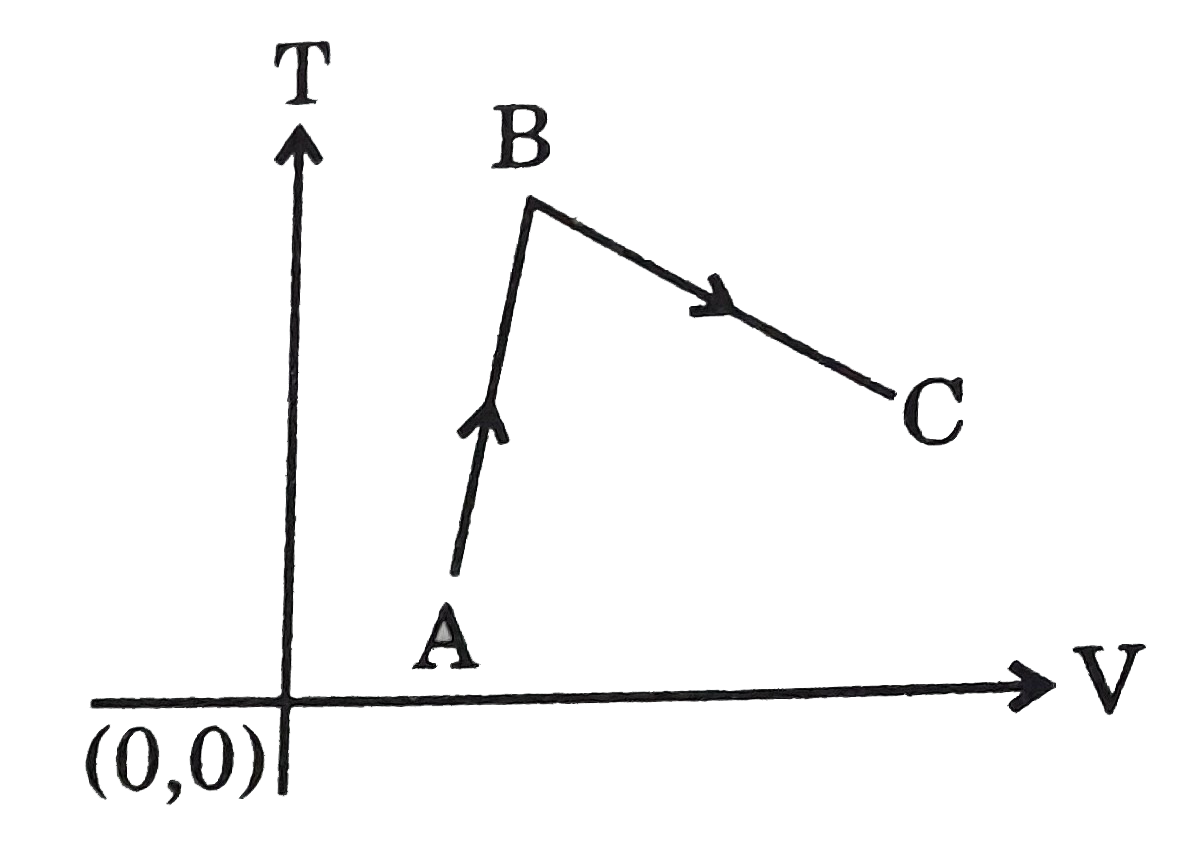
In the given isobaric process shown by graph between T and V.

Moles decreases throughout
Moles first increases then deceases
Moles first decreases then increases
Moles cannot be predicted form given data
The correct Answer is:C
Step by step video, text & image solution for In the given isobaric process shown by graph between T and V. by Chemistry experts to help you in doubts & scoring excellent marks in Class 12 exams.
Updated on:21/07/2023Topper's Solved these Questions
- GRAPHICAL INTERPRETATIONBOOK - GRB PUBLICATIONCHAPTER - GRAPHICAL INTERPRETATIONEXERCISE - C. Atomic Sturcture
1 Videos
- GRAPHICAL INTERPRETATIONBOOK - GRB PUBLICATIONCHAPTER - GRAPHICAL INTERPRETATIONEXERCISE - Atomic Sturcture
9 Videos
- GRAPHICAL INTERPRETATIONBOOK - GRB PUBLICATIONCHAPTER - GRAPHICAL INTERPRETATIONEXERCISE - B. Gaseous State
1 Videos
- F-BLOCK ELEMENTSBOOK - GRB PUBLICATIONCHAPTER - F-BLOCK ELEMENTSEXERCISE - Subjective type
7 Videos
- HYDROCARBON (ALIPHATIC)BOOK - GRB PUBLICATIONCHAPTER - HYDROCARBON (ALIPHATIC)EXERCISE - Previous years jee questions
28 Videos
Similar Questions
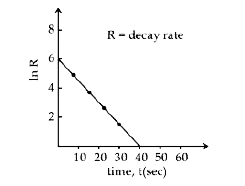
For a certain radioactive process the graph between In R and t(sec) is obtained as shown in the figure. The the value of half life for the unknown radioactive material is approximately:

View SolutionIn the above problem if given graph is between VAB and time. Then plot graph between VED and time.
View Solution
Knowledge Check
In isobaric process
Asize of the bar remains sameBsize of barometer remains sameCpressure of the system remains sameDvolume remains sameIn an isobaric process, __________ .
Asize of the bar remains sameBsize of barometer remains sameCpressure of the system remains sameDvolume remains sameIn an isobaric process
APressure increasesBPressure decreasesCPressure neither increases or decreases (P fixed),DNone of these.
In an isobaric process, __________ .
View SolutionFor an ideal gas, under isobaric condition, a graph between log V vs log T :
View SolutionIf for a given substance, melting point is TB and freezing point is TA then correct variation of entropy is by graph between entropy change and temperature is
View SolutionAssertion Straight line on V-T graph represents isobaric process.
Reason If V ∝ T, then p= constant i.e., orocess is isobaric.
View SolutionFor an adiabatic process the relation between V and T is given by
View Solution
