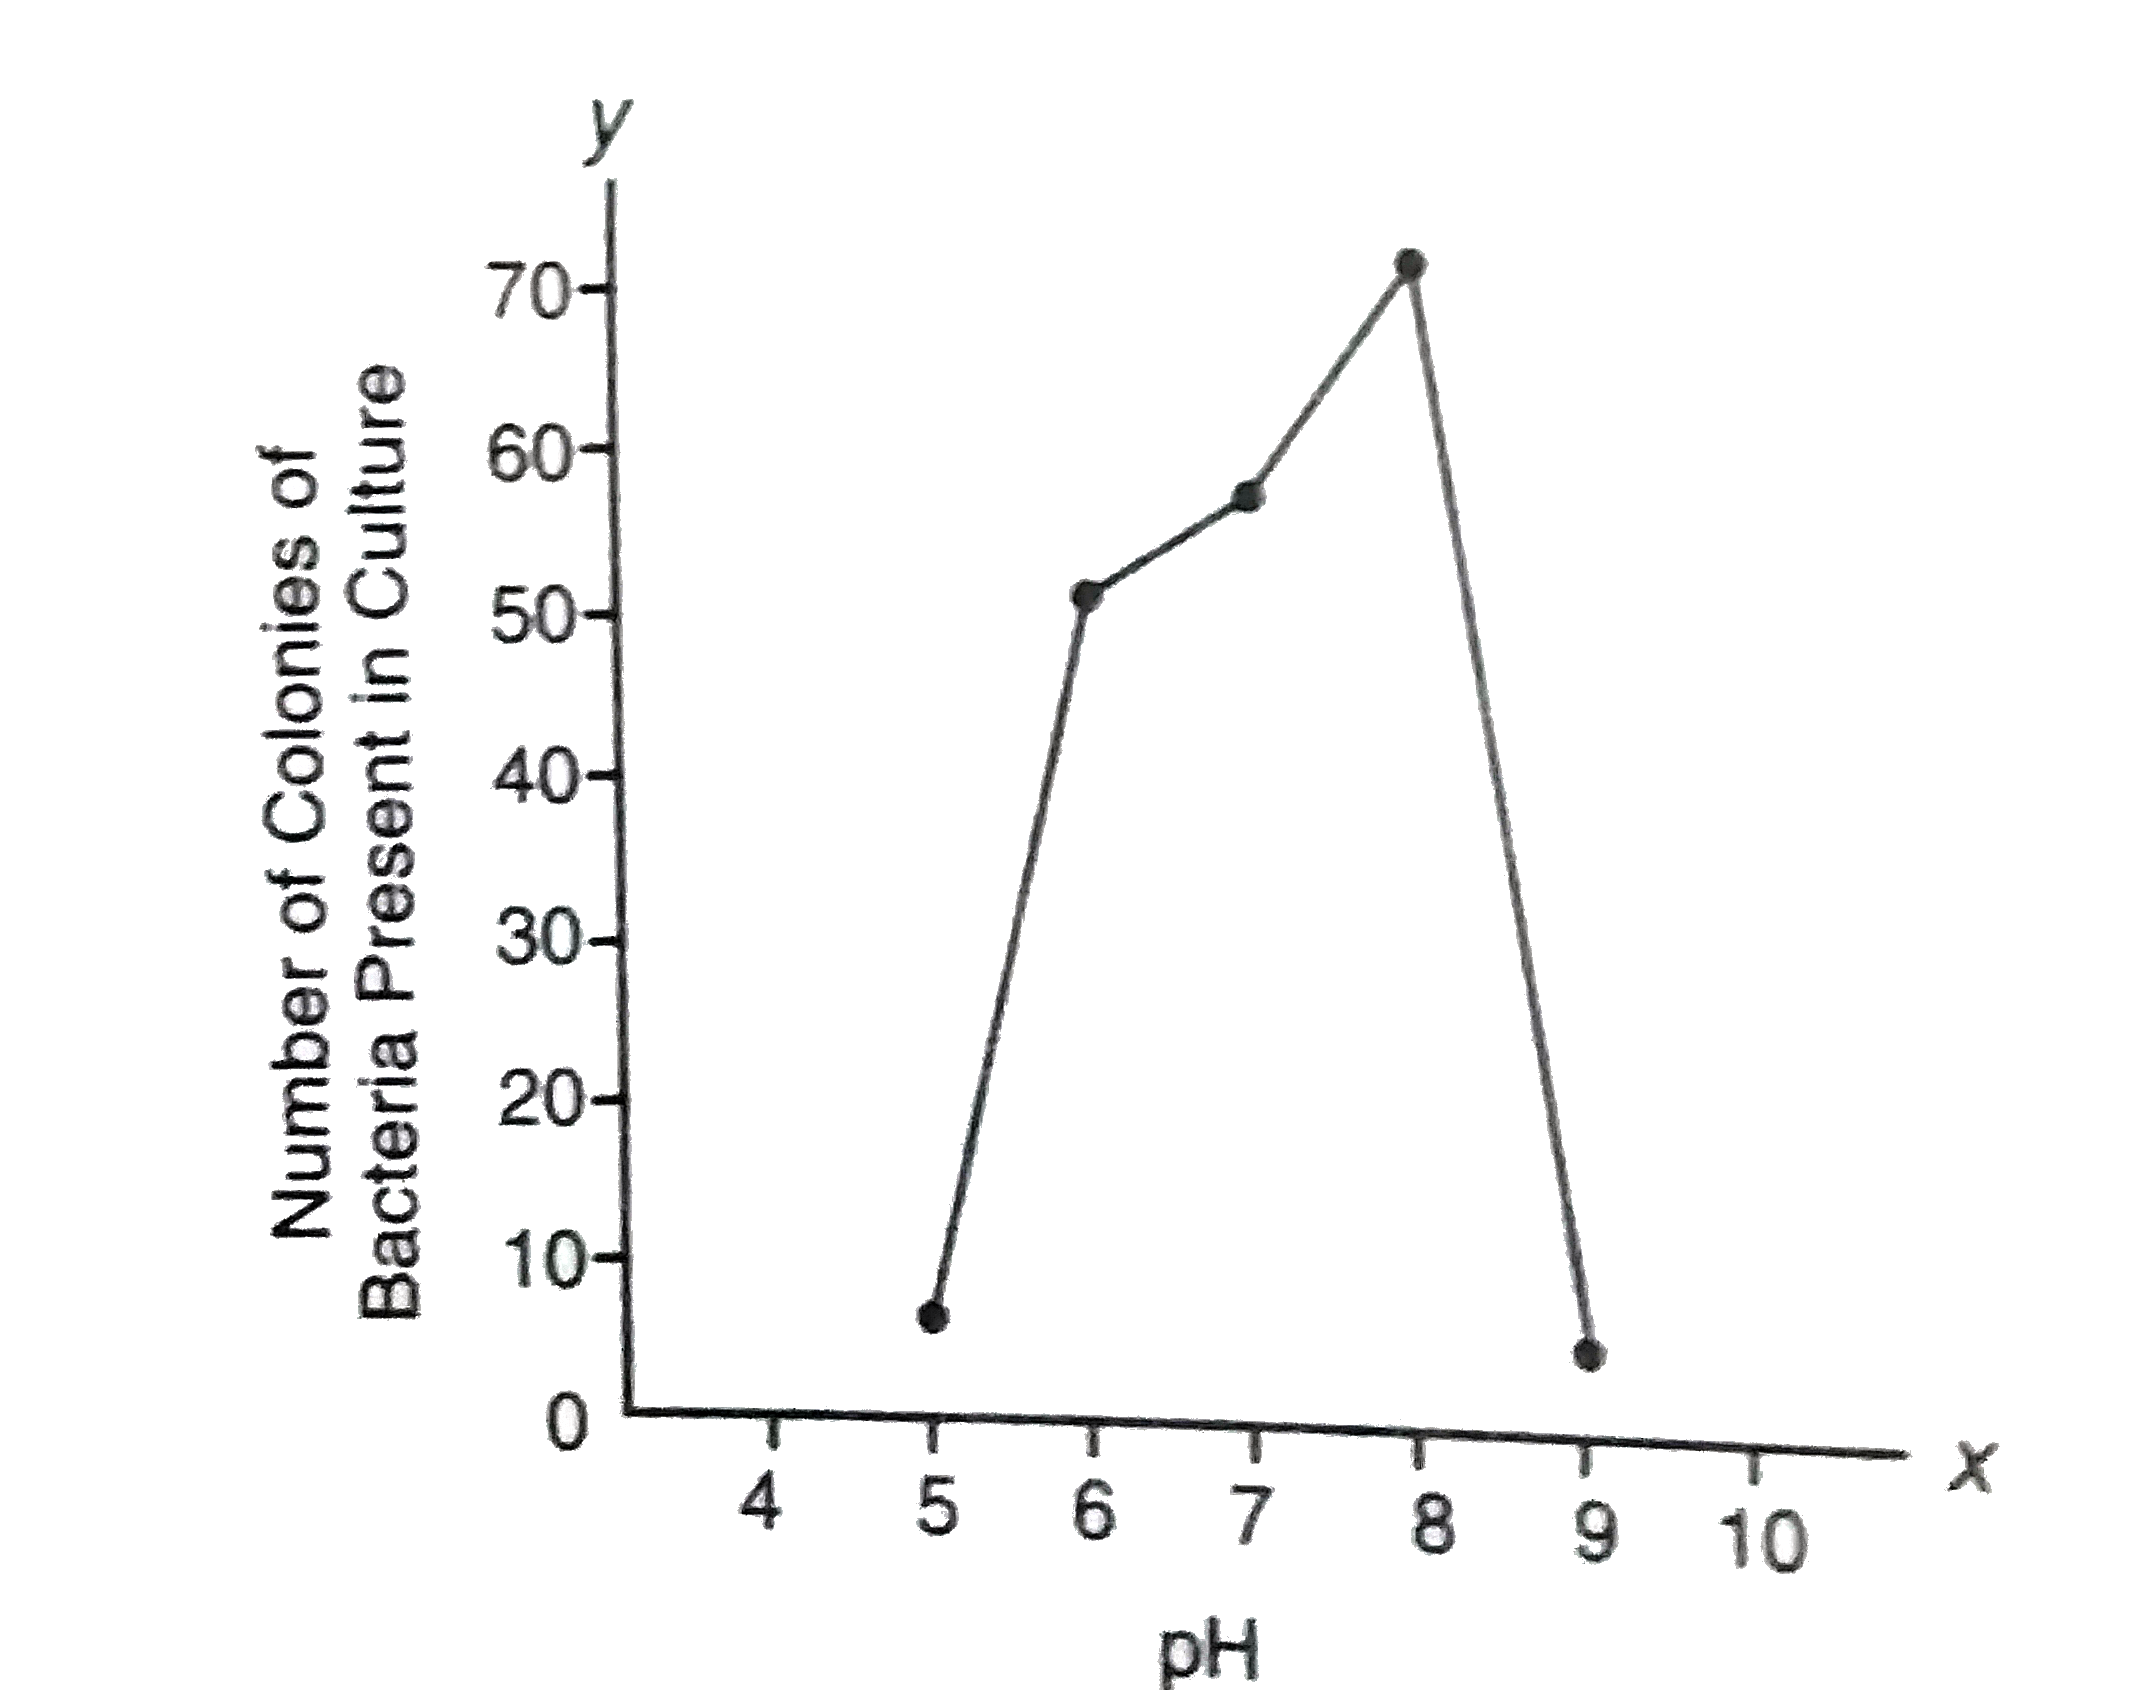
The accompanying graph illustrates the presence of a certain strain of bacteria at various pH levels. Between which two pH values is the rate at which the number of colonies of bacteria increasing at the lowest rate?
5 to 6
6 to 7
7 to 8
8 to 9
The correct Answer is:B
Step by step video, text & image solution for The accompanying graph illustrates the presence of a certain strain of bacteria at various pH levels. Between which two pH values is the rate at which the number of colonies of bacteria increasing at the lowest rate? by Maths experts to help you in doubts & scoring excellent marks in Class 12 exams.
Updated on:21/07/2023Topper's Solved these Questions
- PROBLEM SOLVING AND DATA ANALYSISBook:ENGLISH SATChapter:PROBLEM SOLVING AND DATA ANALYSISExercise:Grib-In
Explore 40 Videos
- PROBLEM SOLVING AND DATA ANALYSISBook:ENGLISH SATChapter:PROBLEM SOLVING AND DATA ANALYSISExercise:Grib-In
Explore 40 Videos
- PROBLEM SOLVING AND DATA ANALYSISBook:ENGLISH SATChapter:PROBLEM SOLVING AND DATA ANALYSISExercise:EXERICSE
Explore 80 Videos
- PROBLEMS IN CONTEXT Book:ENGLISH SATChapter:PROBLEMS IN CONTEXT Exercise:PRACTICE TEST
Explore 10 Videos
Similar Questions
Knowledge Check
Two different coils have self-inductances L1=8mHandL2=2mH. The current in one coil is increased at a constant rate. The current in the second coil is also increased at the same constant rate. At a certain instant of time, the power given to the two coil is the same. At that time, the current, the induced voltage and the energy stored in the first coil are i1,V1andW1 respectively. Corresponding values for the second coil at the same instant are i2,V2andW2 respectively. Then:
AW2W1=8BW2W1=18CW2W1=4DW2W1=14Which of the following solutions having same concentration will have lowest pH value?
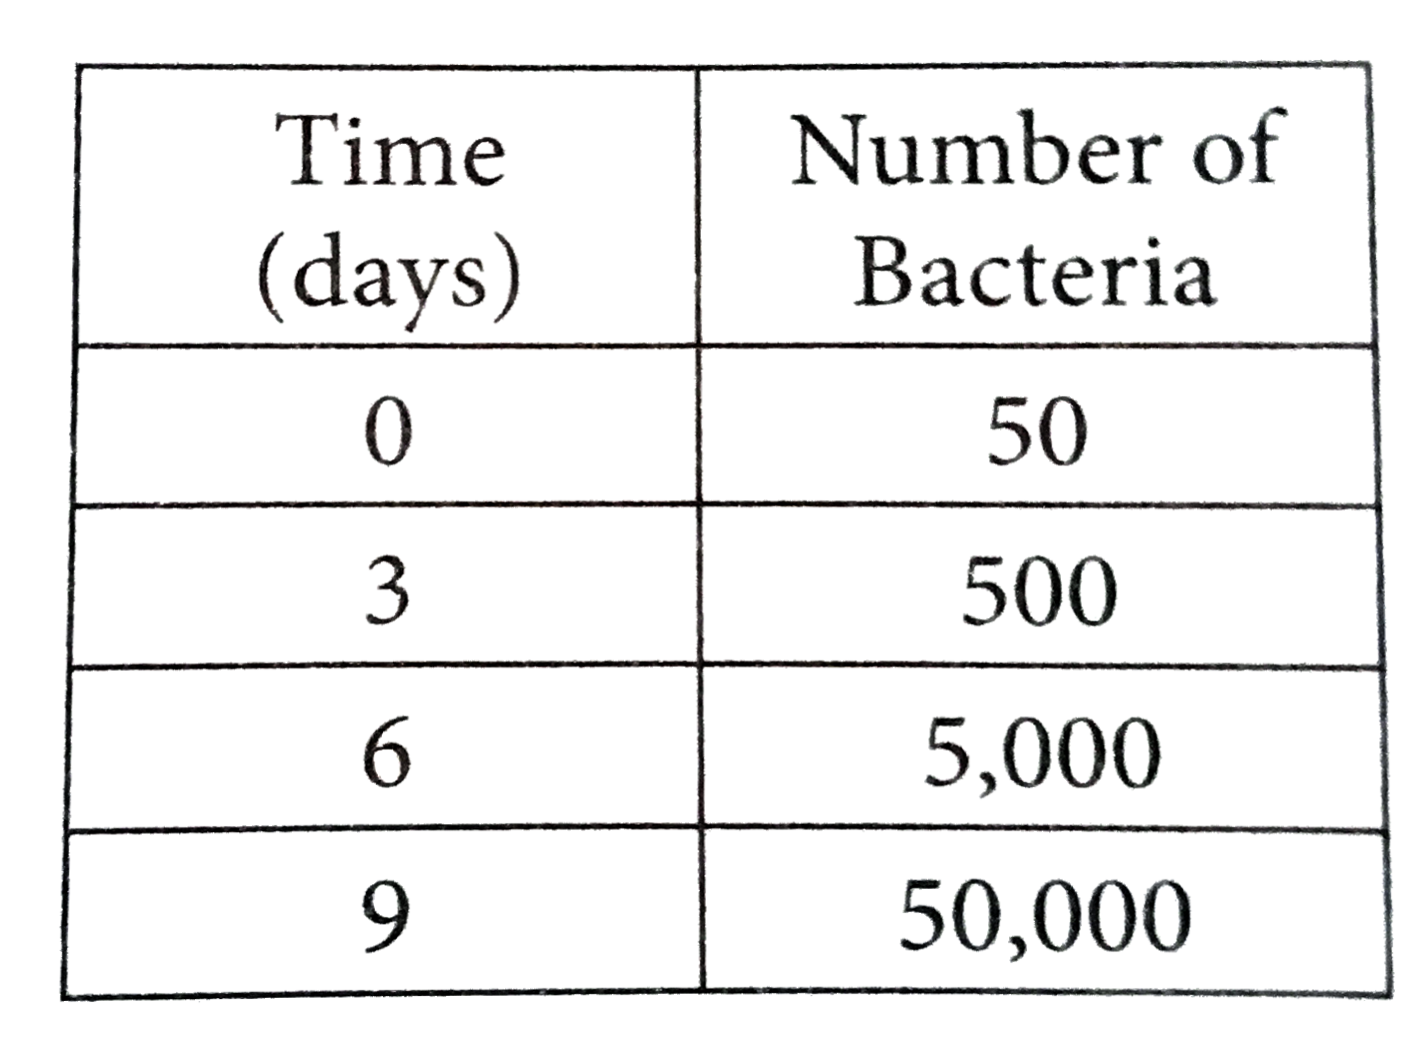
AKClBMgCl2CAlCl3DNa3PO4The number of bactria in a colony is estimated over the course of 9 days, as shown in the table below.

Which of the following best describes the relationship between time and the estimated number of bacteria over these 9 days?ALinear decreaseBLinear increaseCExponential decayDExponential growth
Which solution will have the lowest pH value ?
View SolutionTwo different coils have self inductances L1=9mH and L2=2mH. The current in one coil is increased at a constant rate. The current in the second coil is also increased at the same constant rate. At a certain instant of time, the power given to the two coils is the same. At that time, the current the induced voltage and the energy stored in the first coil are i1,V1 and W1 respectively.
Corresponding values for the second coil at the same instant are i2,V−2 and W2 respectively. Then,
View SolutionThe rate of increase in the number of bacteria in a certain bacteria culture is proportional to the number present. Given the number triples in 5 hrs., find how many bacteria will be present after 10 hours. Also find the time necessary for the number of bacteria to be 10 times the number of initial present. [Given loge3=1.0986, e2.1972=9 ]
View SolutionThe rate of increase of the bacteria in a culture is proportional to the number of bacteria present and it is found that the number doubles in 6 hours. Prove that the bacteria becomes 8 times at the end of 18 hours.
View SolutionIn acidic medium the rate of reaction between [BrO−3] and [Br−] ions given by the expression
−d[BrO−3]dt=k[BrO−3][Br−][H+]2
It means
(i) rate of constant of the reaction depends upon the concentration of H+ ions
(ii) rate of reaction is independent of the concentration of acid added
(iii) the change in pH of the solution will affect the rate of reaction
(iv) doubling the concentration of H+ ions will increase the reactions rate by 4 items.
View Solution


