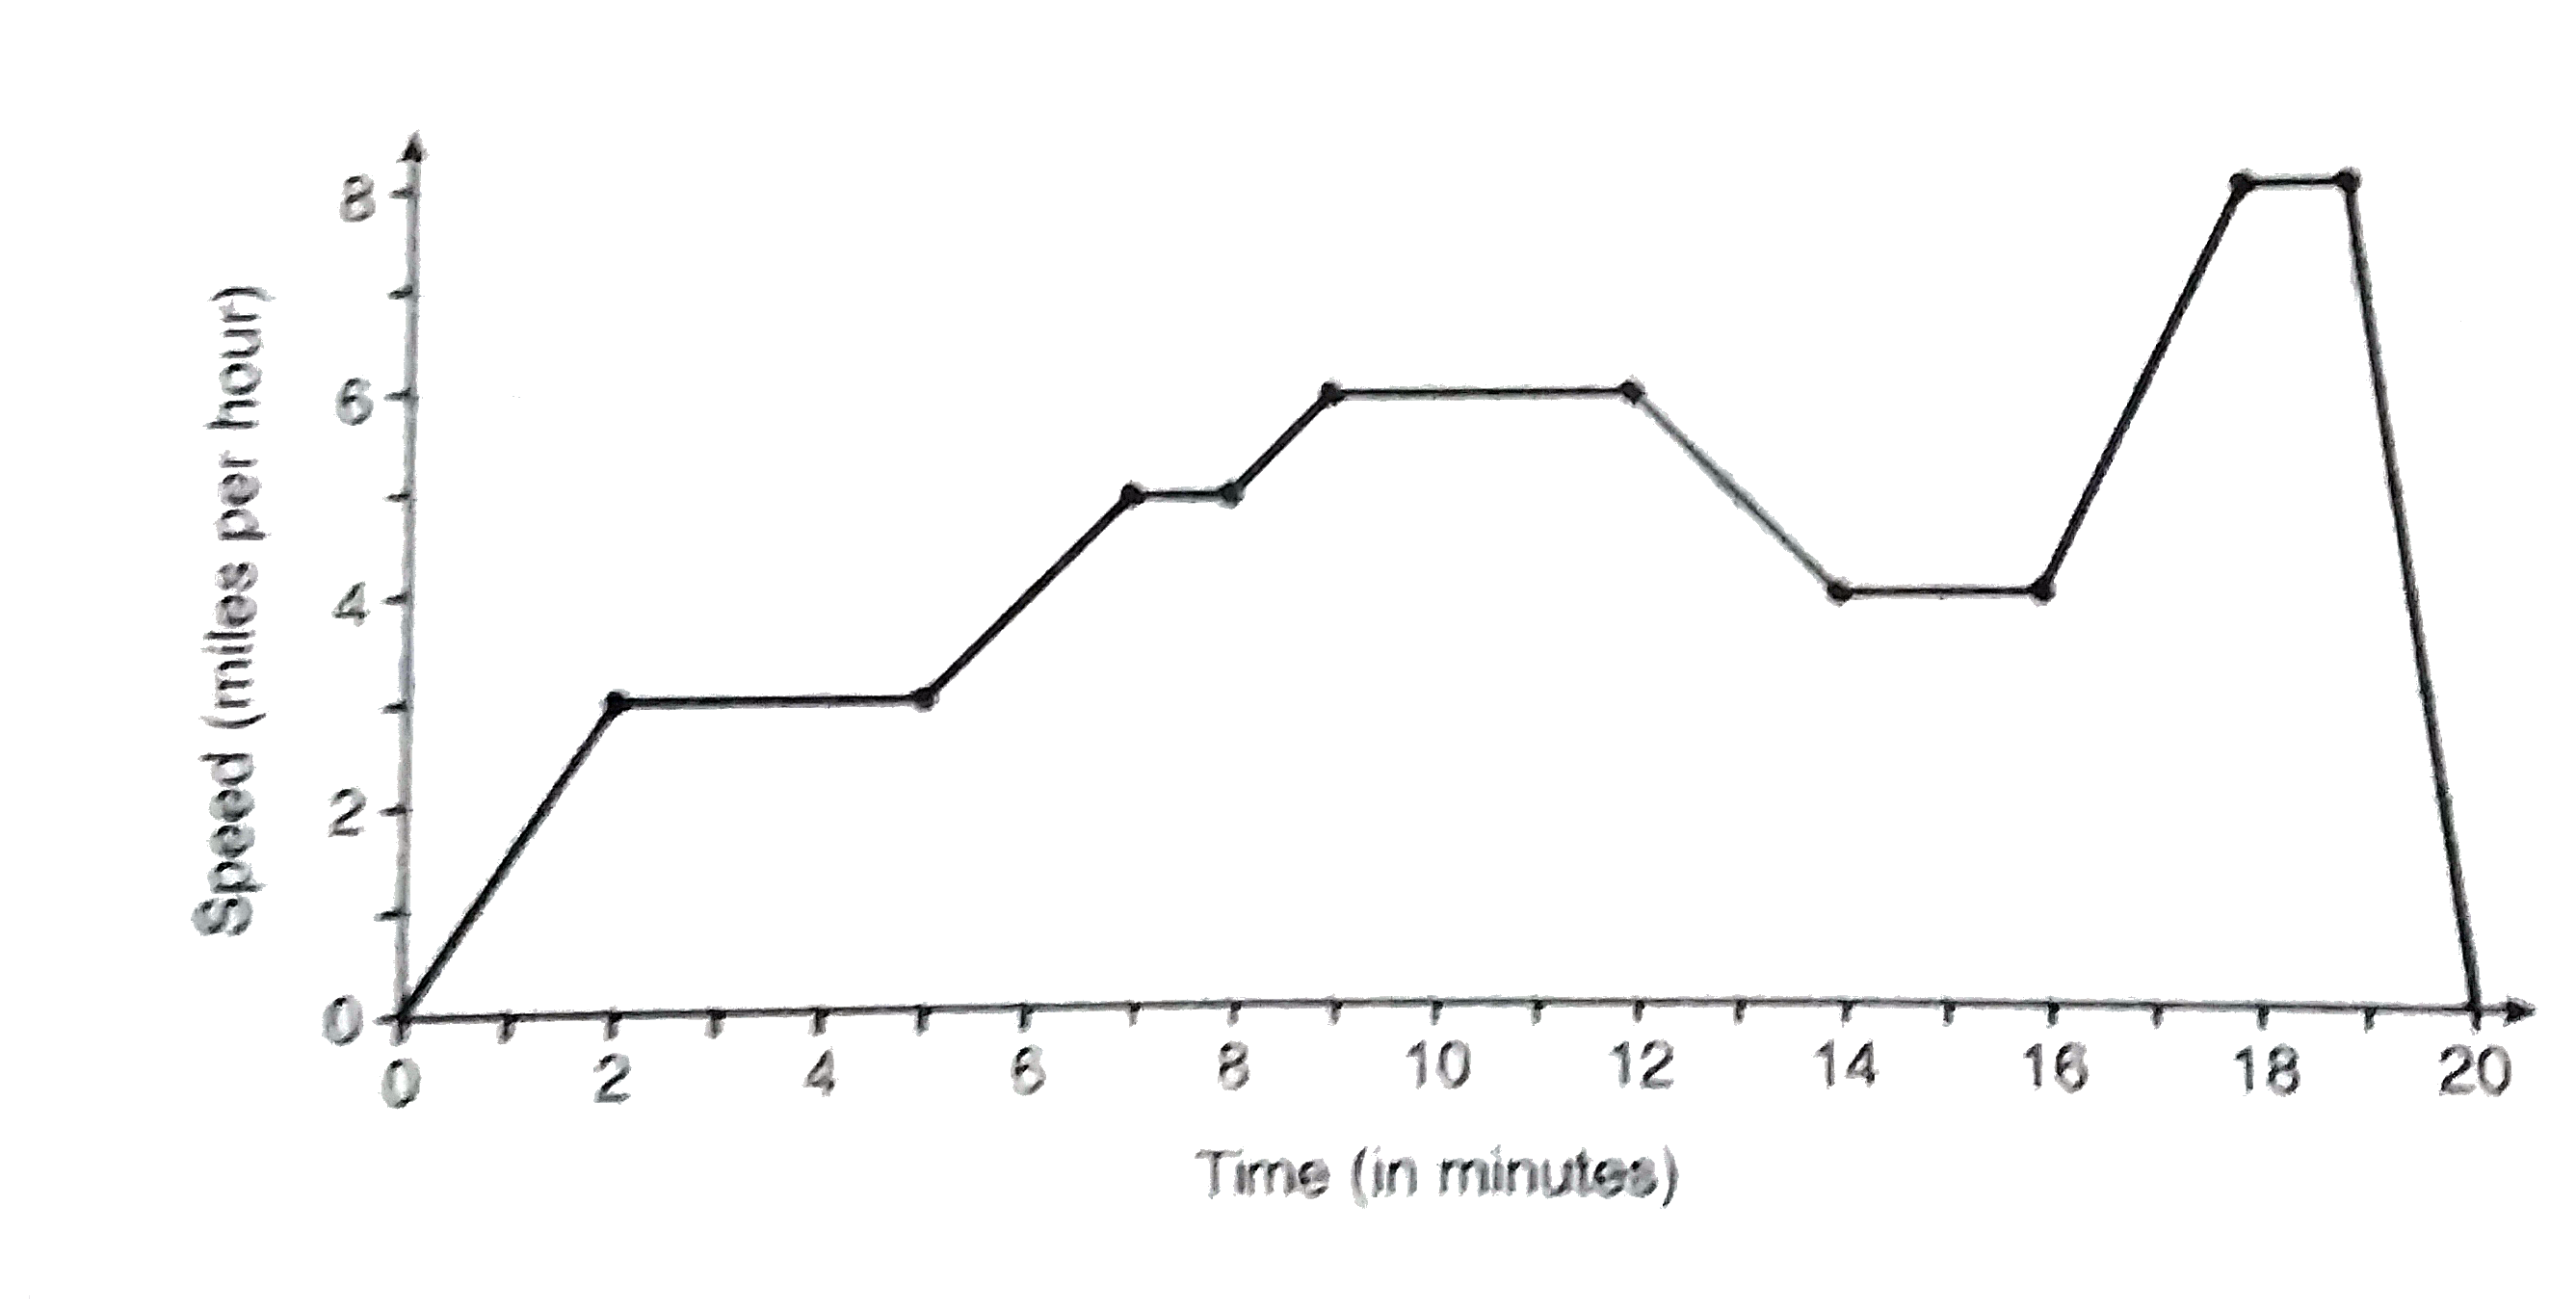
The graph above represents a jogger's speed during her 20-minutes jog around her neighbourhood. Which statement best describes what the jogger was doing during the 9-12 minutes interval of her jog?
She was standing still
She was increasing her speed
She was decreasing her speed
She was jogging at a constant rate.
The correct Answer is:D
Step by step video, text & image solution for The graph above represents a jogger's speed during her 20-minutes jog around her neighbourhood. Which statement best describes what the jogger was doing during the 9-12 minutes interval of her jog? by Maths experts to help you in doubts & scoring excellent marks in Class 12 exams.
Updated on:21/07/2023Topper's Solved these Questions
- PROBLEM SOLVING AND DATA ANALYSISBook:ENGLISH SATChapter:PROBLEM SOLVING AND DATA ANALYSISExercise:Grib-In
Explore 40 Videos
- PROBLEM SOLVING AND DATA ANALYSISBook:ENGLISH SATChapter:PROBLEM SOLVING AND DATA ANALYSISExercise:Grib-In
Explore 40 Videos
- PROBLEM SOLVING AND DATA ANALYSISBook:ENGLISH SATChapter:PROBLEM SOLVING AND DATA ANALYSISExercise:EXERICSE
Explore 80 Videos
- PROBLEMS IN CONTEXT Book:ENGLISH SATChapter:PROBLEMS IN CONTEXT Exercise:PRACTICE TEST
Explore 10 Videos
Similar Questions
Shalu cycles to her school at an average speed of 12 km/hr. It takes her 20 minutes to reach the school. If she wants to reach her school in 15 minutes, what should be her average speed?
View SolutionWhen amy exercise in her fitness certer for 1 hour she burns a total of 475 calories. If she burns 9 calories a minute jogging on the treadmilll and then burns 6.5 calories a minute pedalling on the stationary bicycle, how many minutes of the hour does she spend exercising on the bicycle?
View Solution
Knowledge Check
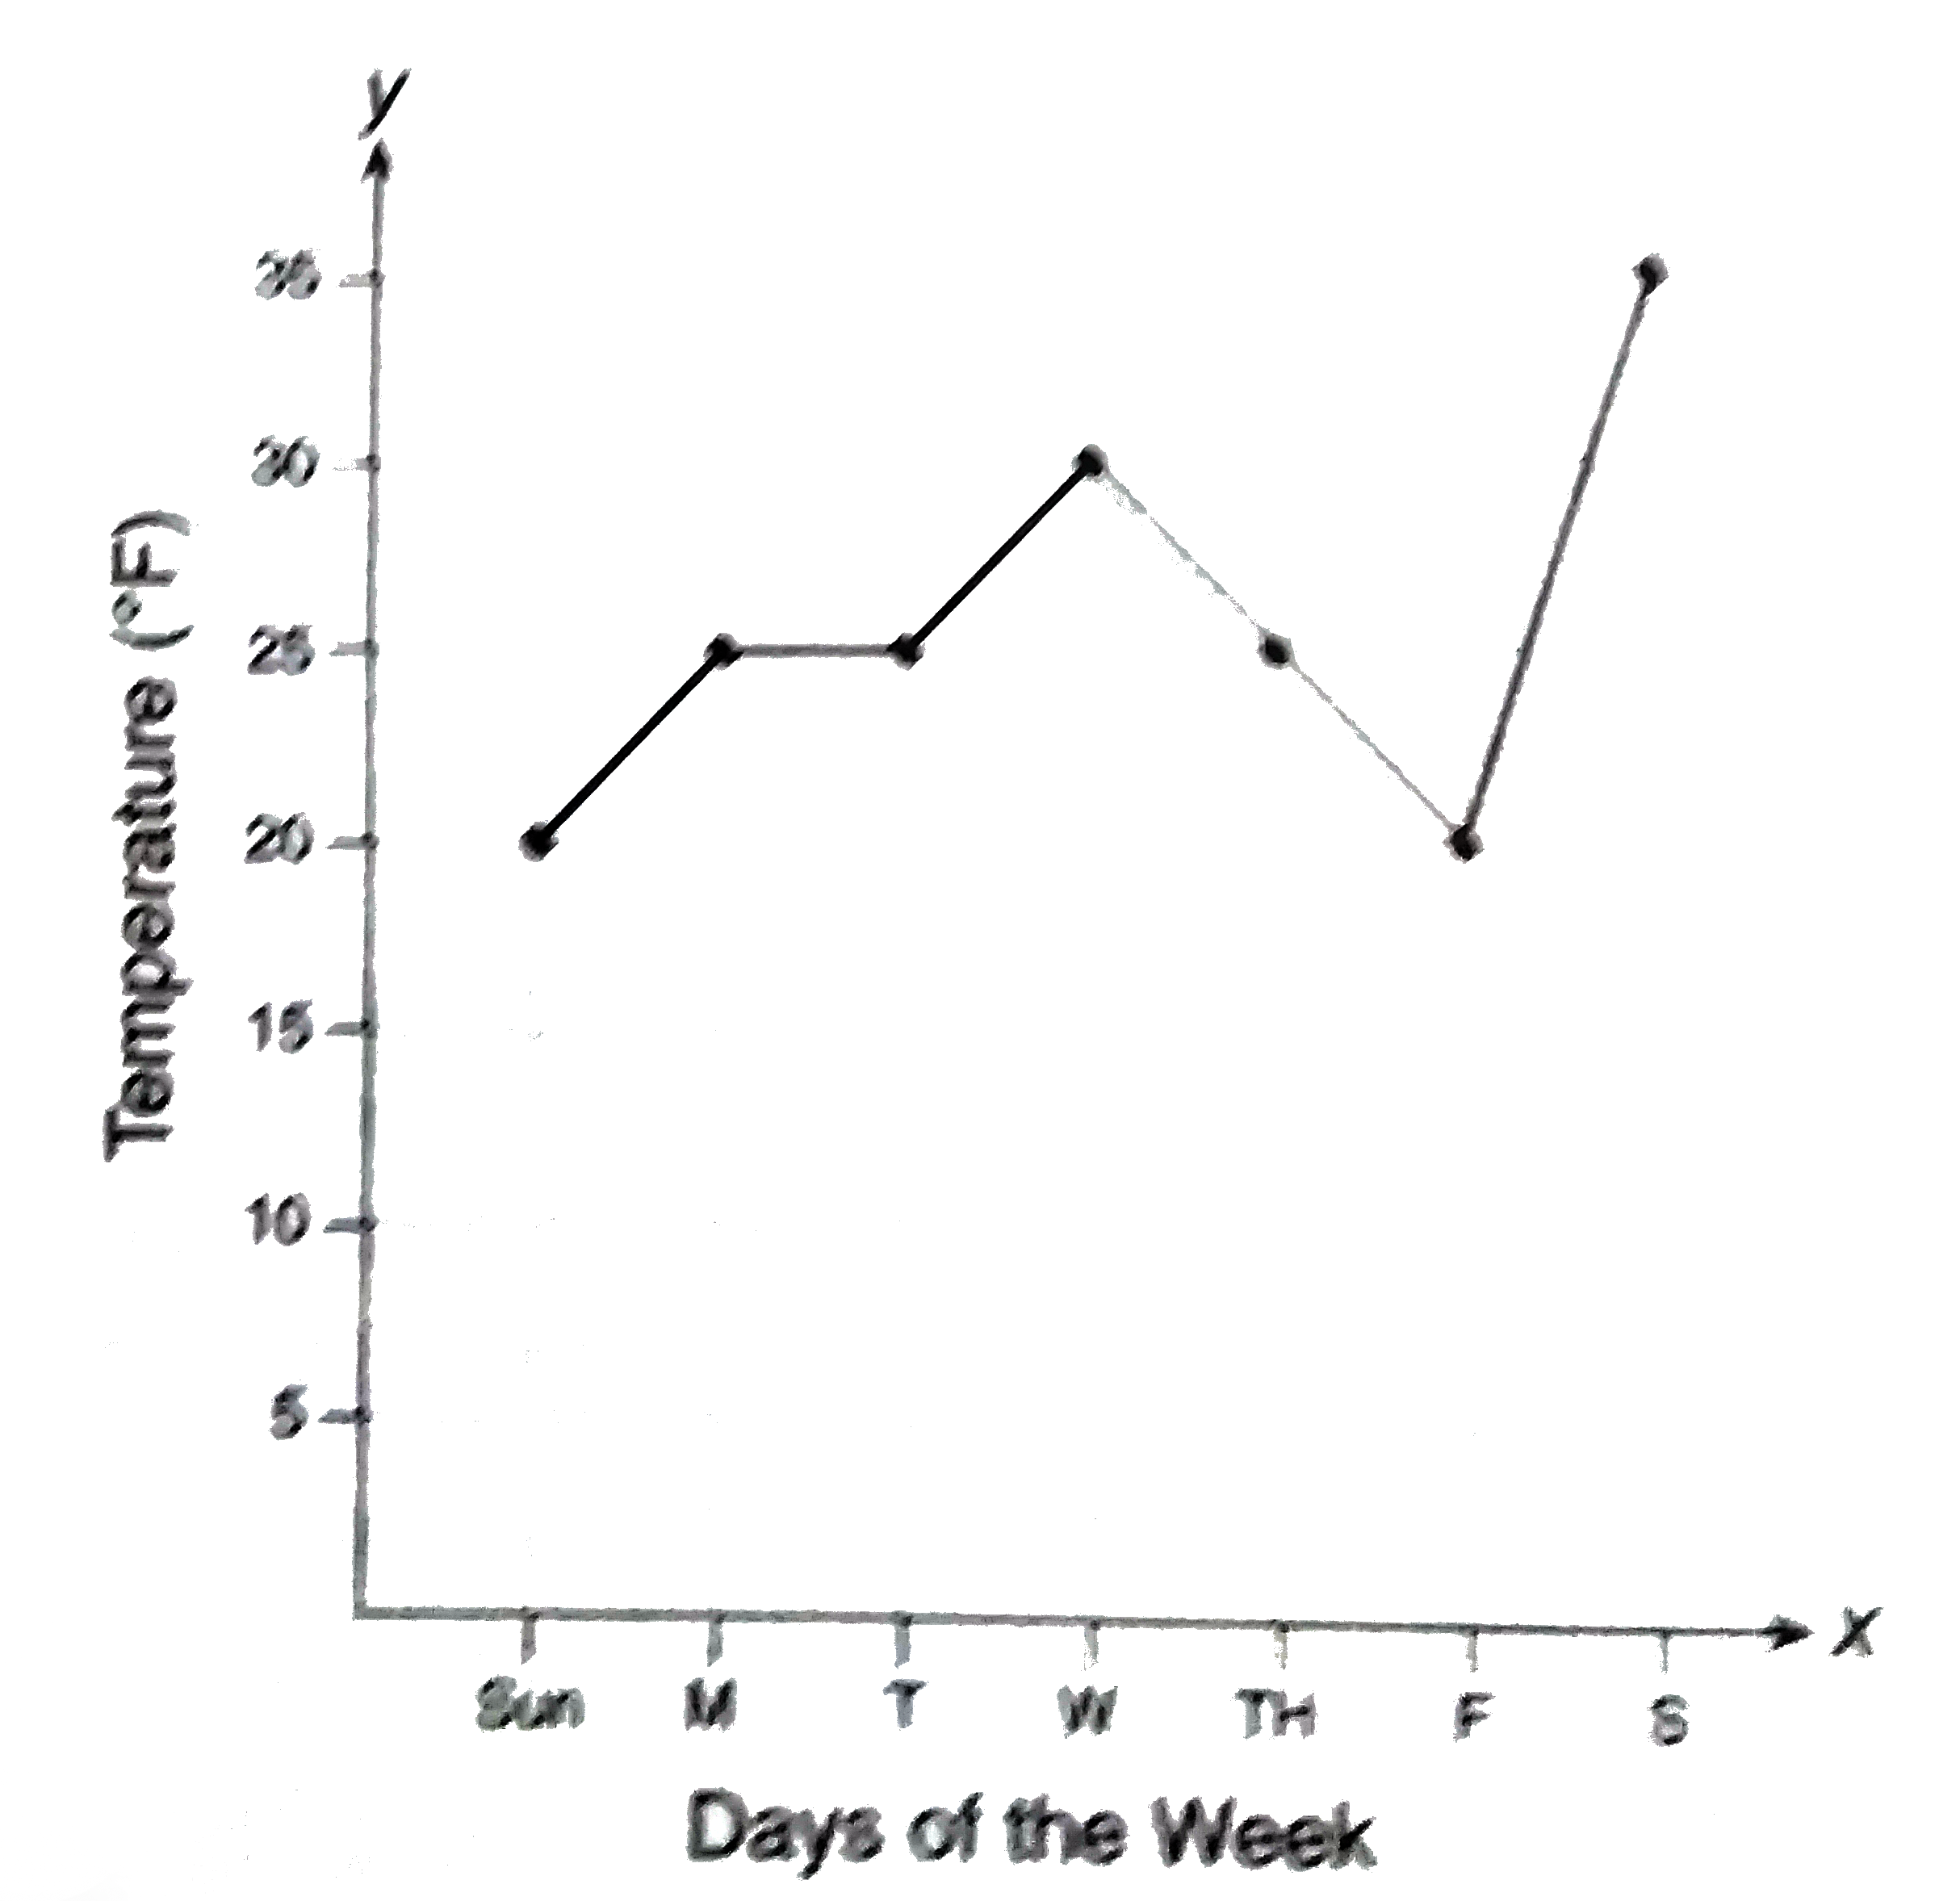
The graph above shows the average daily temperature during a particular week in January in certain city. Which statement best describes the temperature date in the graph above?AMedian=meanBmeas< modeCmedian =modeDmean=mode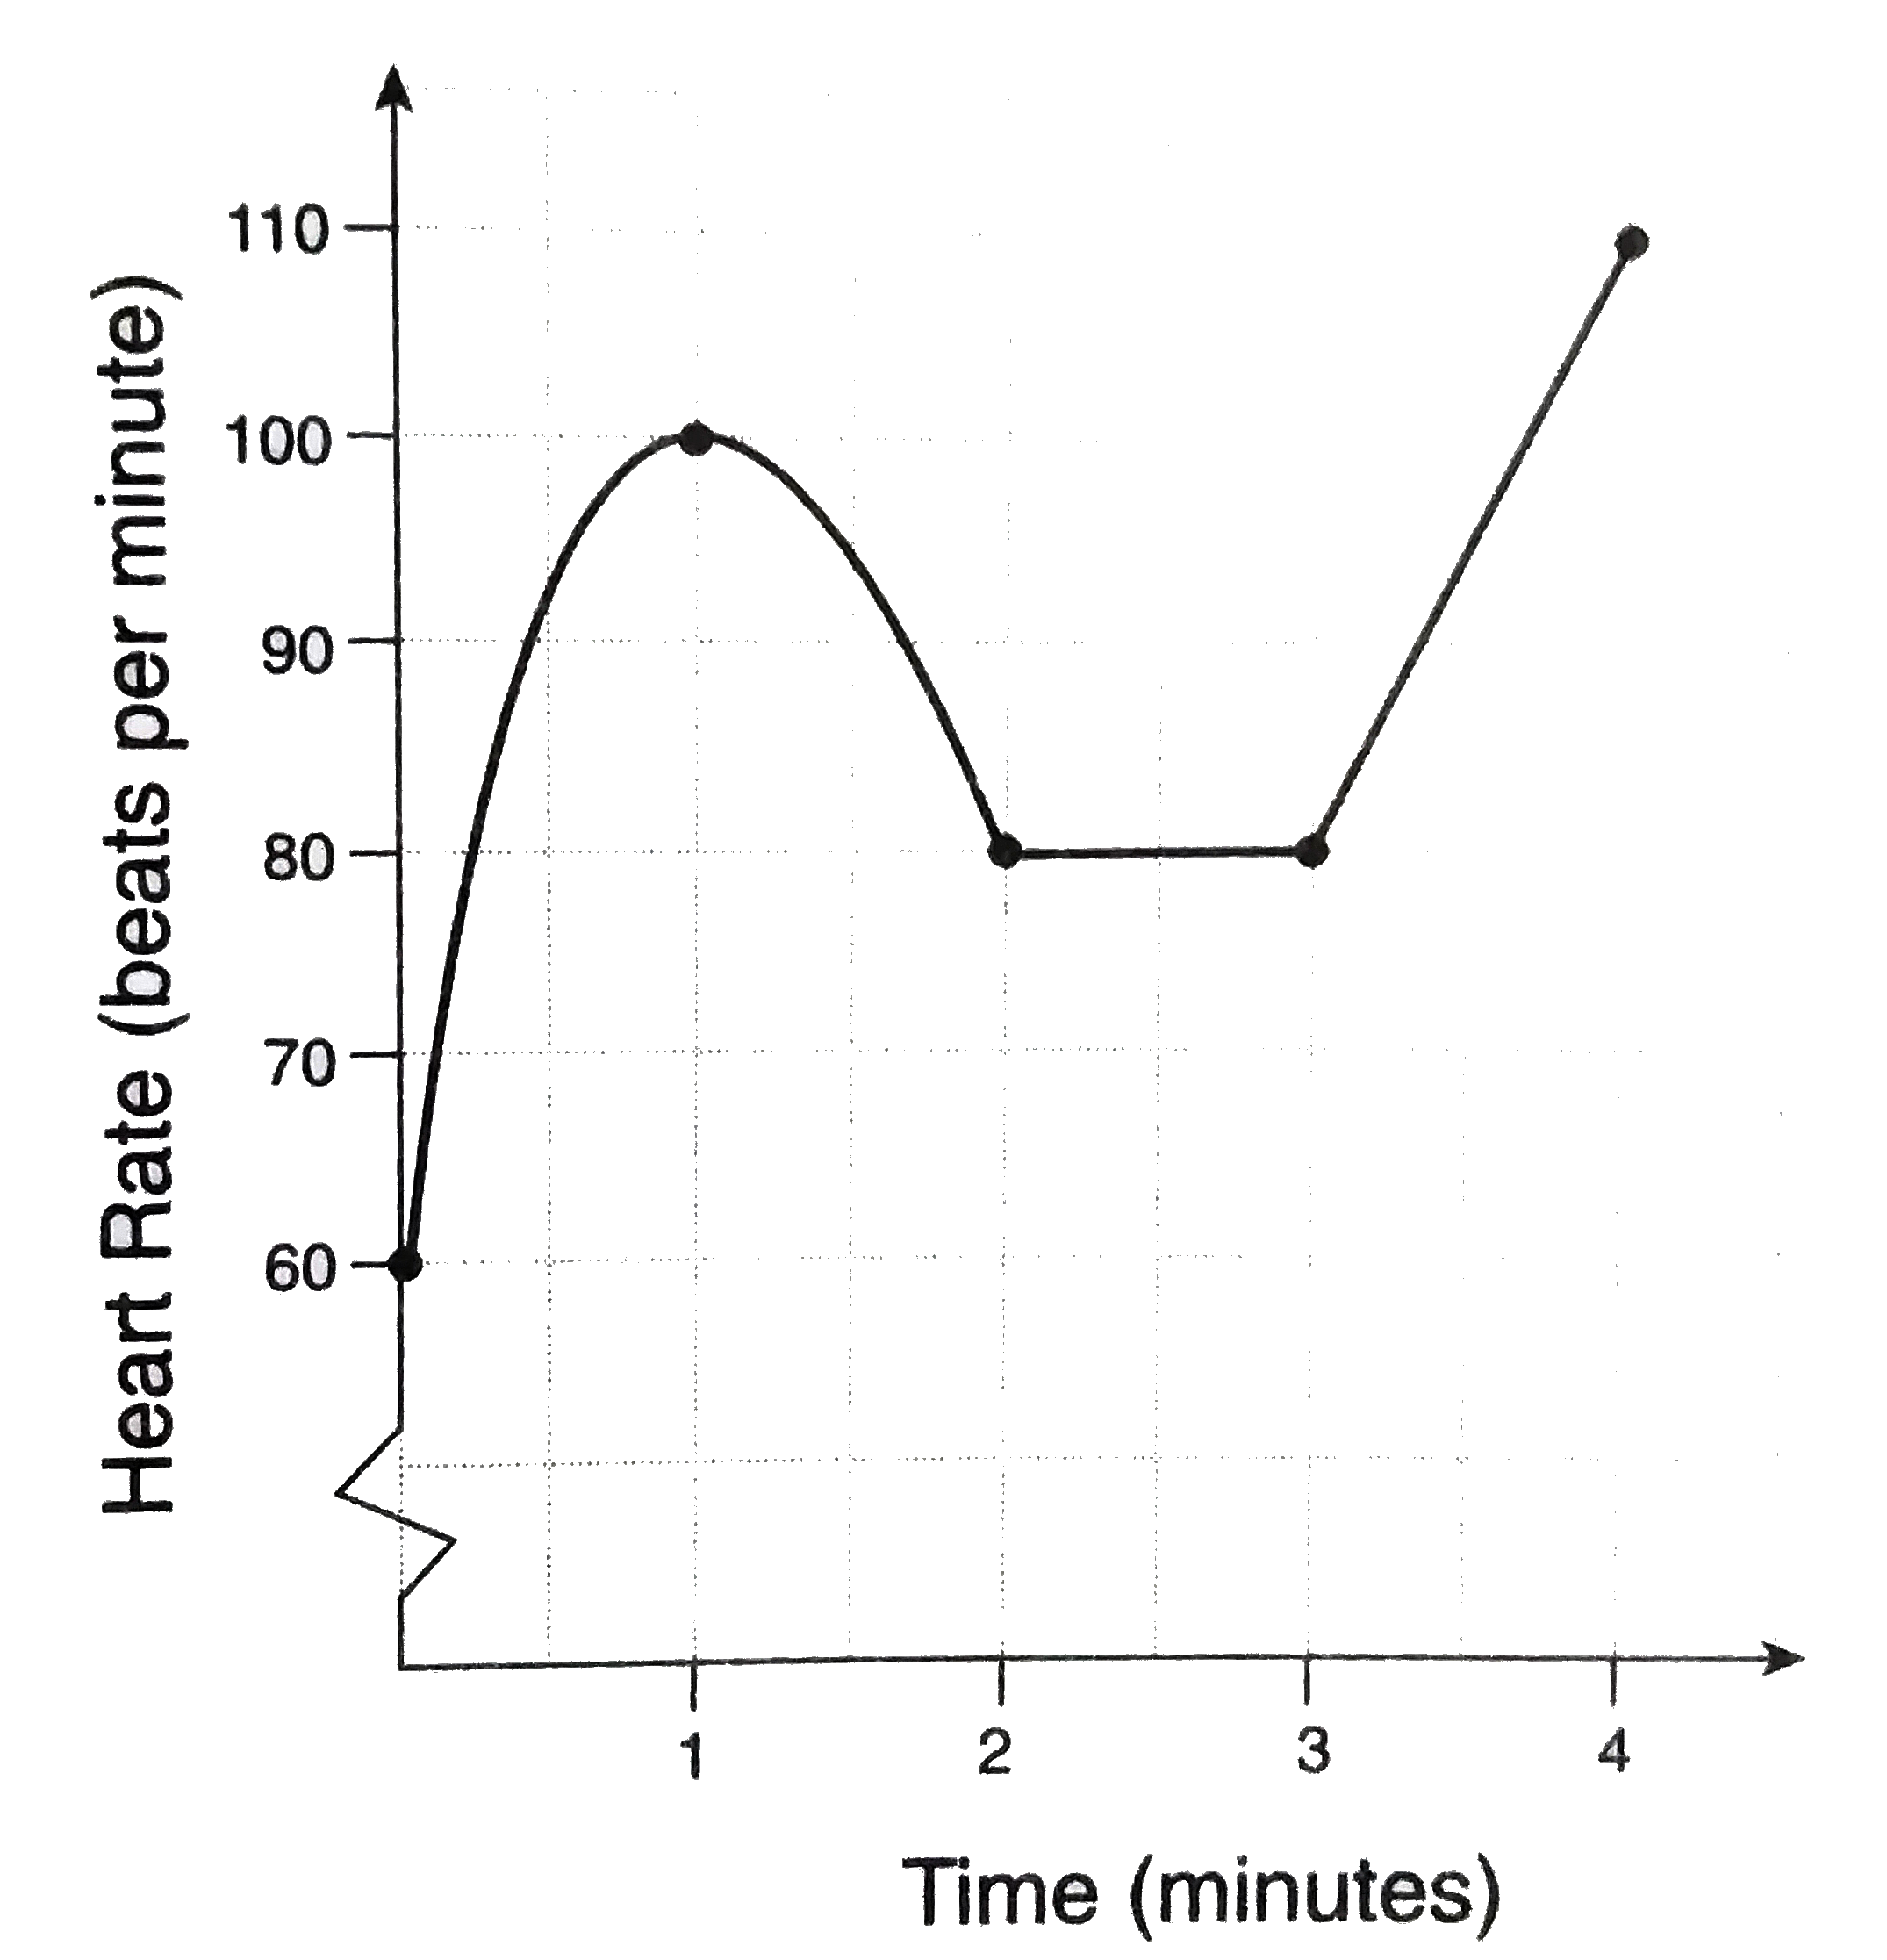
Question 13 and 14 refer to the gaph above which shows the heart rate, in veats per minutes, of a jogger during a 4-minutes interval.
Q. The greatest percent of increase in the jogger's heart rate occured over what interval of time, in minutes?A0 to 1B1 to 2C2 to 3D3 to 4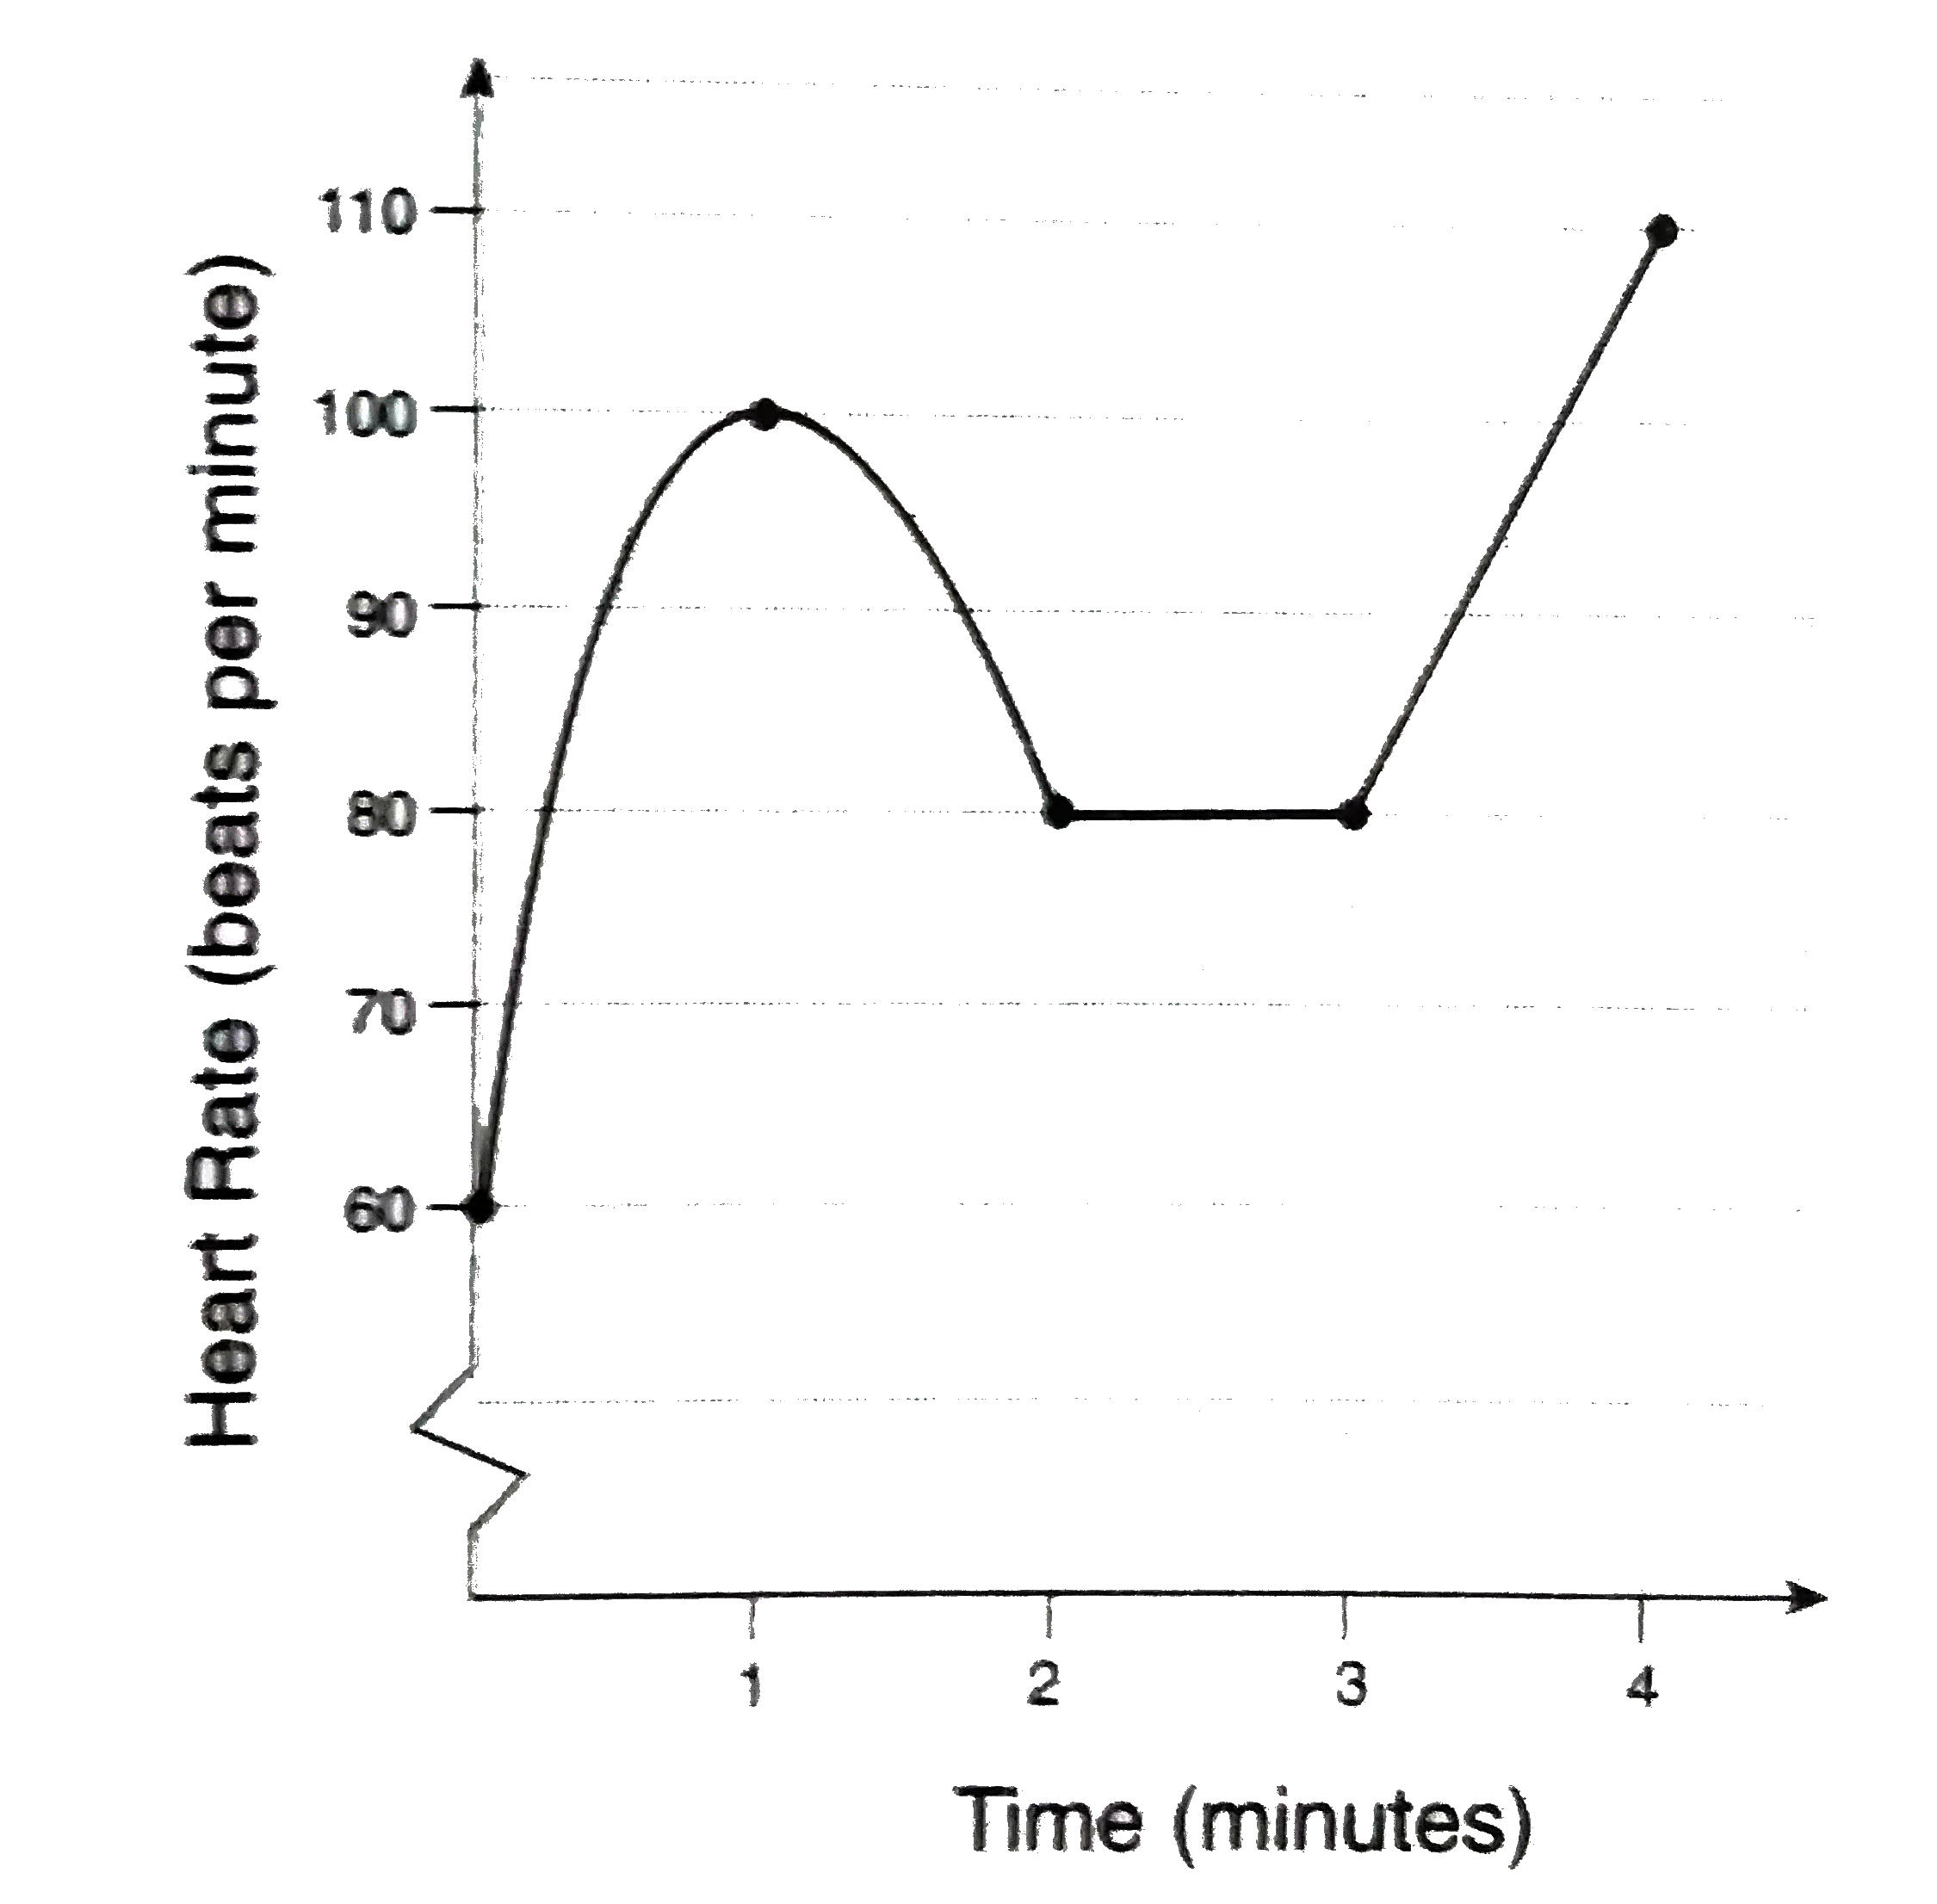
Question 13 and 14 refer to the gaph above which shows the heart rate, in veats per minutes, of a jogger during a 4-minutes interval.
Q. Overr what interval of time, in minutes, was the jogger's heart rate changing at a constant rate?A0 to 1B1 to 2C2 to 3D3 to 4
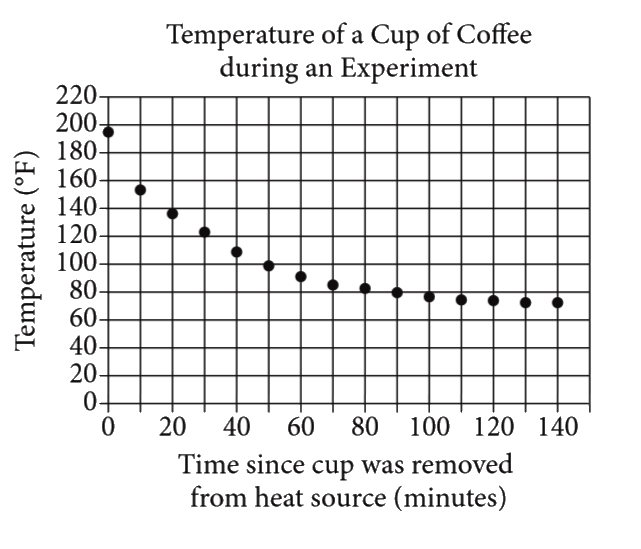
In an experiment, a heated cup of coffee is removed from a heat source, and the cup of coffee is then left in a room that is kept at a constant temperature. The graph above shows the temperature, in degrees Fahrenheit (.∘F), of the coffee immediately after being removed from the heat source and at 10-minute intervals thereafter.
During which of the following 10-minute intervals does the temperature of the coffee decrease at the greatest average rate?
View Solution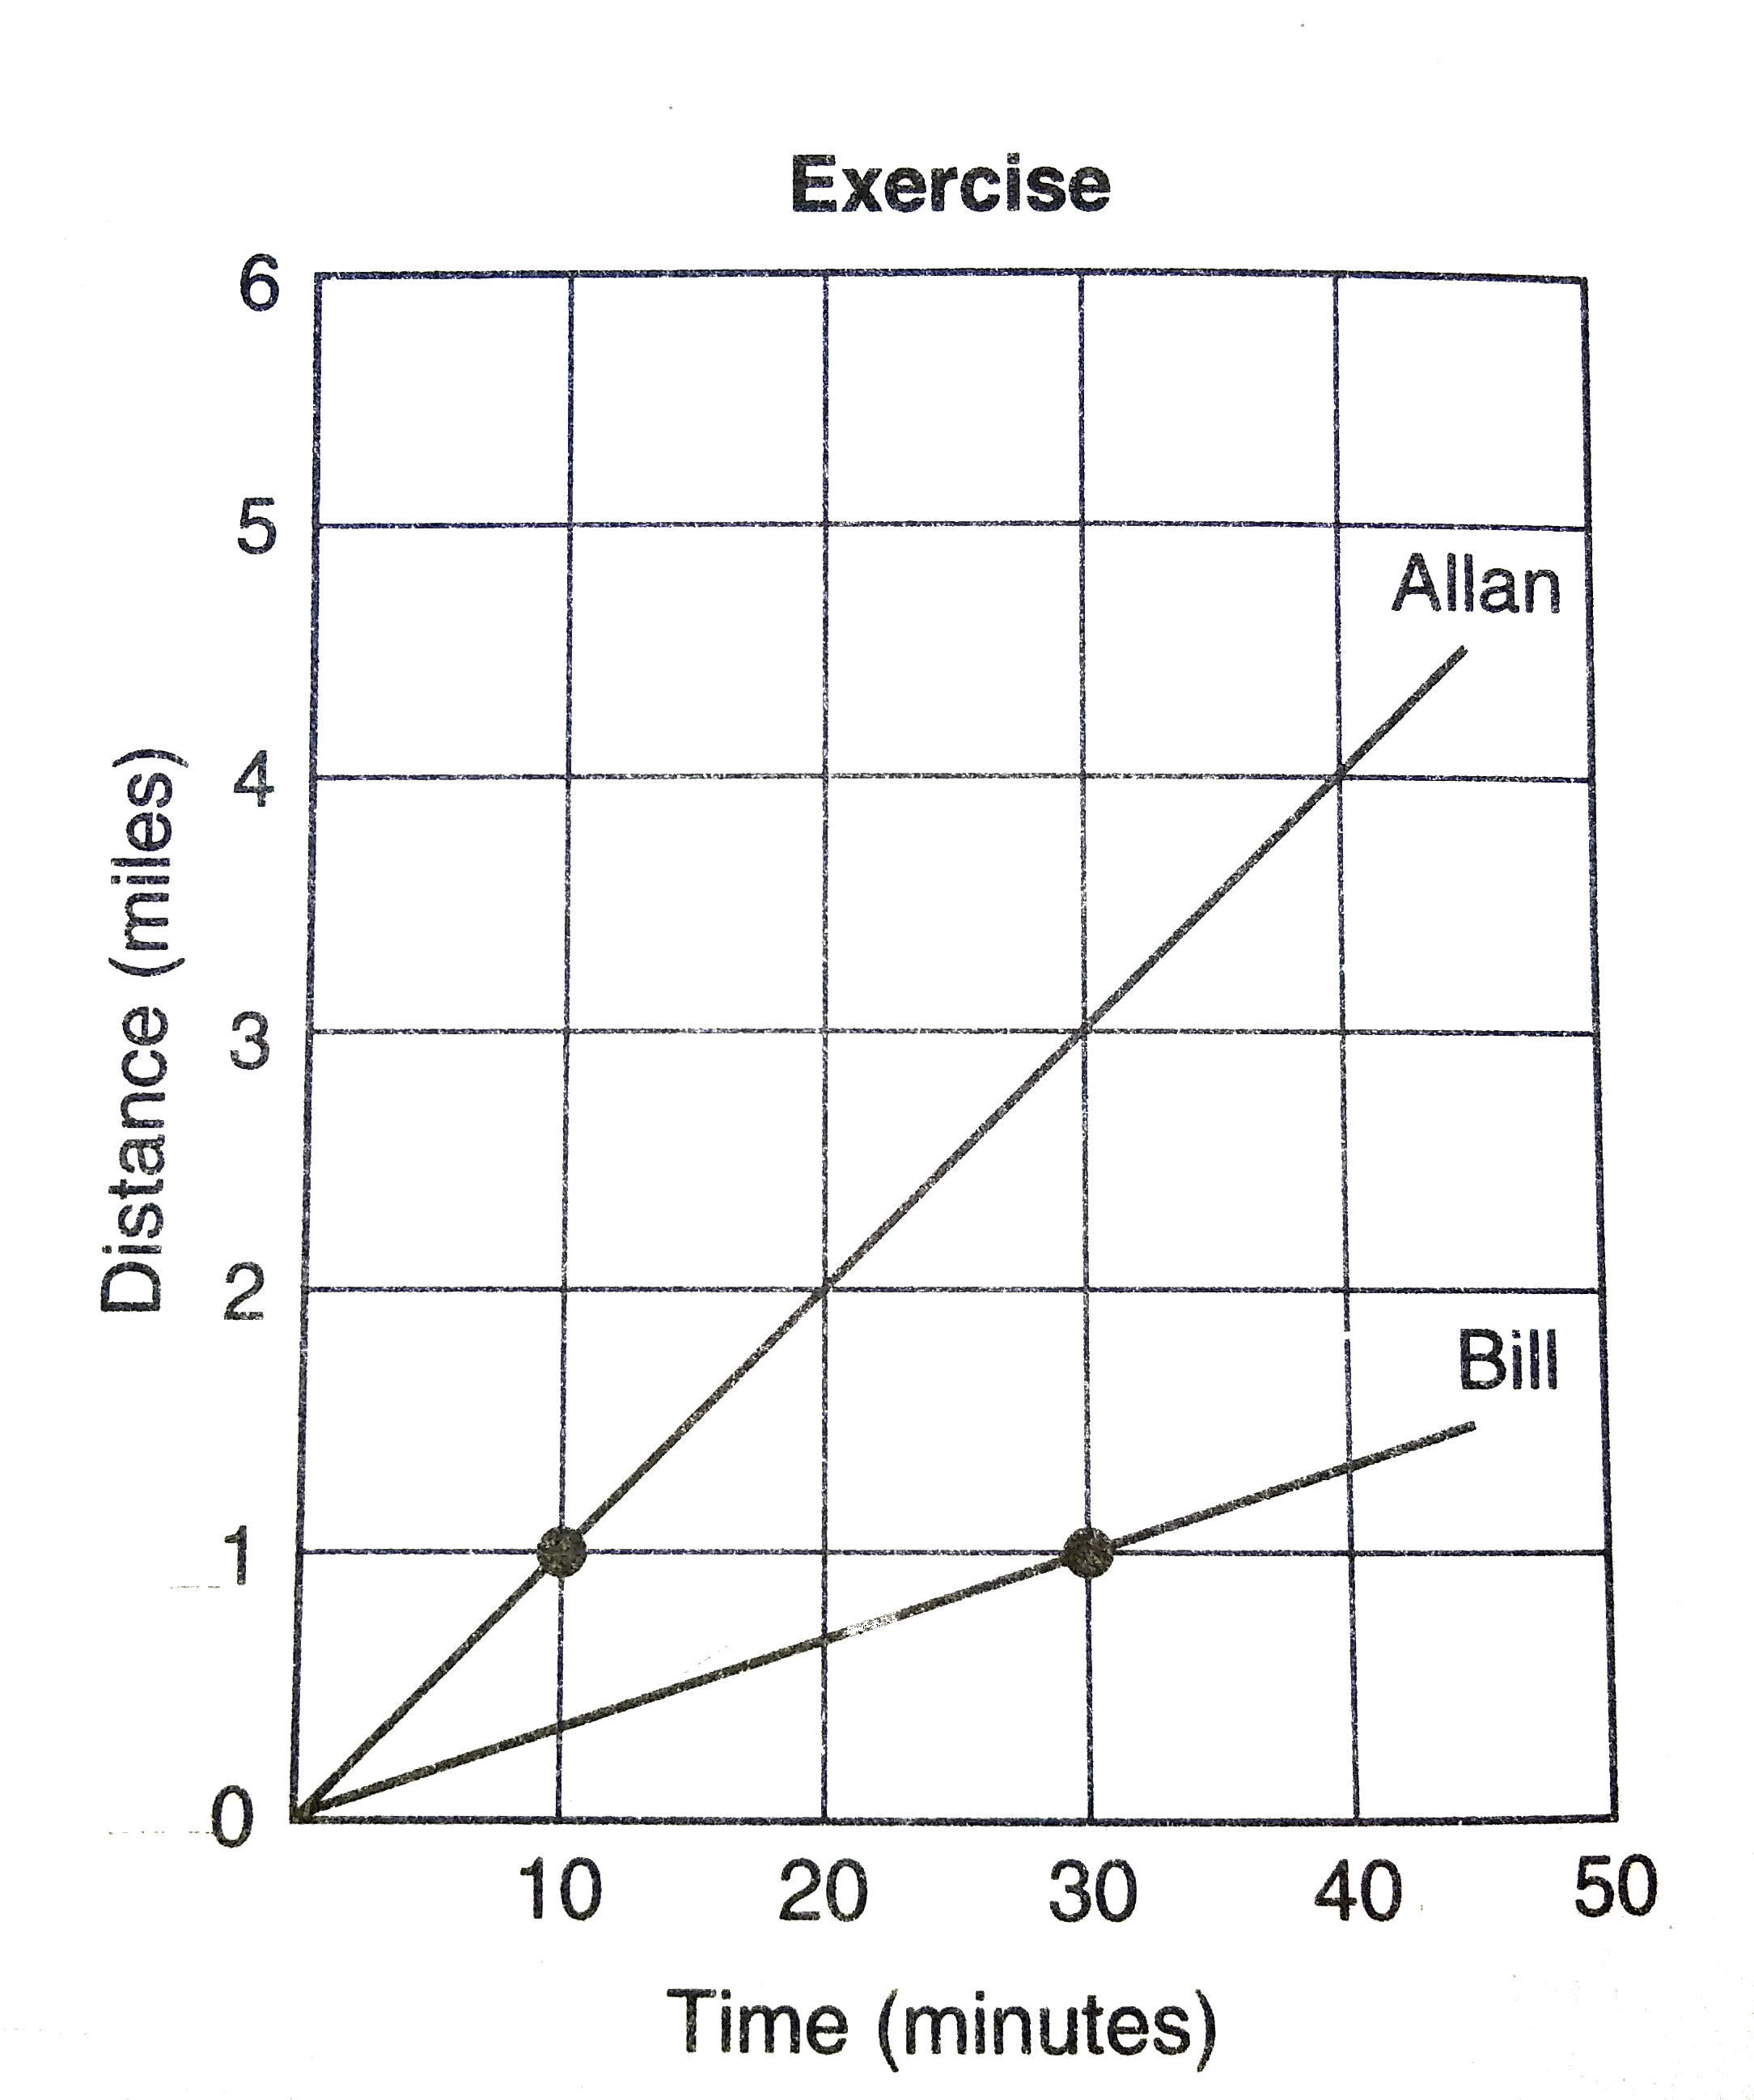
At 9:00A.M. Allan began jogging and Bill began walking at constant rates around the same circular 14 mile track. The figure above compares their times in minutes and corresponding distances in miles. Which statement or statements must be true?
I. Bill's average rate of walking was 2 miles per hour.
II. At 9:00A.M. Allan had jogged 35 mile more than Bill had walked.
III. At 9:30 A.M. Allan had completed 8 more laps around the track than Bill.
View SolutionPaula jogged for a total of 30 minutes. Her average speed for the first 10 minutes was 5 miles per hour. During the remainder of her time, she jogged 2.5 miles. What was Paula's average for her entire jog ?
View Solution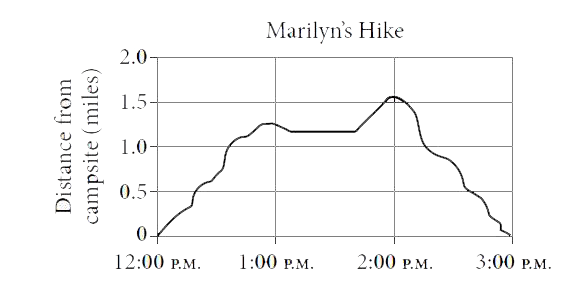
The graph above shows Marilyn’s distance from her campsite during a 3‑hour hike. She stopped for 30 minutes during her hike to have lunch. Based of the graph, which of the following is closest to the time she finished lunch and continued her hike?
View SolutionPassage 1 is adapted from Alexis de Tocqueville, Democracy in America, Volume 2. Originally published in 1840. Passage 2 is adapted from Harriet Taylor Mill, “Enfranchisement of Women.” Originally published in 1851. As United States and European societies grew increasingly democratic during the nineteenth century, debates arose about whether freedoms enjoyed by men should be extended to women as well.
Passage 1
I have shown how democracy destroys or modifies the different inequalities which originate in society, but is this all? or does it not ultimately affect that great inequality of man and woman which has seemed, up to the present day, to be eternally based in human nature? I believe that the social changes which bring nearer to the same level the father and son, the master and servant, and superiors and inferiors generally speaking, will raise woman and make her more and more the equal of man. But here, more than ever, I feel the necessity of making myself clearly understood, for there is no subject on which the coarse and lawless fancies of our age have taken a freer range.
There are people in Europe who, confounding together the different characteristics of the sexes, would make of man and woman beings not only equal but alike. They would give to both the same functions, impose on both the same duties, and grant to both the same rights, they would mix them in all things—their occupations, their pleasures, their business. It may readily be conceived, that by thus attempting to make one sex equal to the other, both are degraded, and from so preposterous a medley of the works of nature nothing could ever result but weak men and disorderly women.
It is not thus that the Americans understand that species of democratic equality which may be established between the sexes. They admit, that as nature has appointed such wide differences between the physical and moral constitution of man and woman, her manifest design was to give a distinct employment to their various faculties, and they hold that improvement does not consist in making beings so dissimilar do pretty nearly the same things, but in getting each of them to fulfill their respective tasks in the best possible manner. The Americans have applied to the sexes the great principle of political economy which governs the manufactures of our age, by carefully dividing the duties of man from those of woman, in order that the great work of society may be the better carried on.
Passage 2
As society was constituted until the last few generations, inequality was its very basis, association grounded on equal rights scarcely existed, to be equals was to be enemies, two persons could hardly coöperate in anything, or meet in any amicable relation, without the law’s appointing that one of them should be the superior of the other. Mankind have outgrown this state, and all things now tend to substitute, as the general principle of human relations, a just equality, instead of the dominion of the strongest. But of all relations, that between men and women, being the nearest and most intimate, and connected with the greatest number of strong emotions, was sure to be the last to throw off the old rule, and receive the new, for, in proportion to the strength of a feeling is the tenacity with which it clings to the forms and circumstances with which it has even accidentally become associated. . . .
. . . The proper sphere for all human beings is the largest and highest which they are able to attain to. What this is, cannot be ascertained without complete liberty of choice. . . . Let every occupation be open to all, without favor or discouragement to any, and employments will fall into the hands of those men or women who are found by experience to be most capable of worthily exercising them. There need be no fear that women will take out of the hands of men any occupation which men perform better than they. Each individual will prove his or her capacities, in the only way in which capacities can be proved,—by trial, and the world will have the benefit of the best faculties of all its inhabitants. But to interfere beforehand by an arbitrary limit, and declare that whatever be the genius, talent, energy, or force of mind, of an individual of a certain sex or class, those faculties shall not be exerted, or shall be exerted only in some few of the many modes in which others are permitted to use theirs, is not only an injustice to the individual, and a detriment to society, which loses what it can ill spare, but is also the most effectual way of providing that, in the sex or class so fettered, the qualities which are not permitted to be exercised shall not exist.
Which choice best describes the ways that the two authors conceive of the individual’s proper position in society?
View Solution

