Which of the accomanying tables that show how population is changing over time illustrate exponential decay?
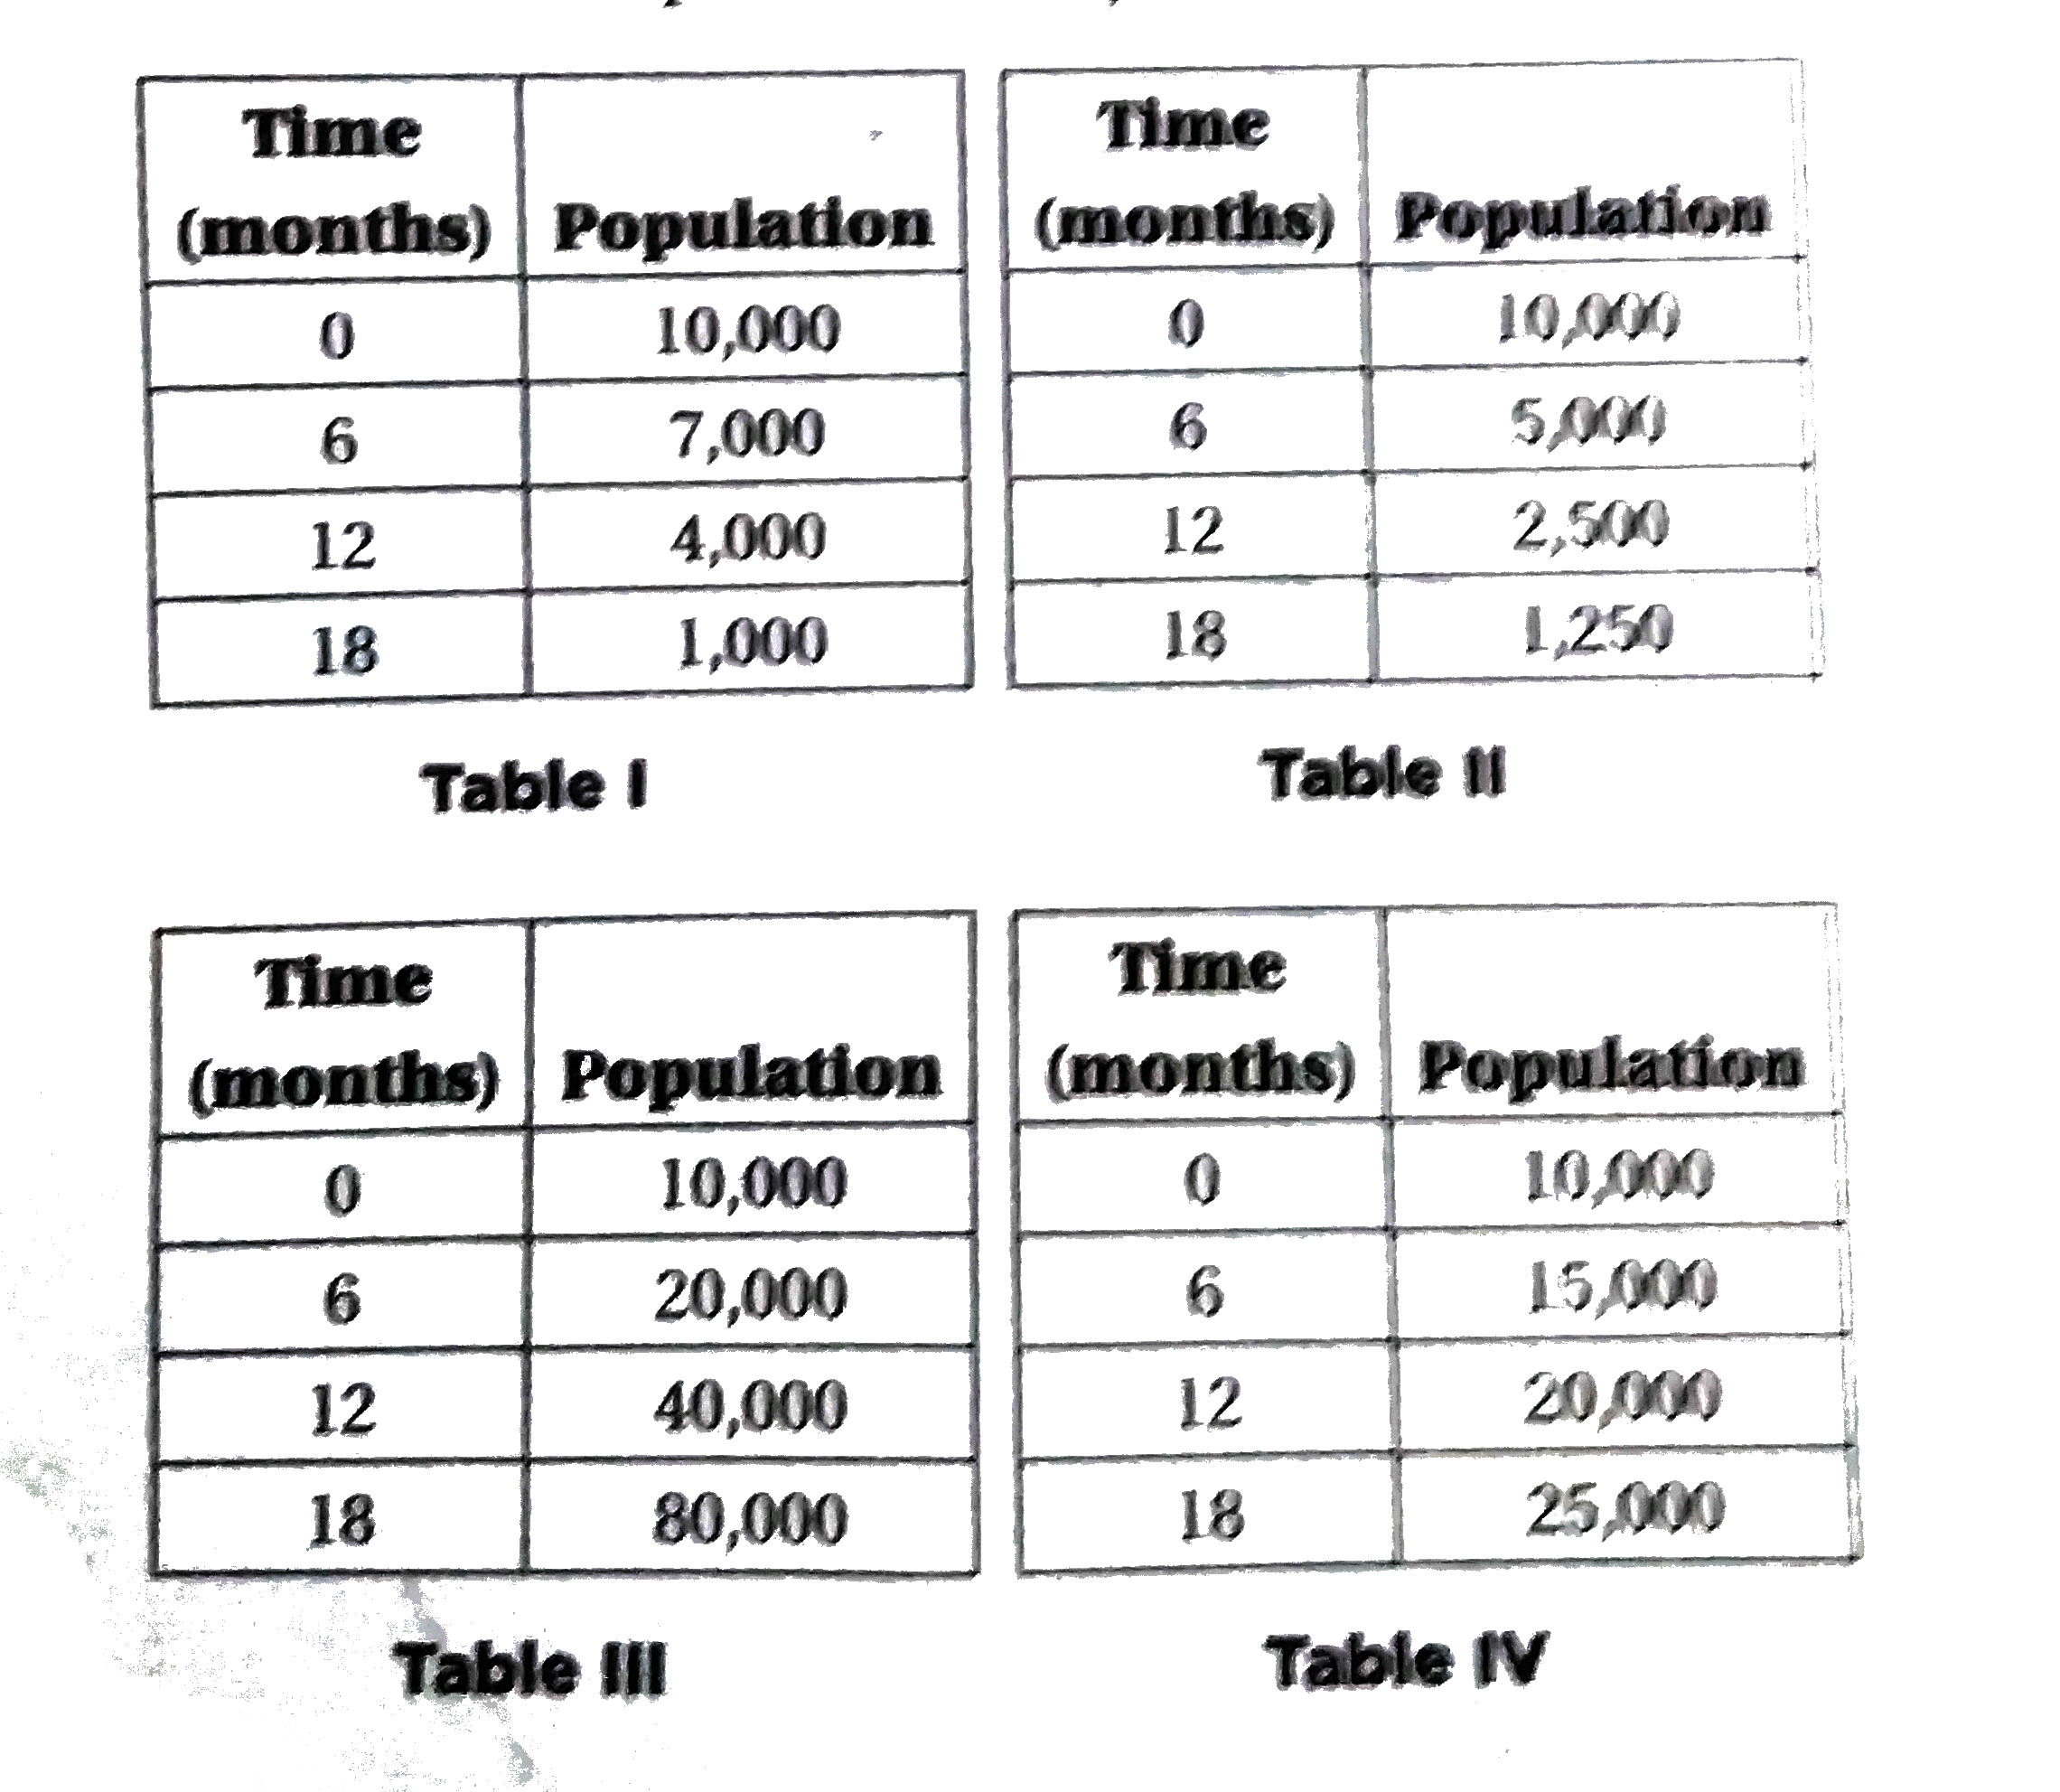
Table I
Table II
Table III
Table IV
The correct Answer is:B
Step by step video, text & image solution for Which of the accomanying tables that show how population is changing over time illustrate exponential decay? by Maths experts to help you in doubts & scoring excellent marks in Class 12 exams.
Updated on:21/07/2023Topper's Solved these Questions
- PROBLEM SOLVING AND DATA ANALYSISBook:ENGLISH SATChapter:PROBLEM SOLVING AND DATA ANALYSISExercise:Grib-In
Explore 40 Videos
- PROBLEM SOLVING AND DATA ANALYSISBook:ENGLISH SATChapter:PROBLEM SOLVING AND DATA ANALYSISExercise:Grib-In
Explore 40 Videos
- PROBLEM SOLVING AND DATA ANALYSISBook:ENGLISH SATChapter:PROBLEM SOLVING AND DATA ANALYSISExercise:EXERICSE
Explore 80 Videos
- PROBLEMS IN CONTEXT Book:ENGLISH SATChapter:PROBLEMS IN CONTEXT Exercise:PRACTICE TEST
Explore 10 Videos
Similar Questions
Knowledge Check
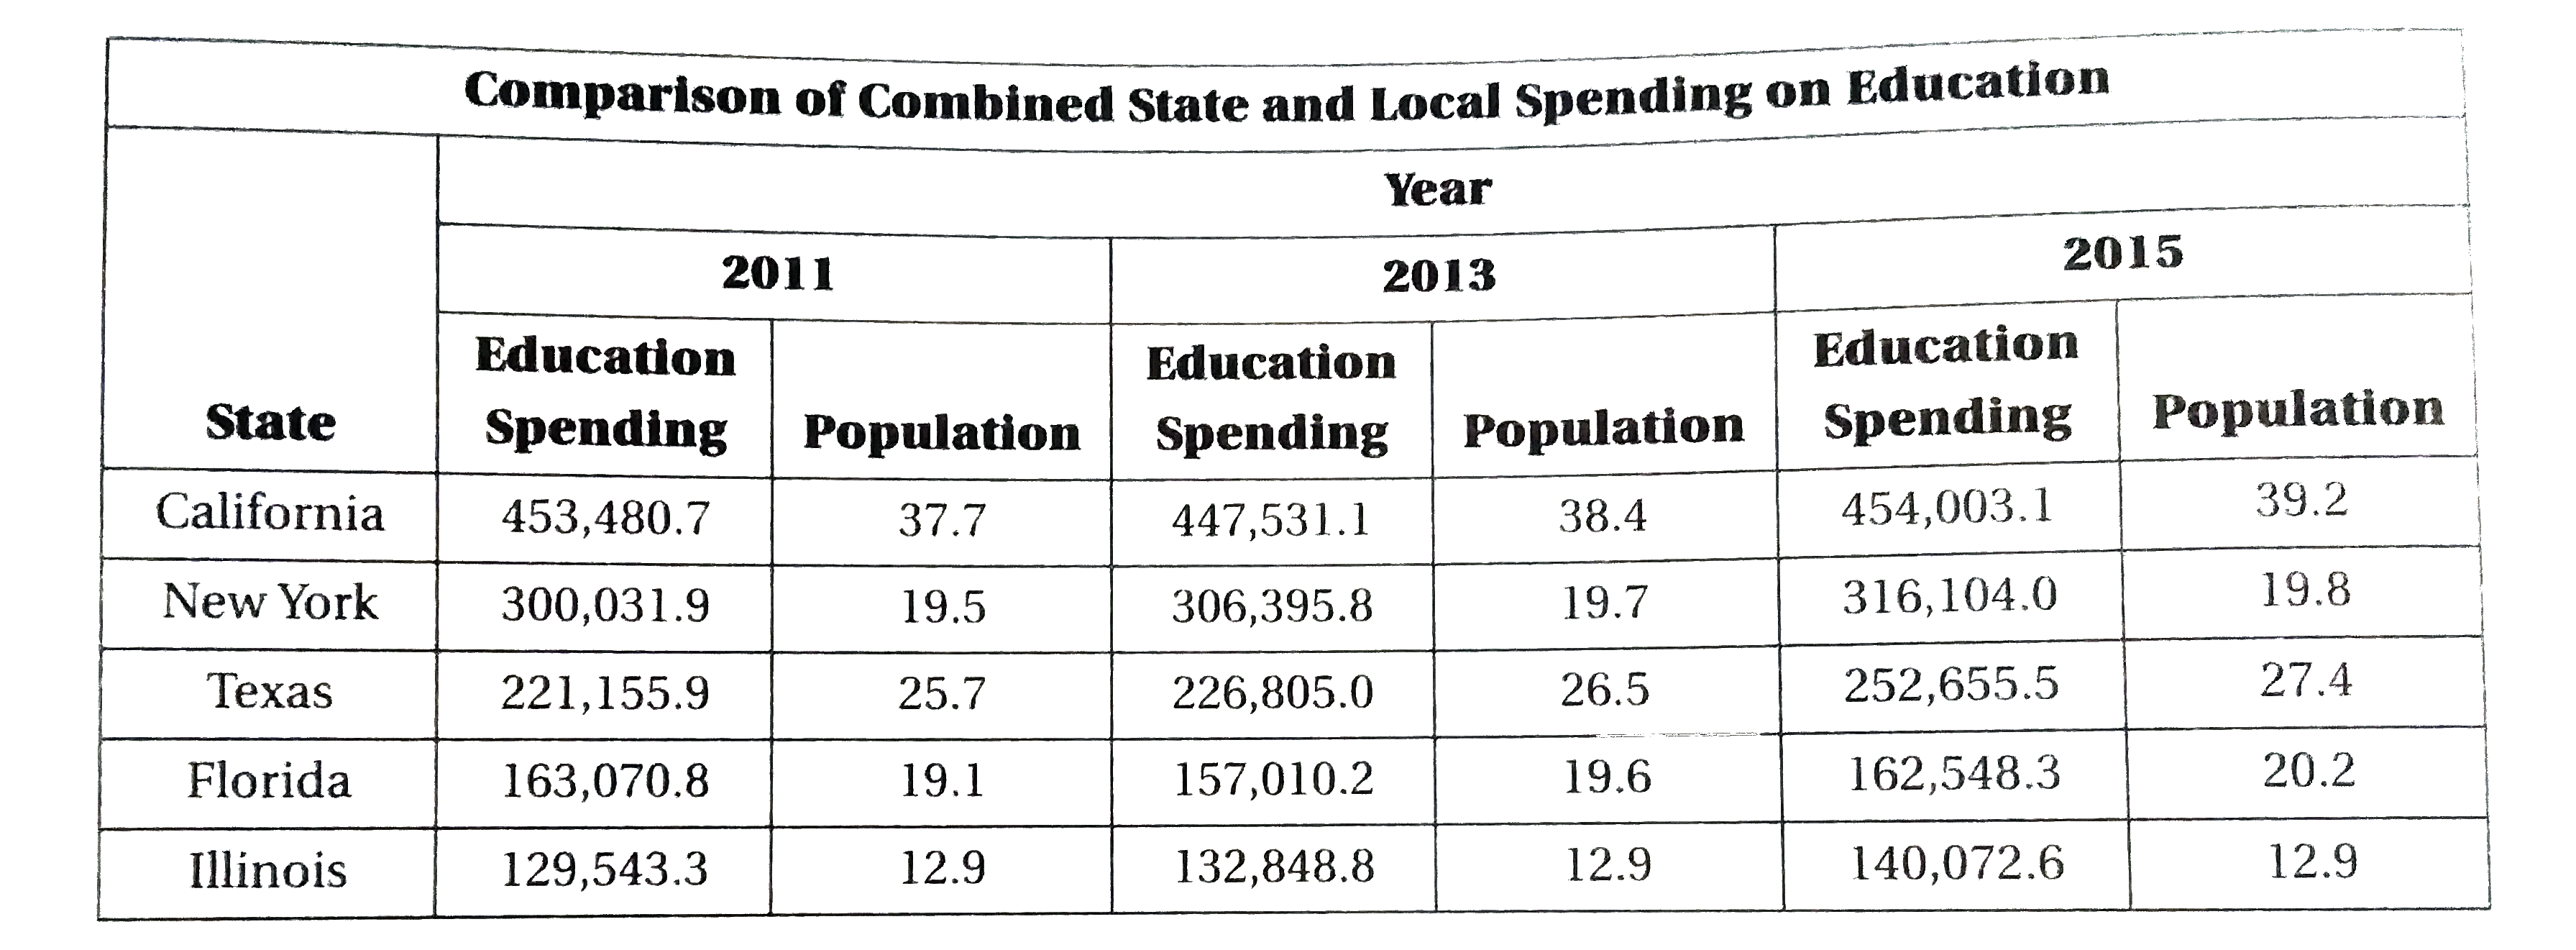
Question 16 and 17 refer to the above table, that shows the population (in millions) and education spending (in millions) and by state for each of the states listed for the years 2011, 2013, and 2015.
Q. Which of the following best approximates the average rate of change in education spending in Texas from 2011 to 2015?A3.2 billion per yearB6.3 billion per yearC10.5 per yearD7.9 billion per year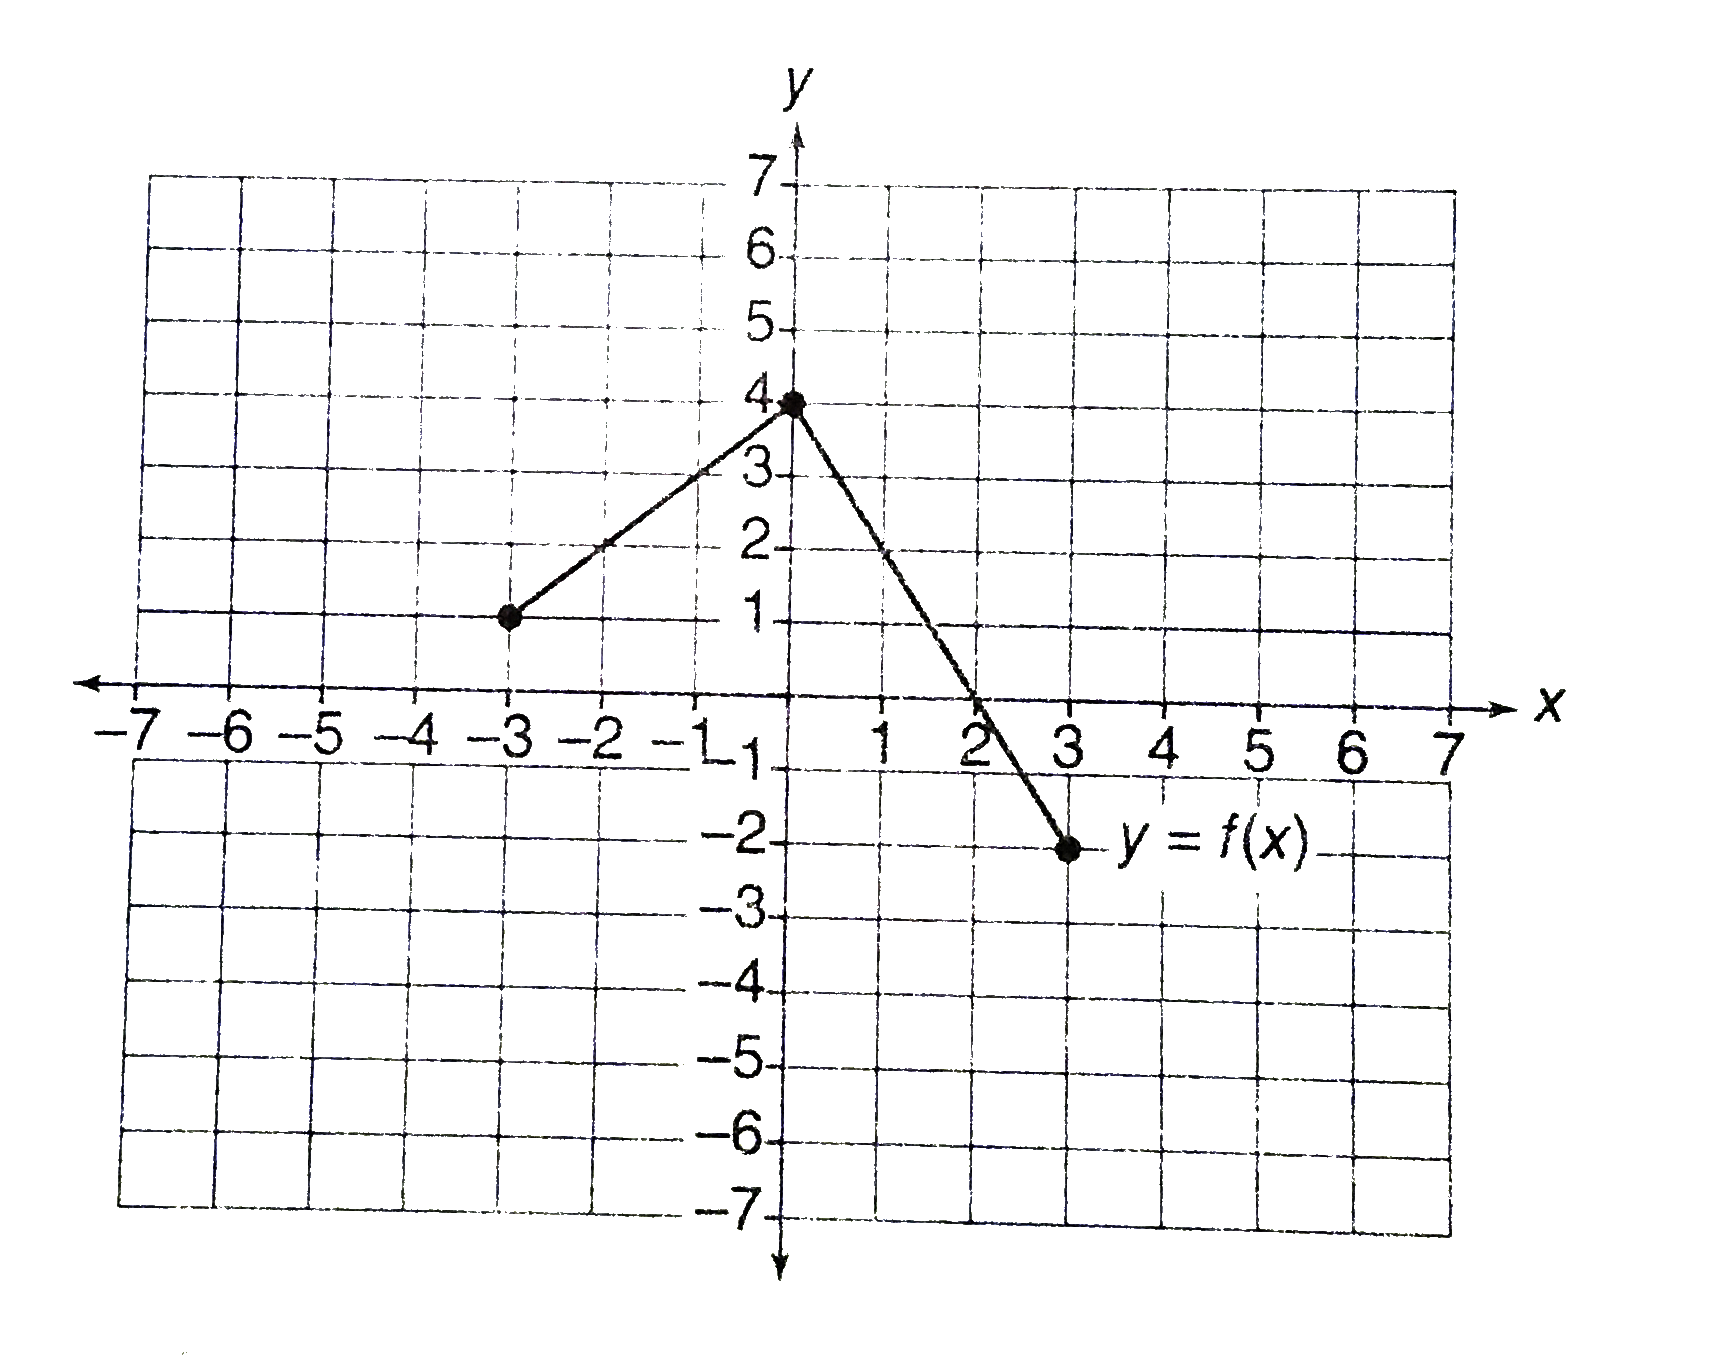
If the accomanying figure above shows the graph of function f, which of the following could represent the graph of y=f(x+1)?A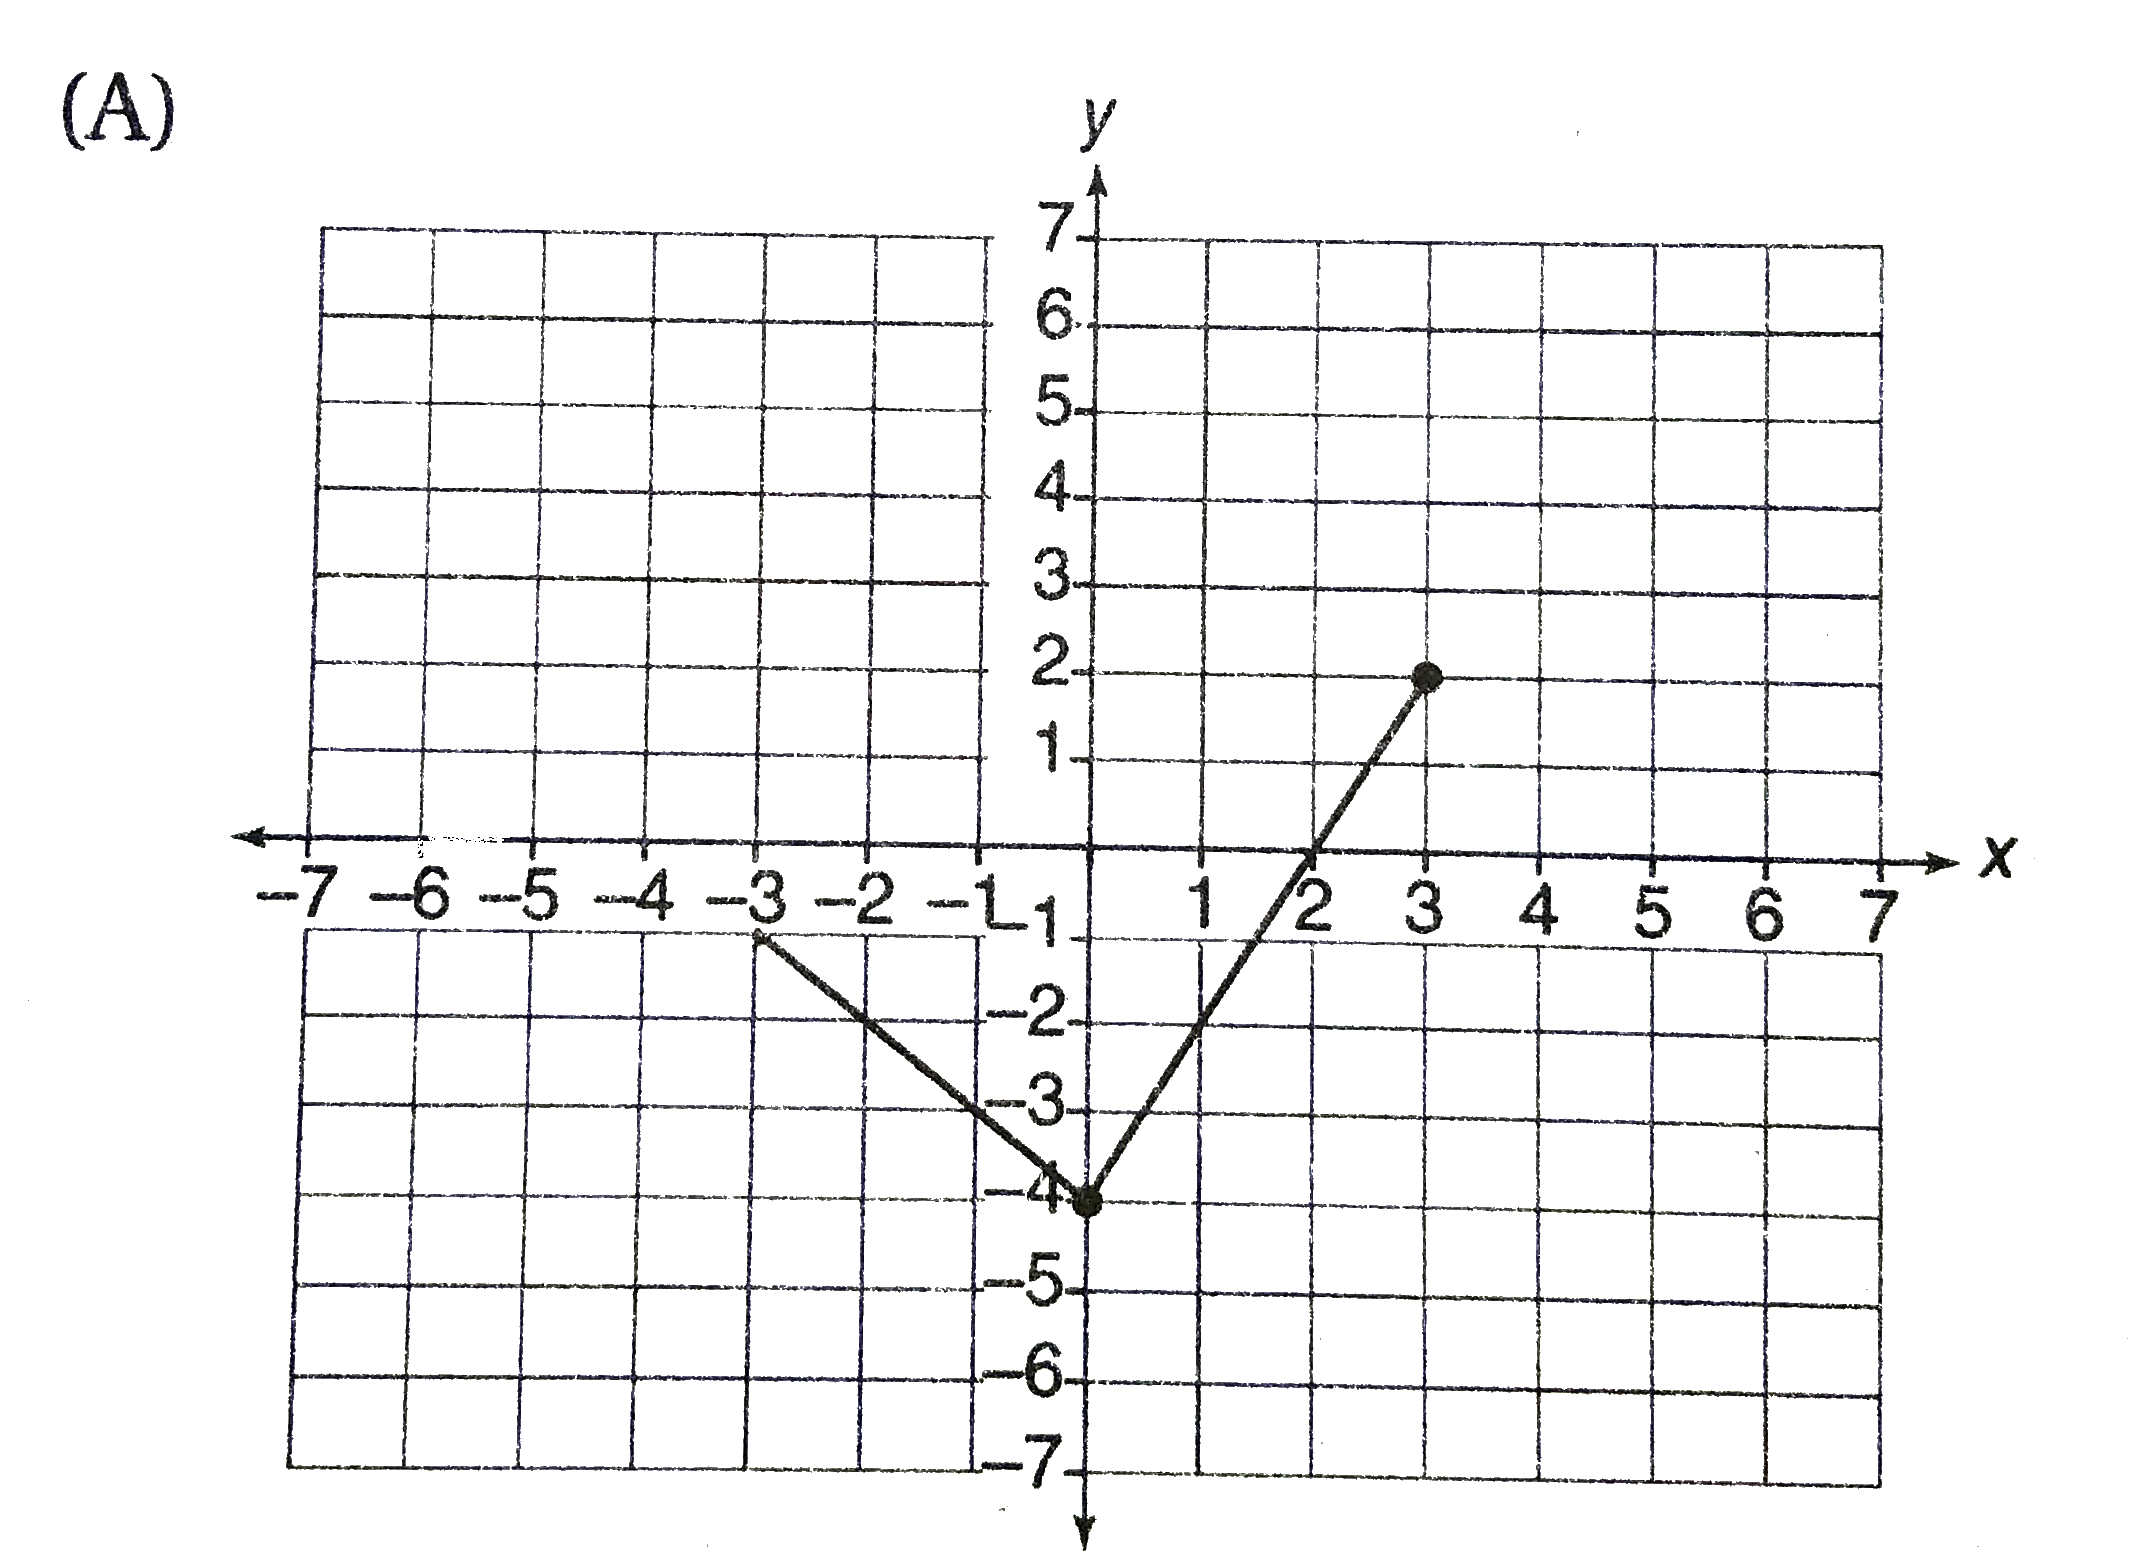 B
B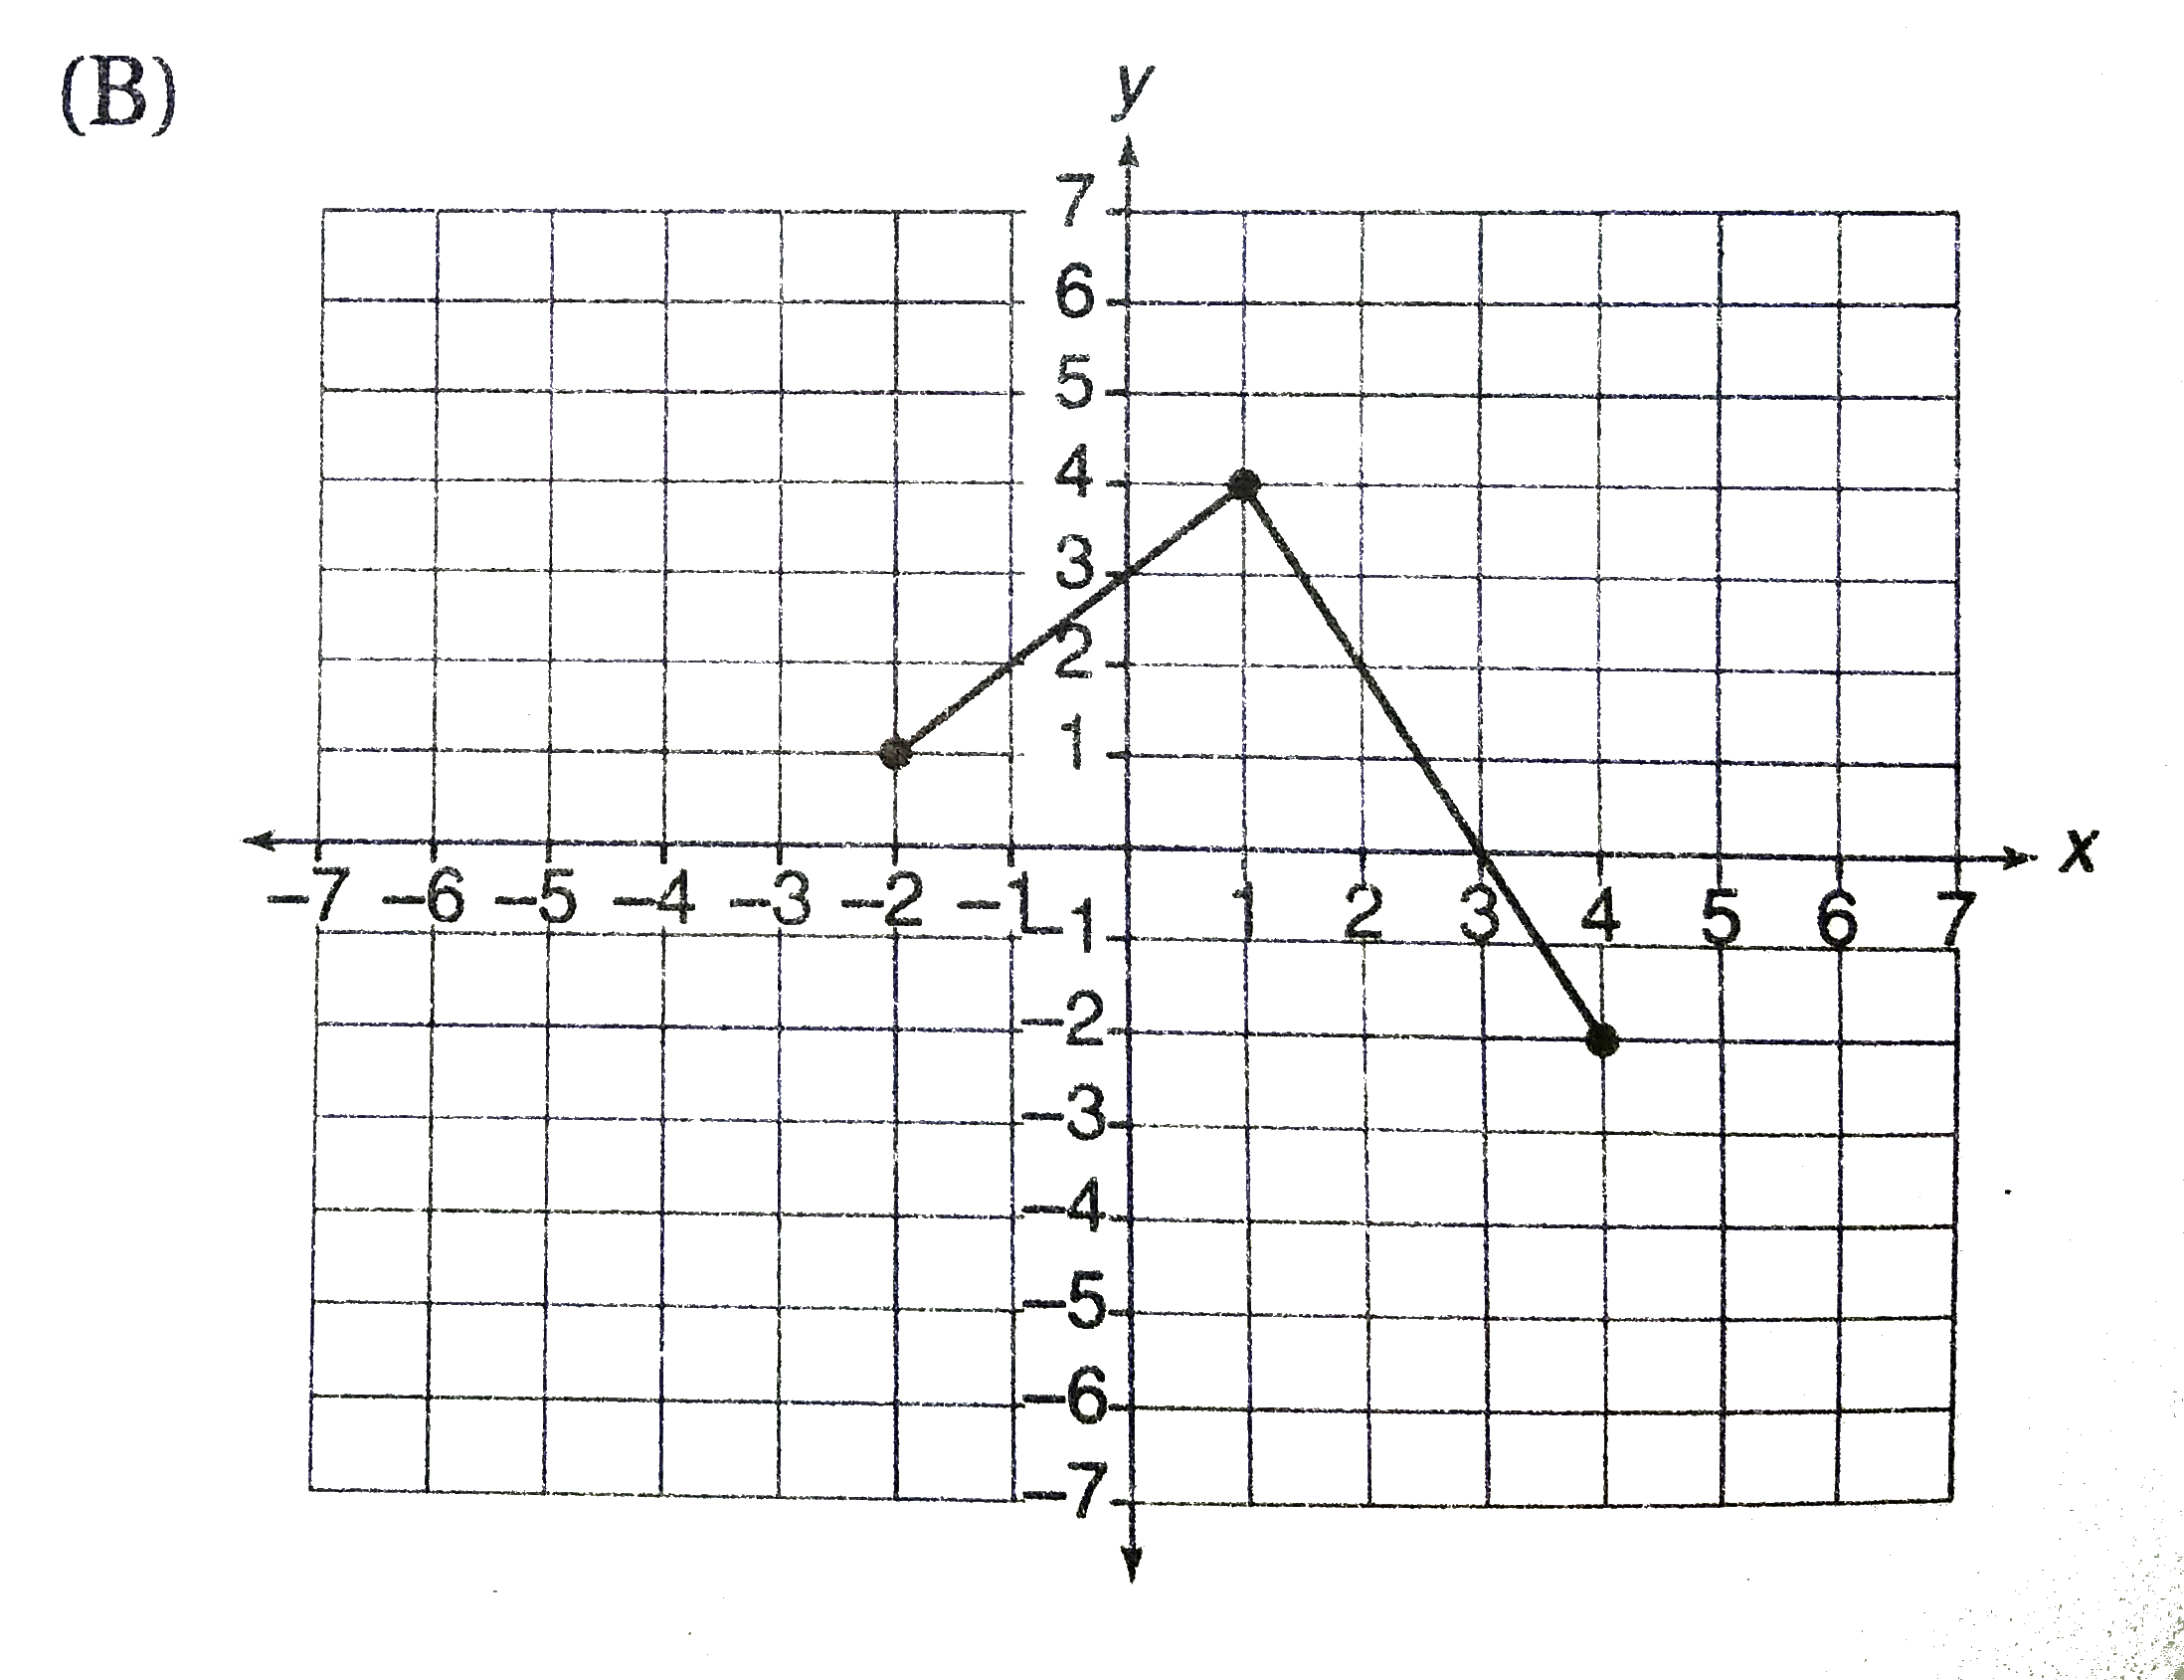 C
C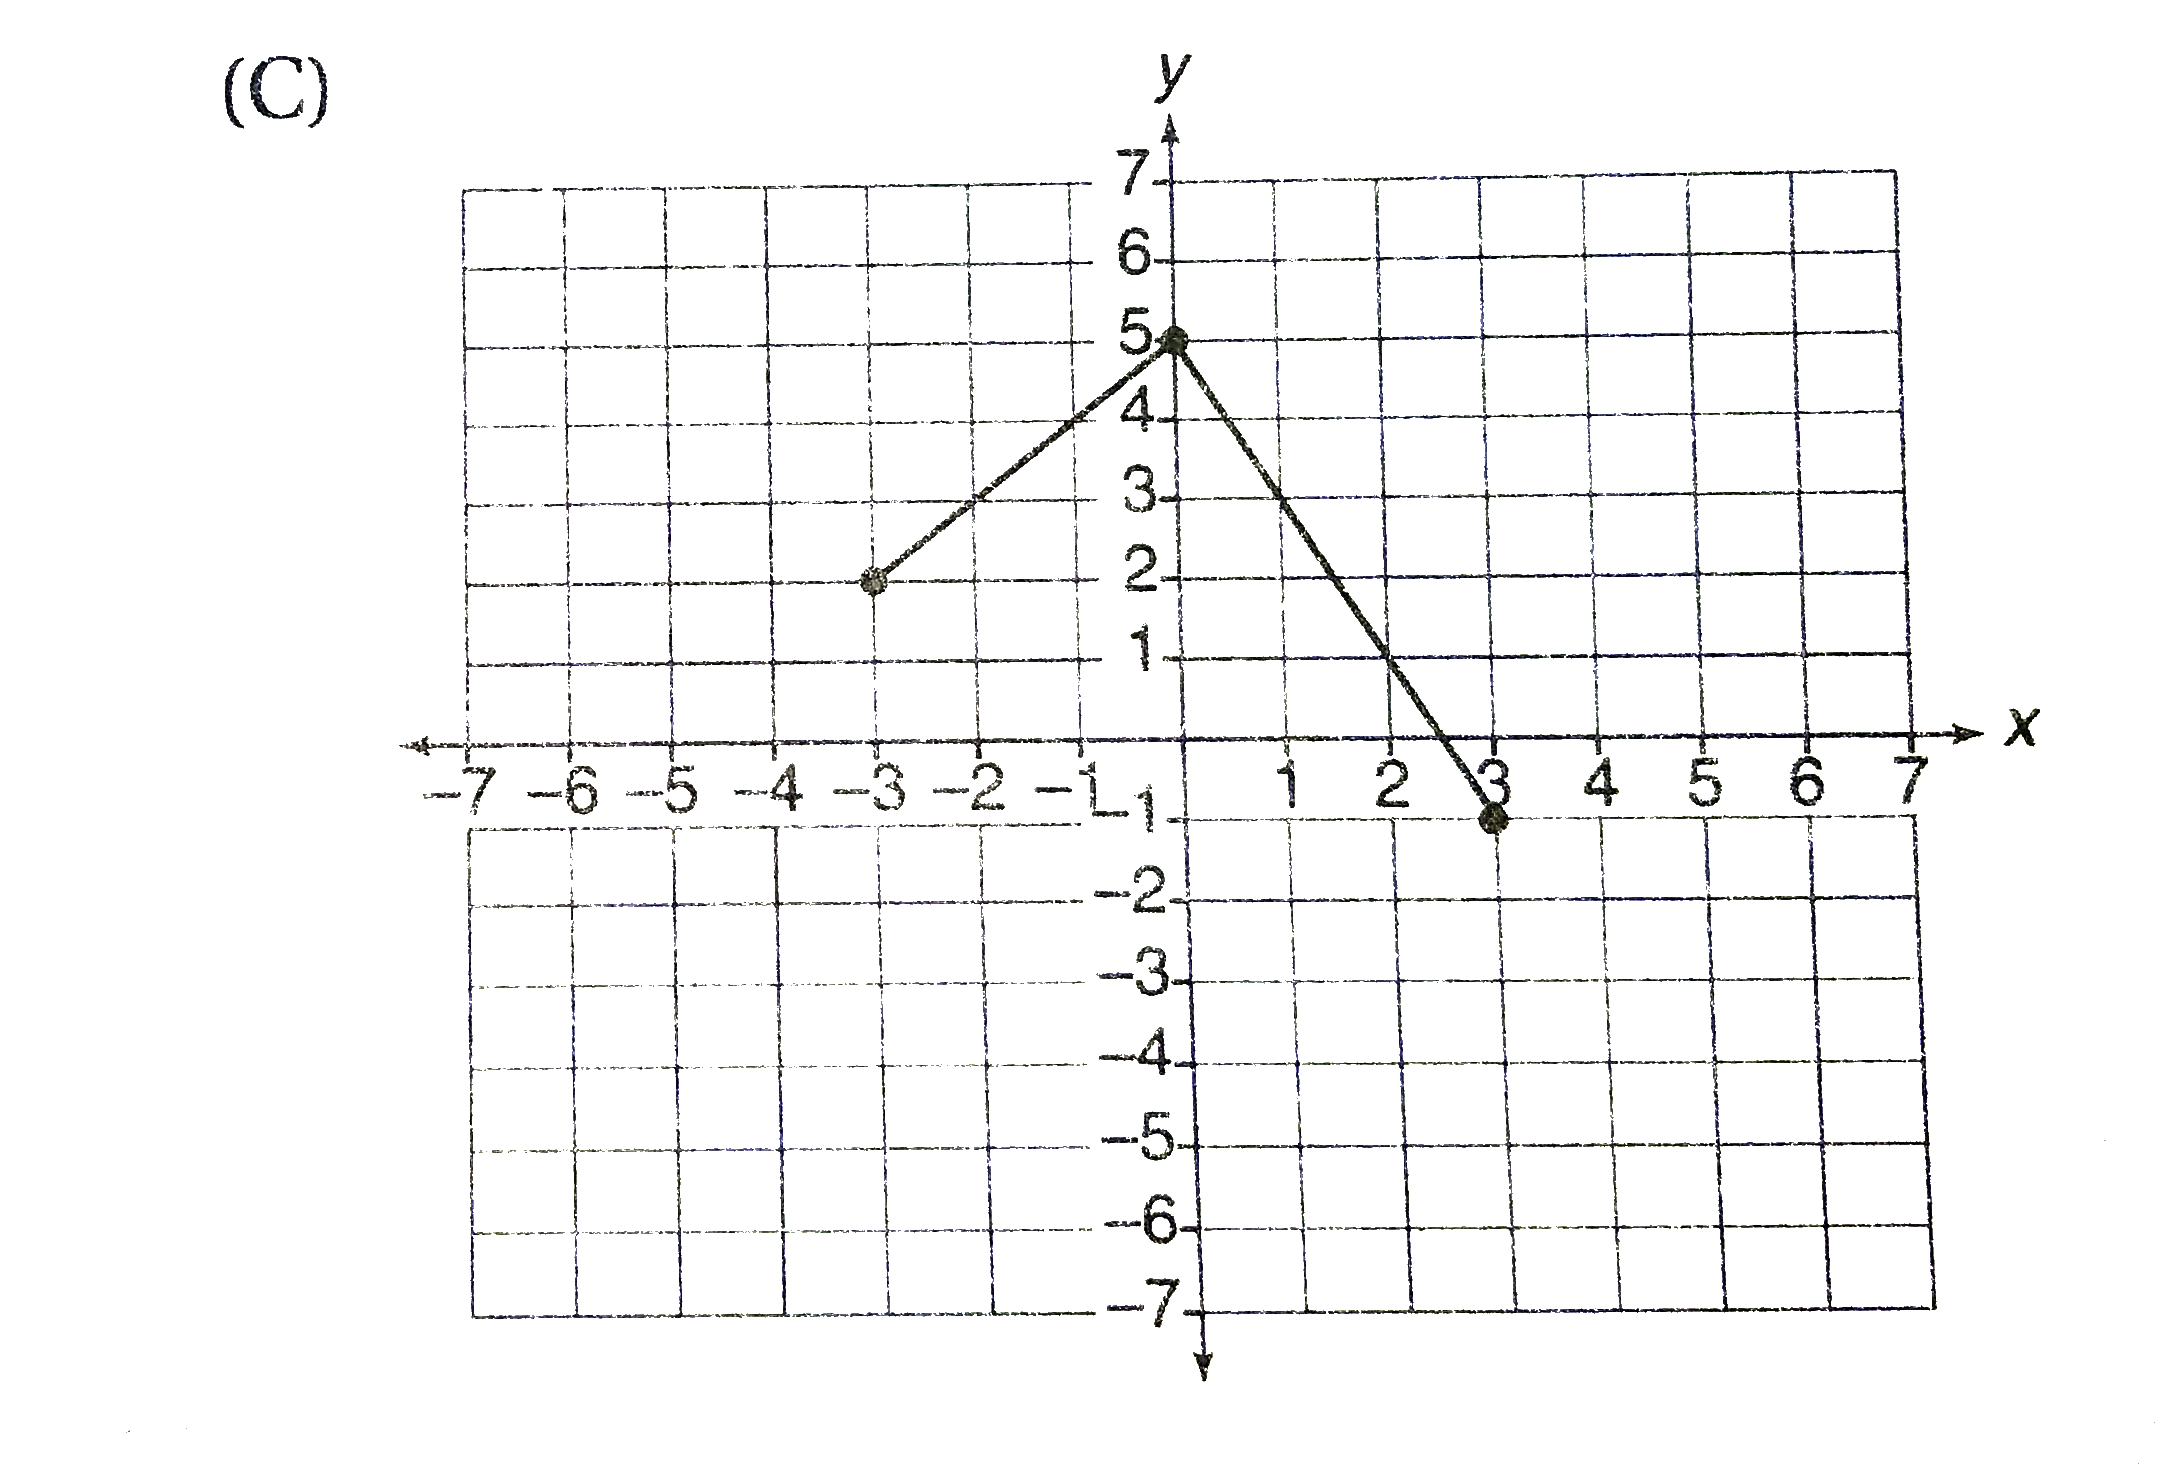 D
D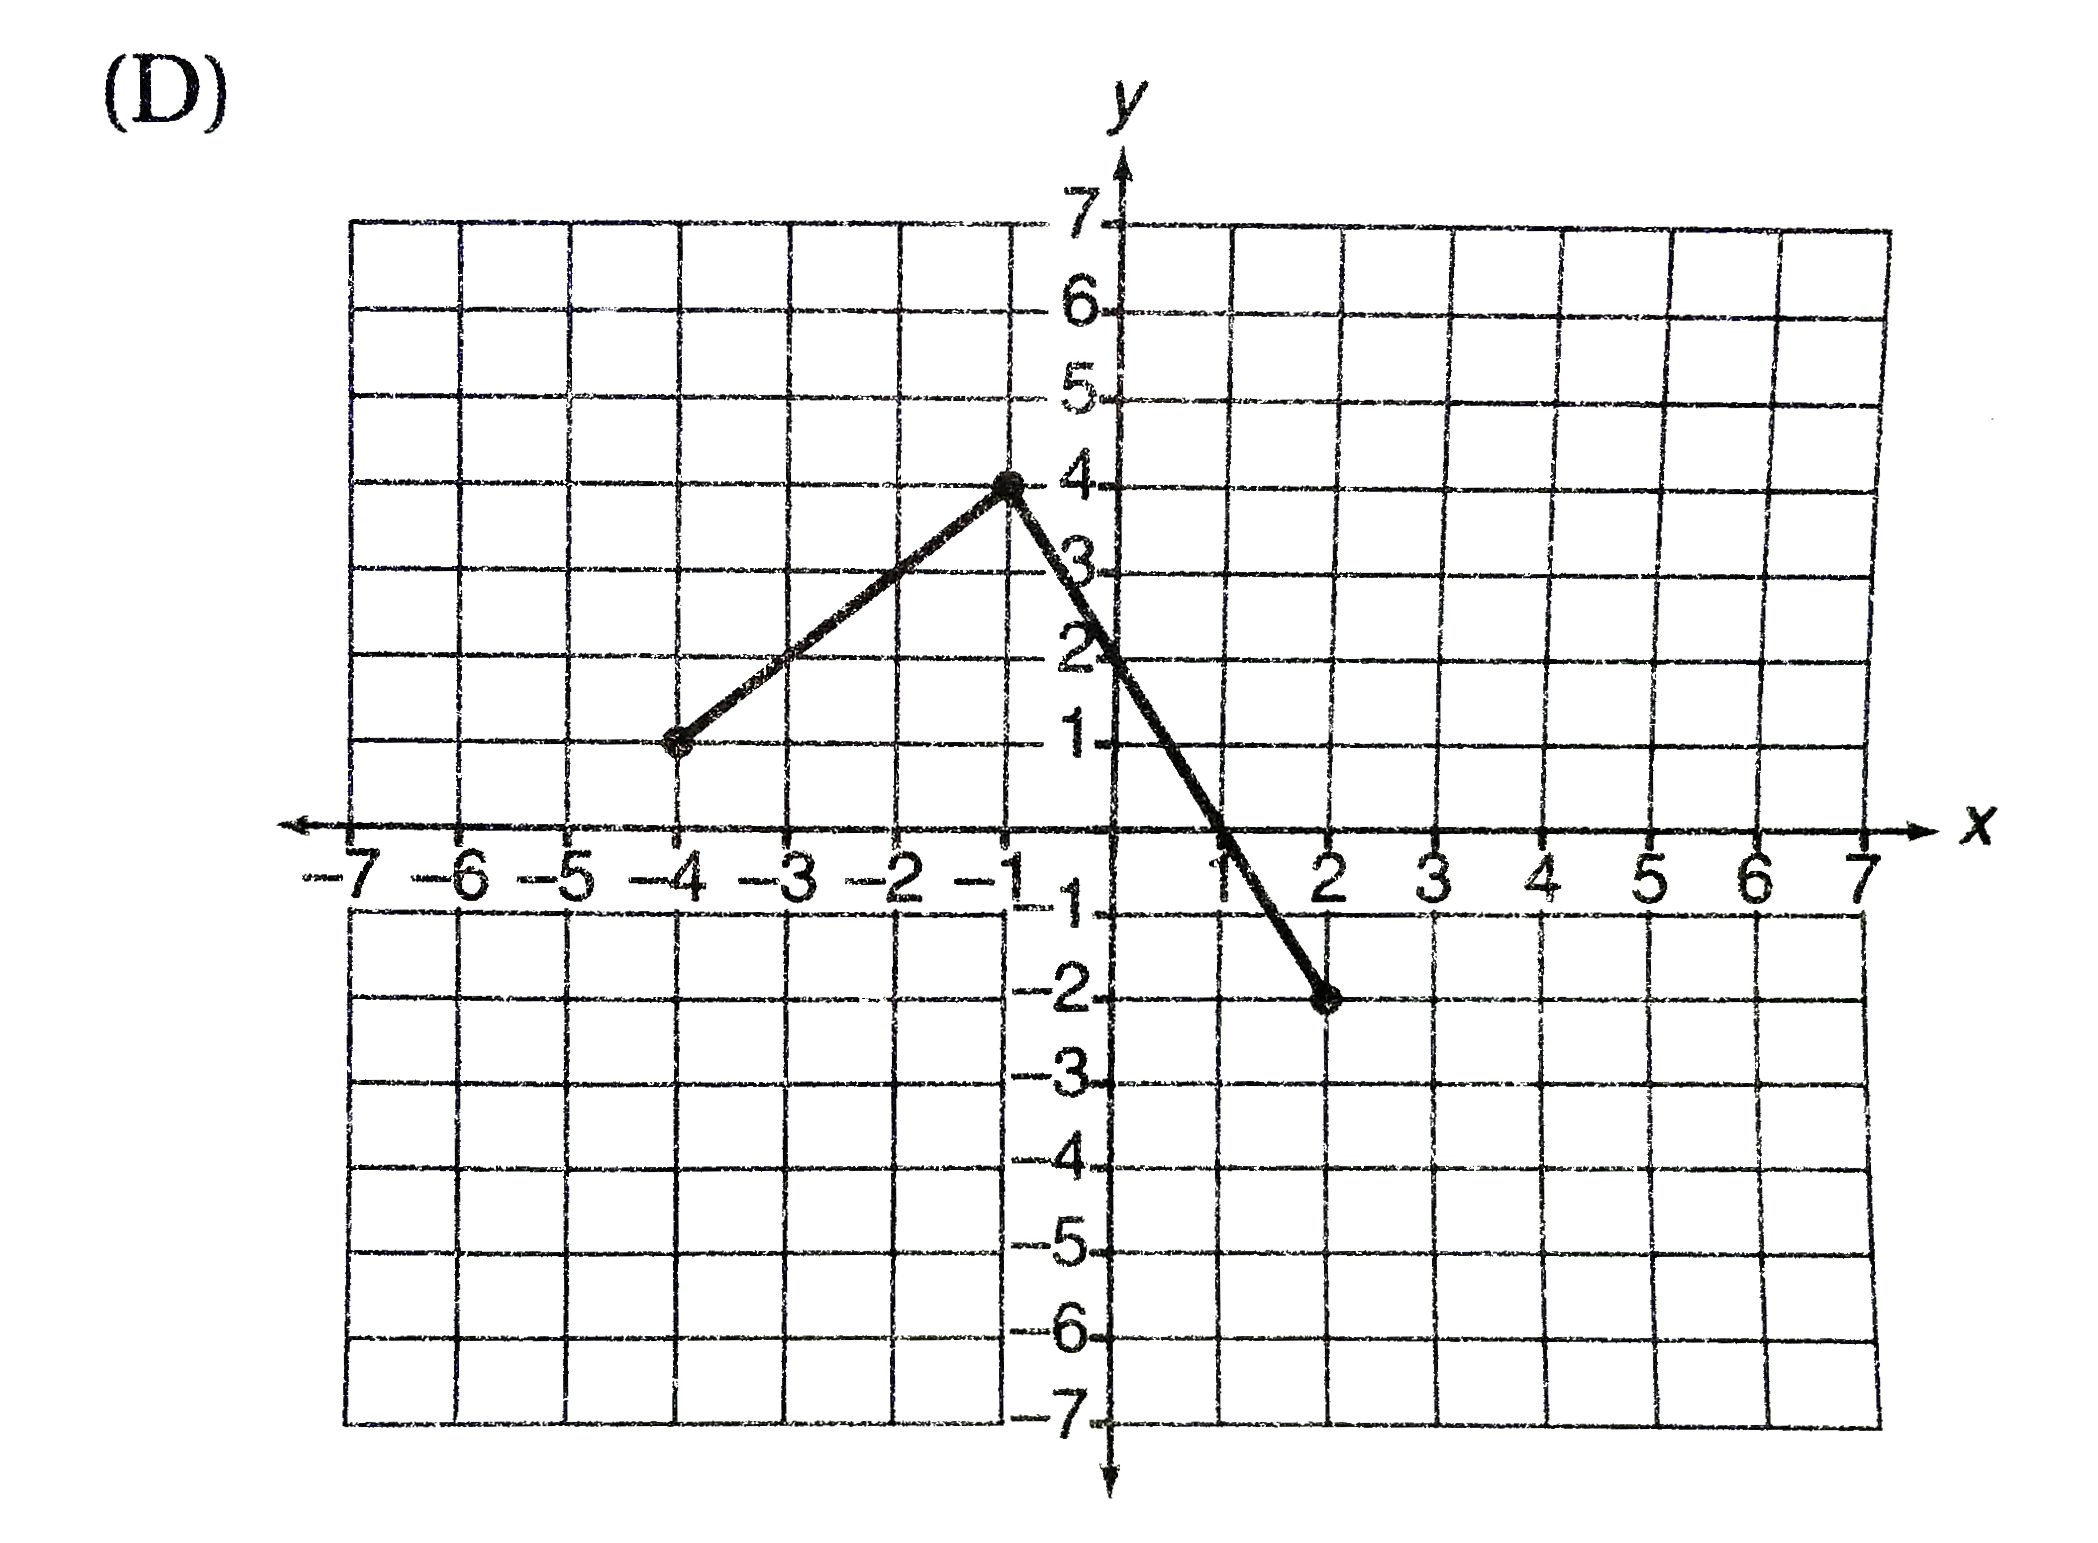
The number of bactria in a colony is estimated over the course of 9 days, as shown in the table below.
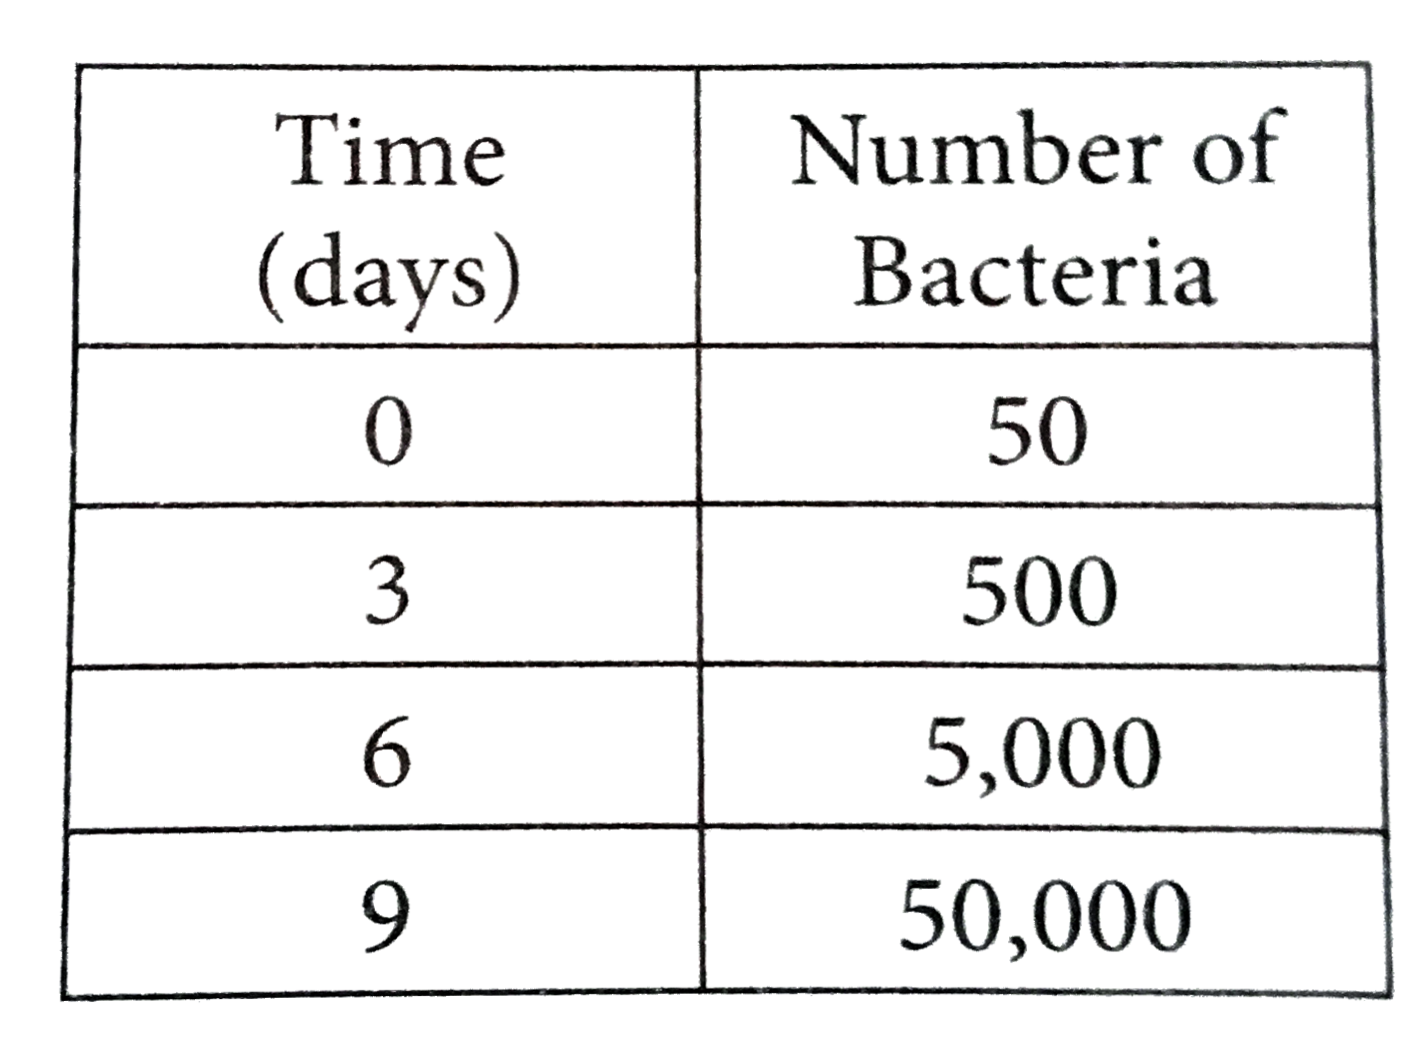
Which of the following best describes the relationship between time and the estimated number of bacteria over these 9 days?ALinear decreaseBLinear increaseCExponential decayDExponential growth
The criteria for classification are changing over time. Why?
View SolutionWhich of the following measures can be used to control over population?
View SolutionAnnelids which shows colour changes during movement
View SolutionWhich elements in the periodic table show a diagonal relationship ?
View Solution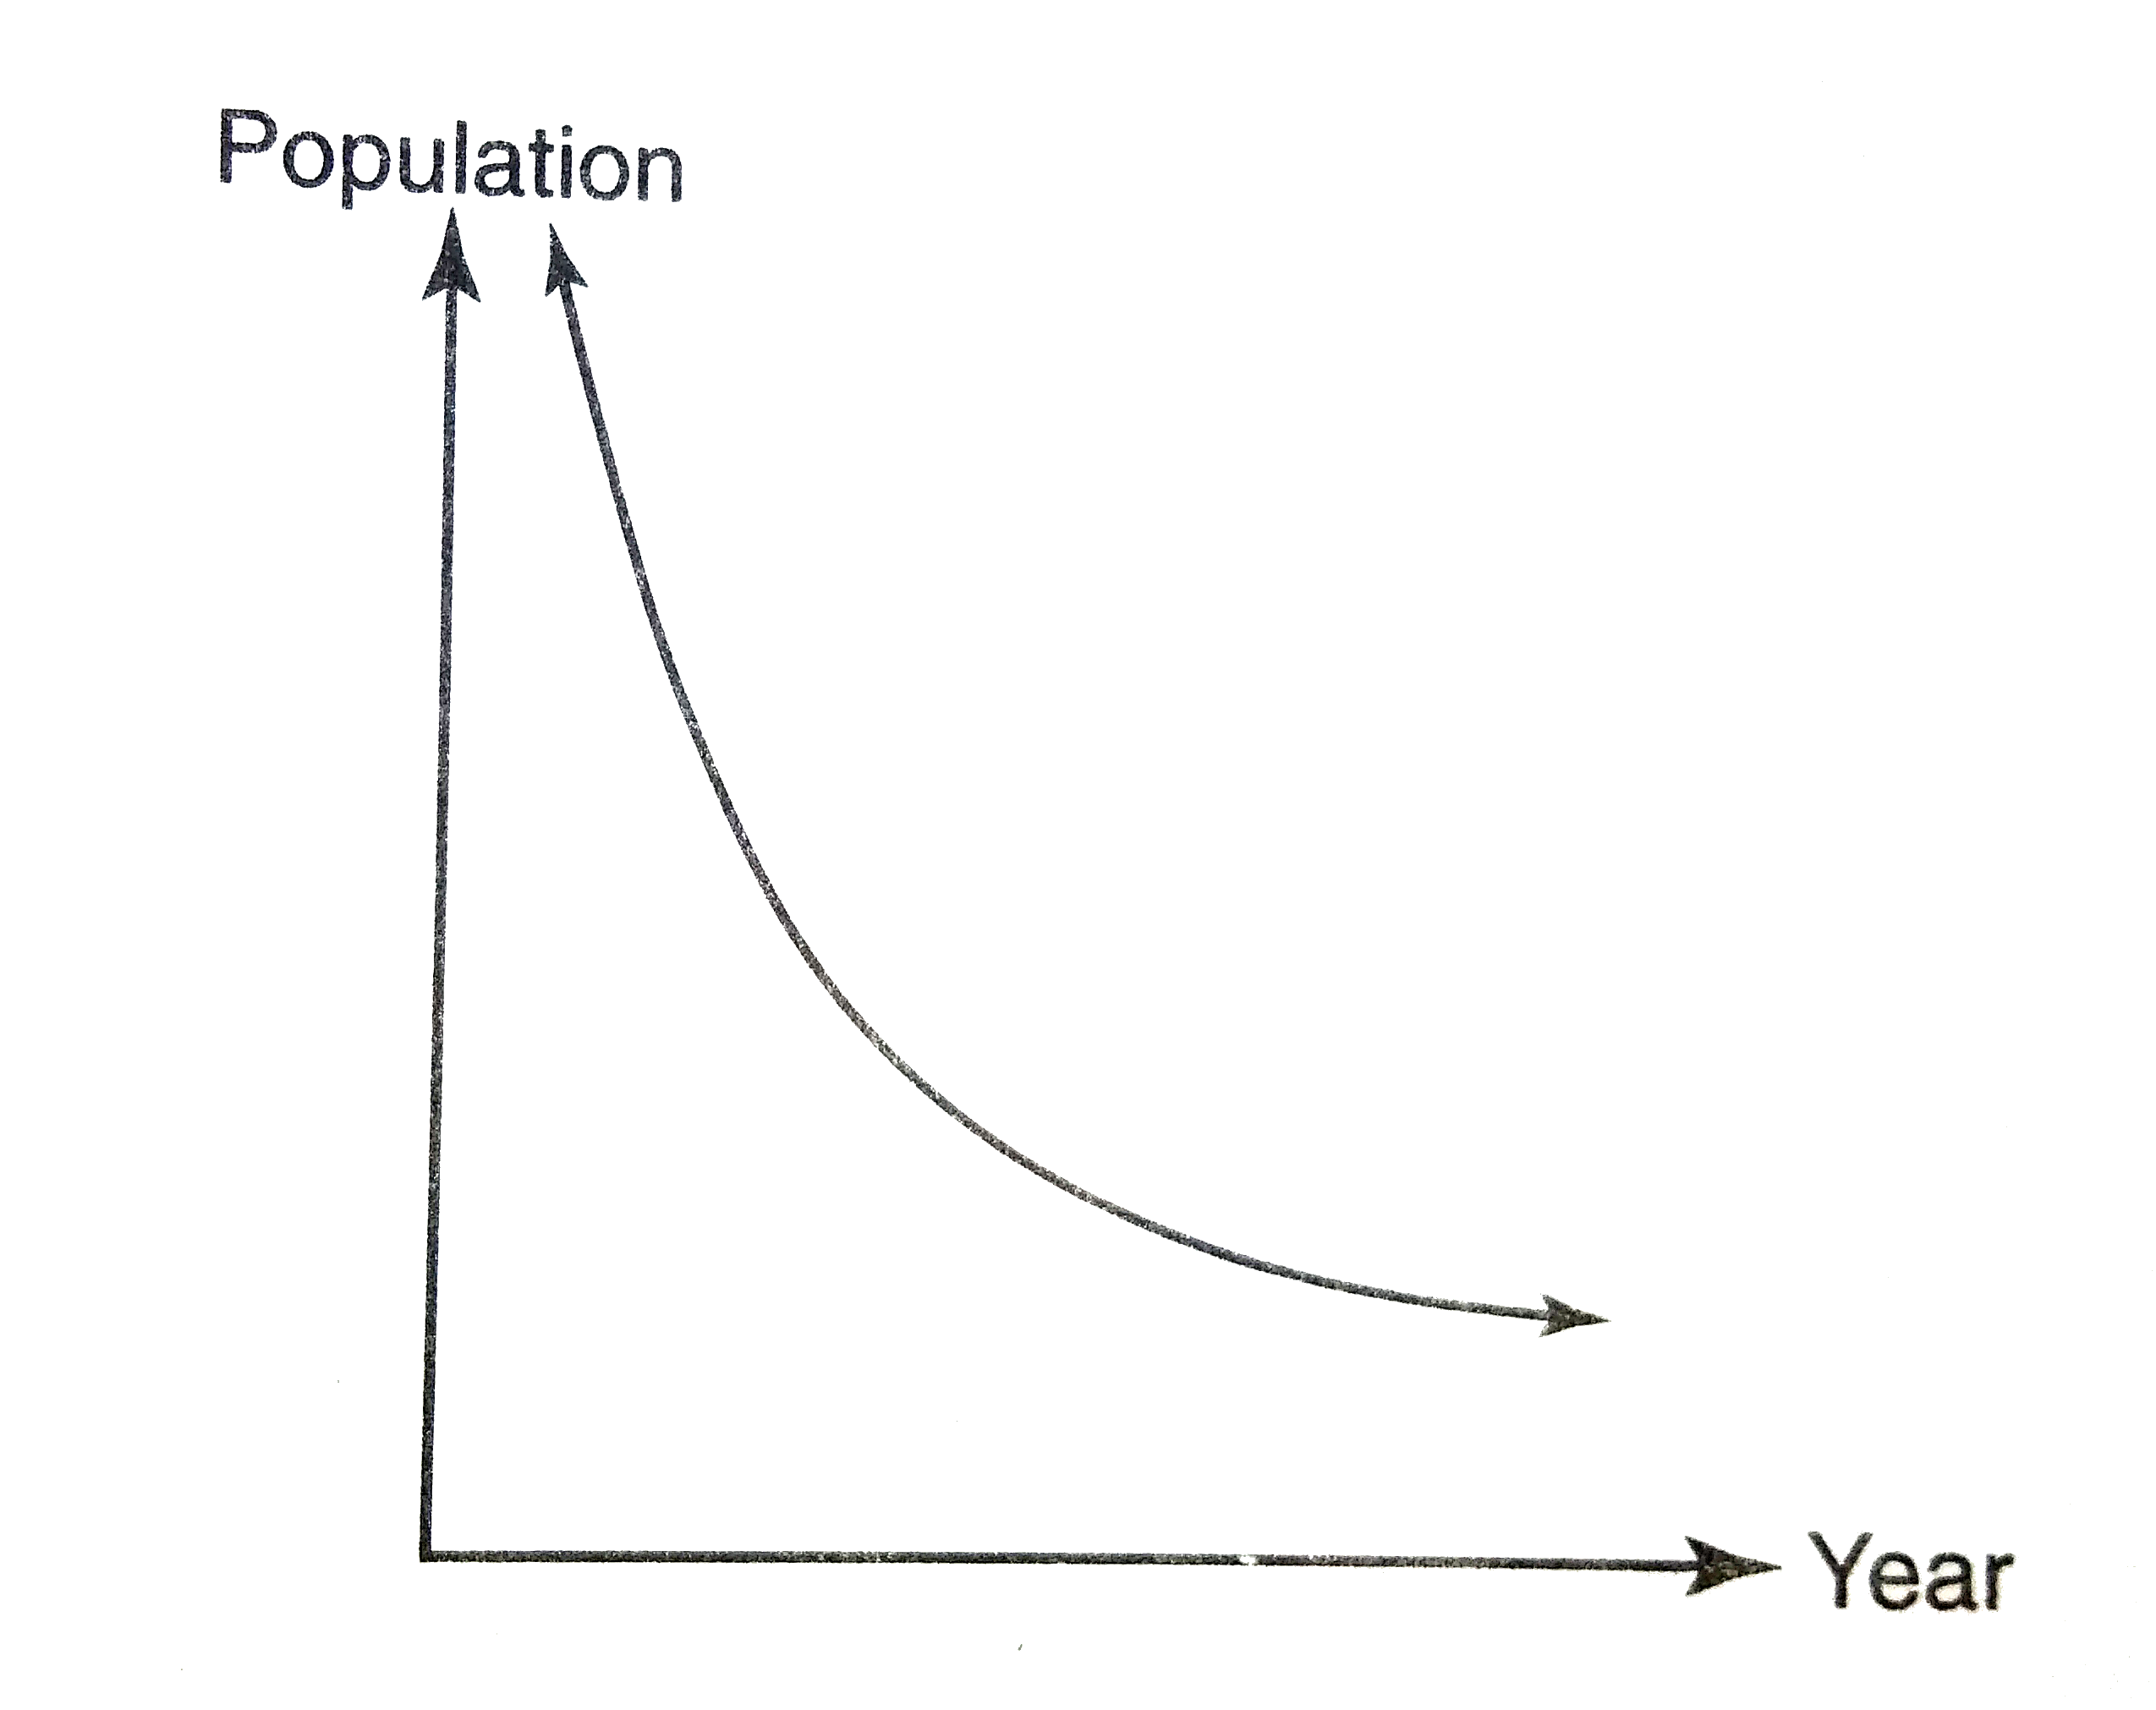
The graph above shows how the size of a country's population has changed over time. Which of the following are the most likely underlying reasons for the type of graph shown?
View Solution

