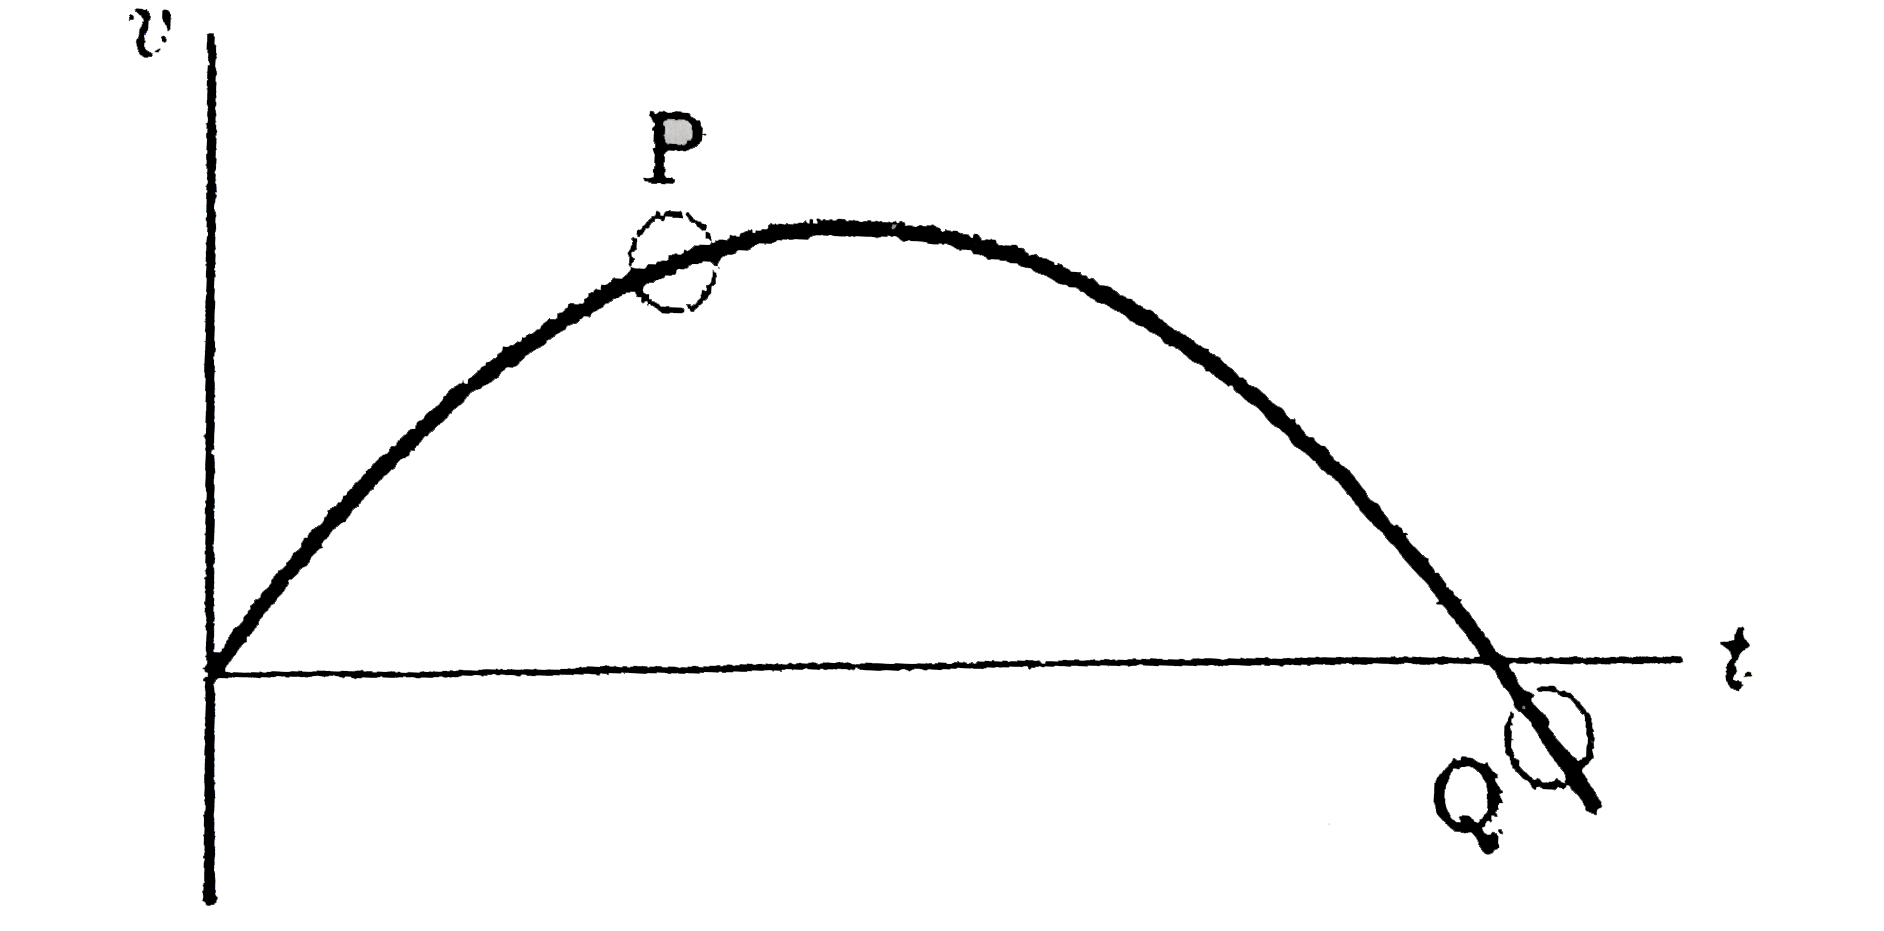
The velocity- time graph of car moving on a straight track is given below. The car weight 1000kg.
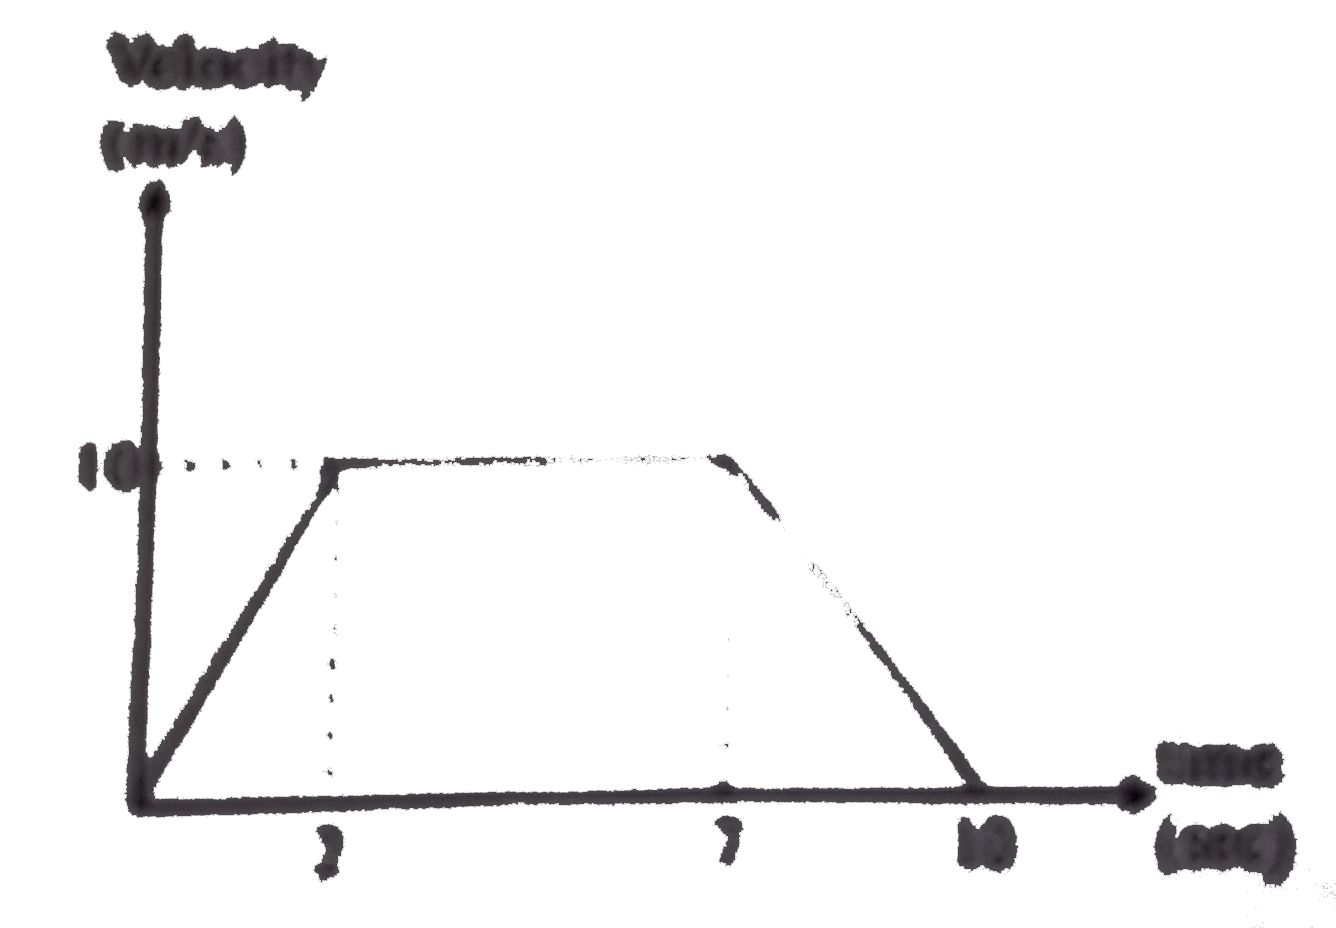 The distance travelled by the car during the whole motion is:
50m
75m
100m
150m
The correct Answer is:B
Distance travelled by the car in 10 second and it is same as area under the v-t curve.
Hence(B)
Topper's Solved these Questions
- MASTER PRACTICE PROBLEMBook:BANSALChapter:MASTER PRACTICE PROBLEMExercise:Reasoning
Explore 75 Videos
- MASTER PRACTICE PROBLEMBook:BANSALChapter:MASTER PRACTICE PROBLEMExercise:Multiple objective
Explore 131 Videos
- MASTER PRACTICE PROBLEMBook:BANSALChapter:MASTER PRACTICE PROBLEMExercise:Additional topic
Explore 70 Videos
- FLUID MECHANICSBook:BANSALChapter:FLUID MECHANICSExercise:PYQS AIEEE
Explore 10 Videos
- SEMICONDUCTORSBook:BANSALChapter:SEMICONDUCTORSExercise:CBSE Question
Explore 32 Videos
Similar Questions
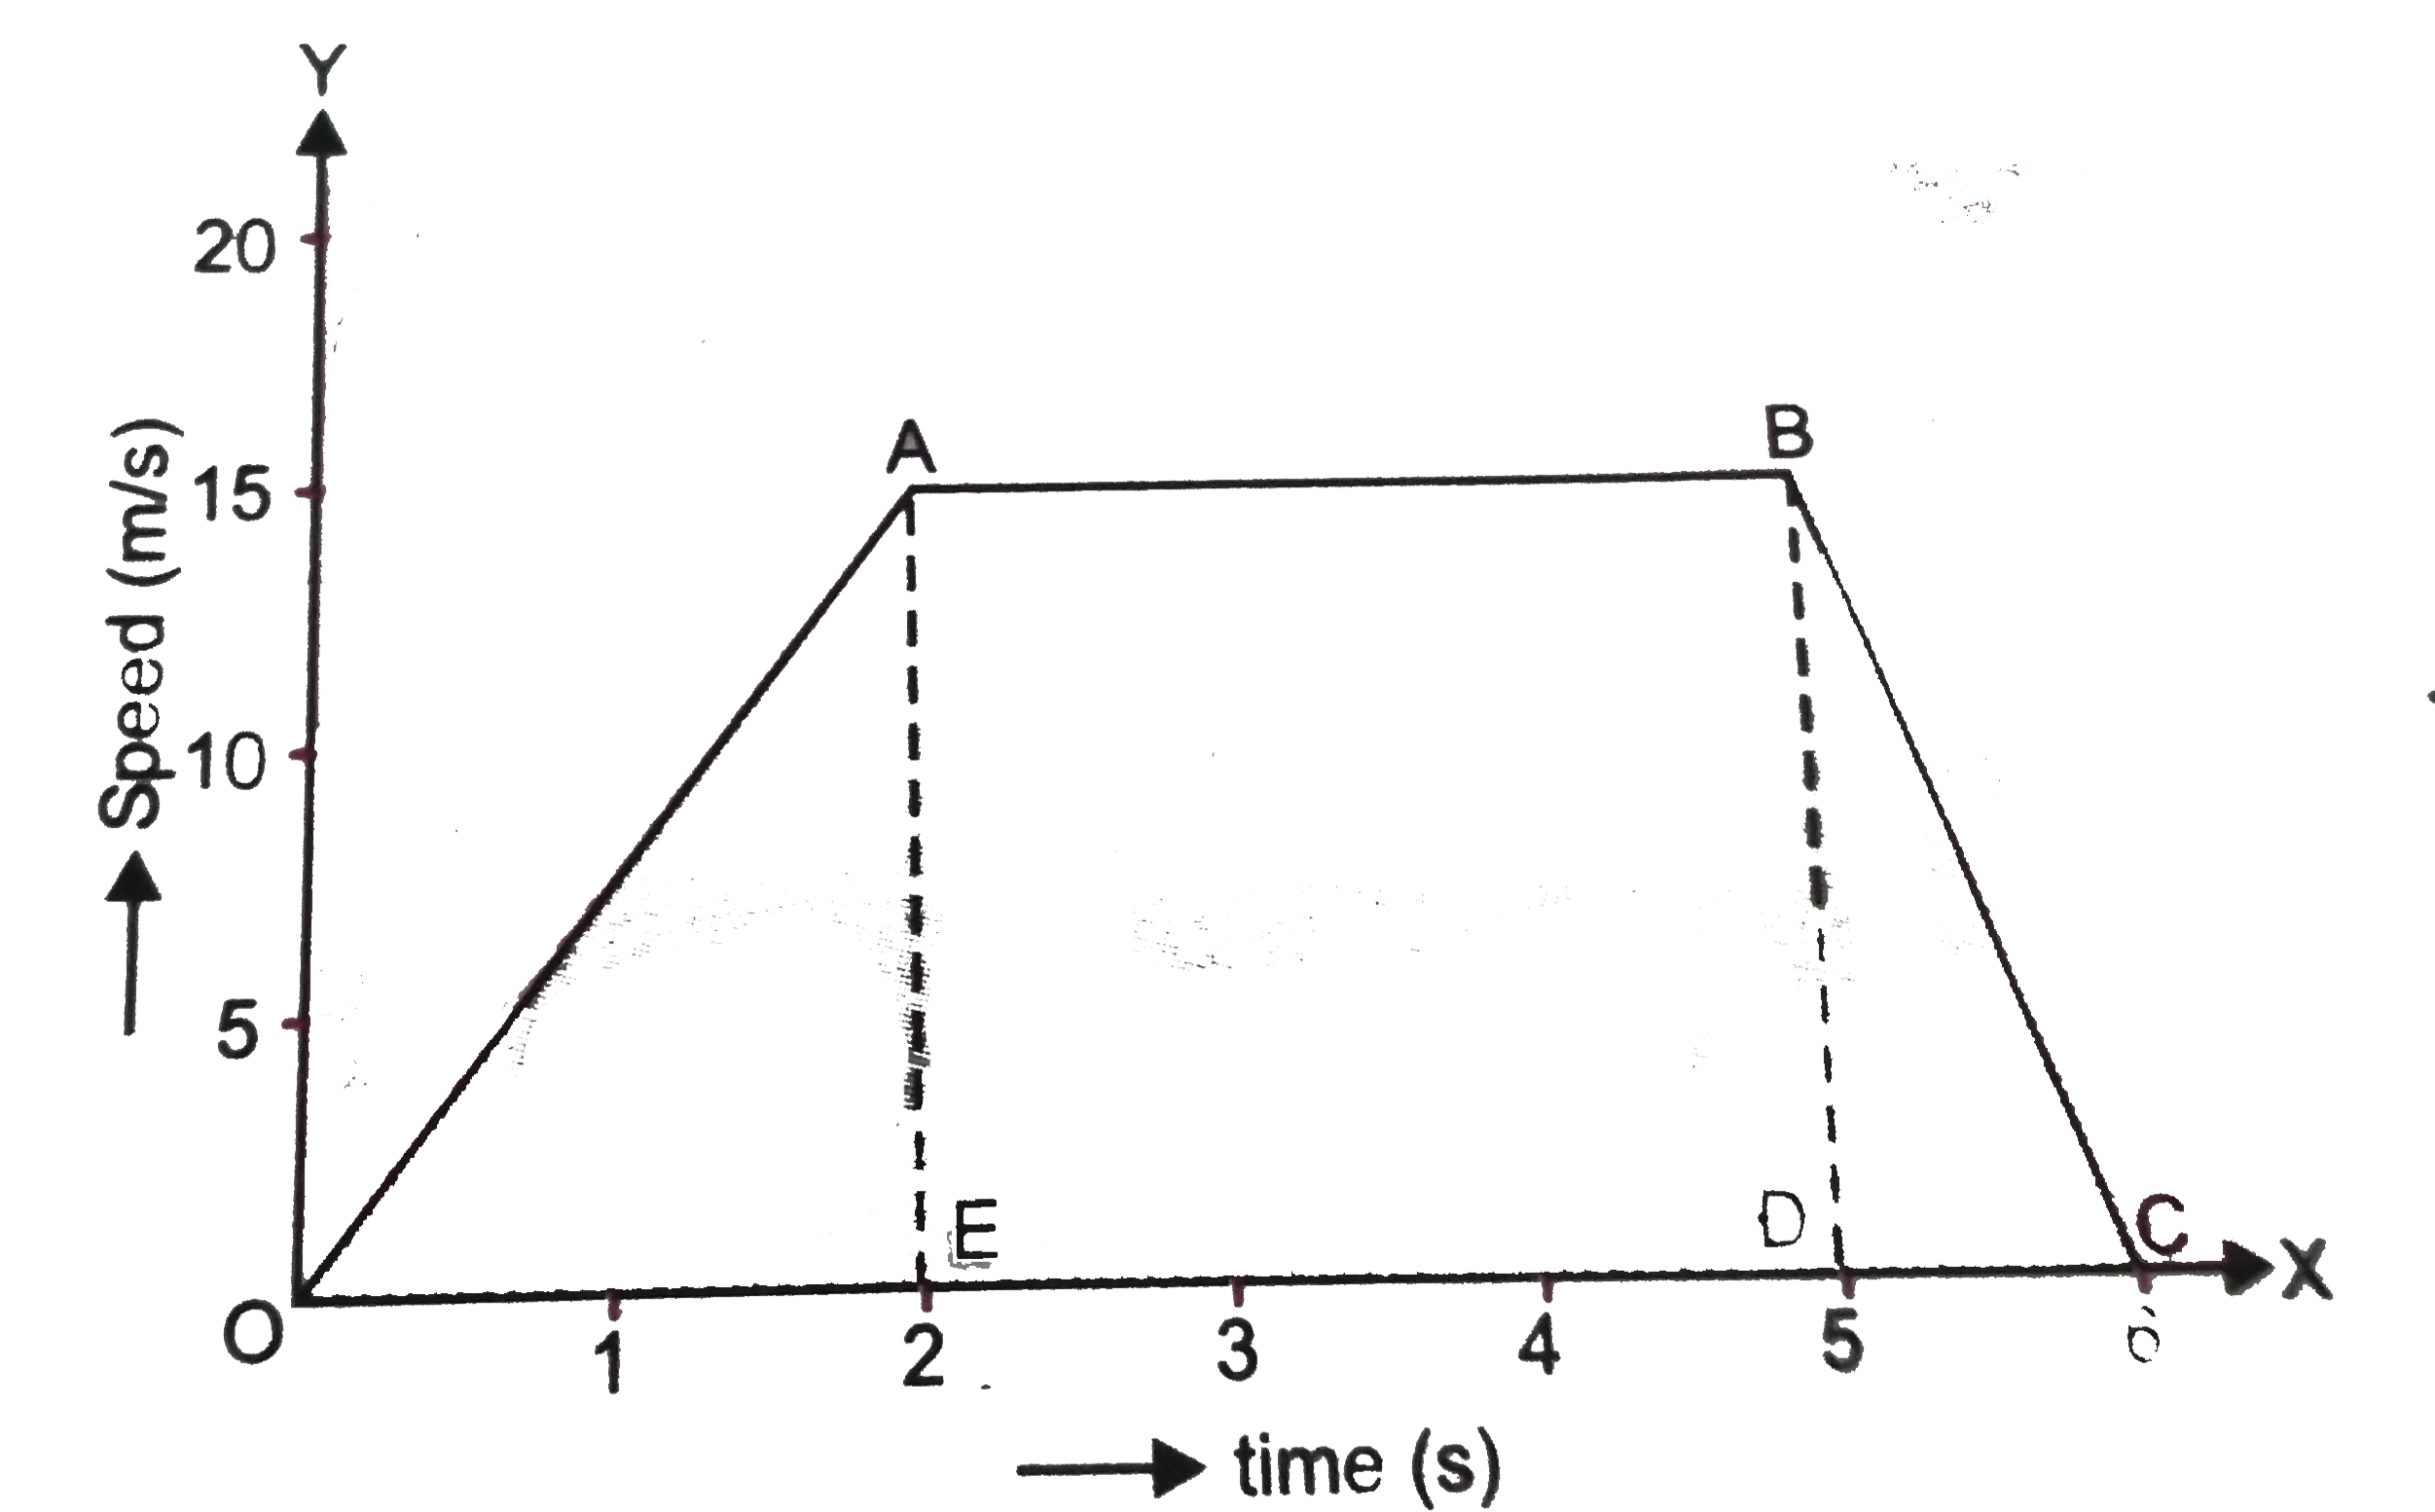
The speed- time graph of a car is given in (figure) The car weights 1000kg
(a) What is the distance travelled by the car in first two seconds?
(b) What is the braking force applied at the end of 5seconds to bring the car to a stop within one second?
View SolutionThe speed- time graph of a car is given in (figure) The car weights 1000kg
(a) What is the distance travelled by the car in first two seconds?
(b) What is the braking force applied at the end of 5seconds to bring the car to a stop within one second?

View Solution
Knowledge Check
The velocity- time graph of car moving on a straight track is given below. The car weight 1000kg.
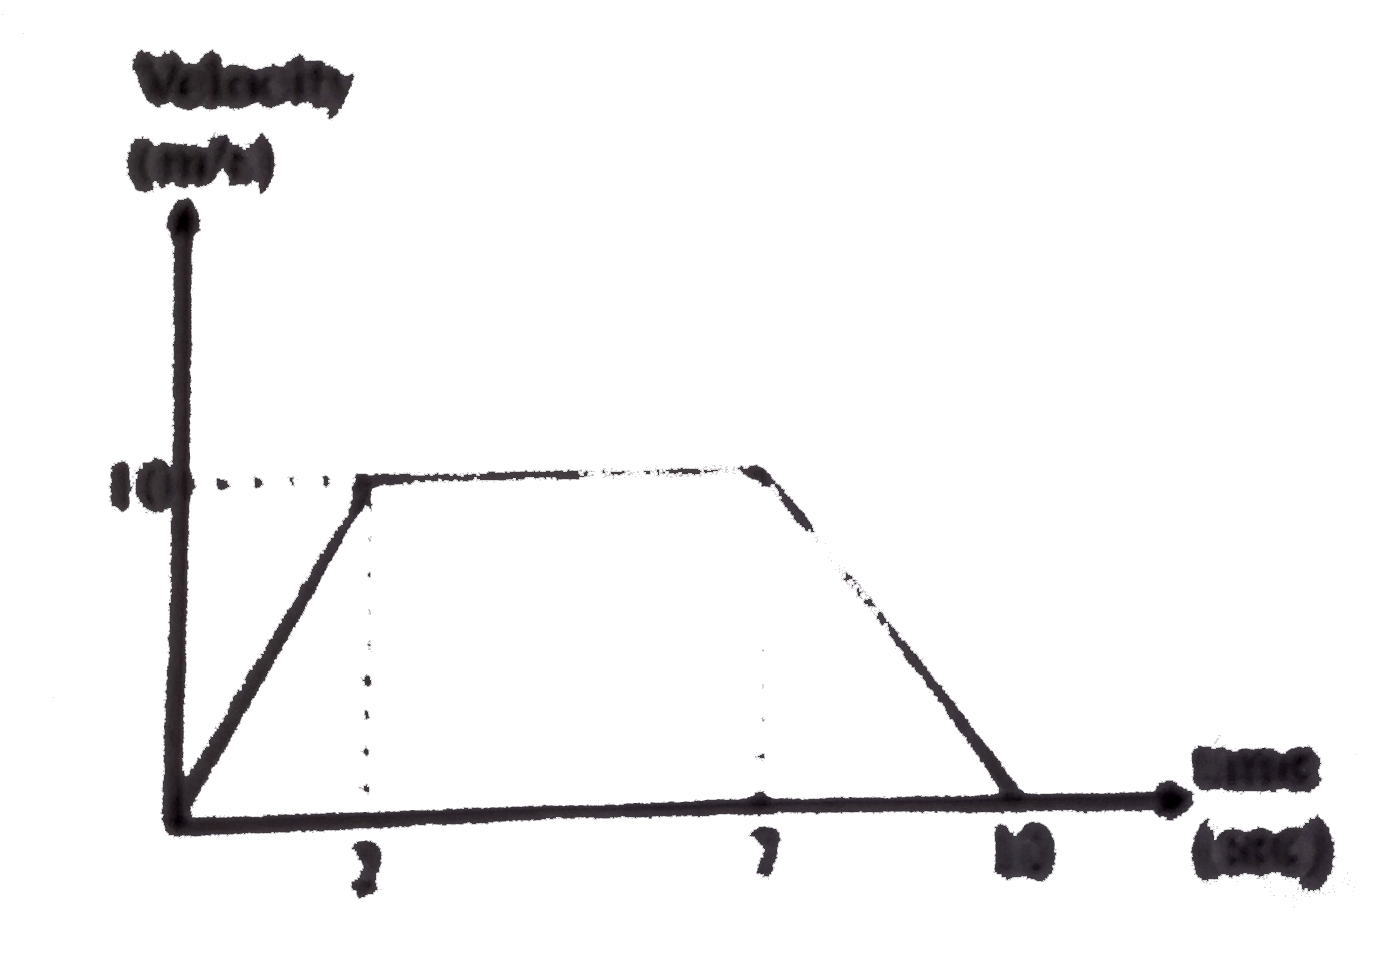 The braking force rewquired to boring the car to a stop with in one second from the maximum speed is:A100003NB5000NC10000ND50003N
The velocity- time graph of car moving on a straight track is given below. The car weight 1000kg.
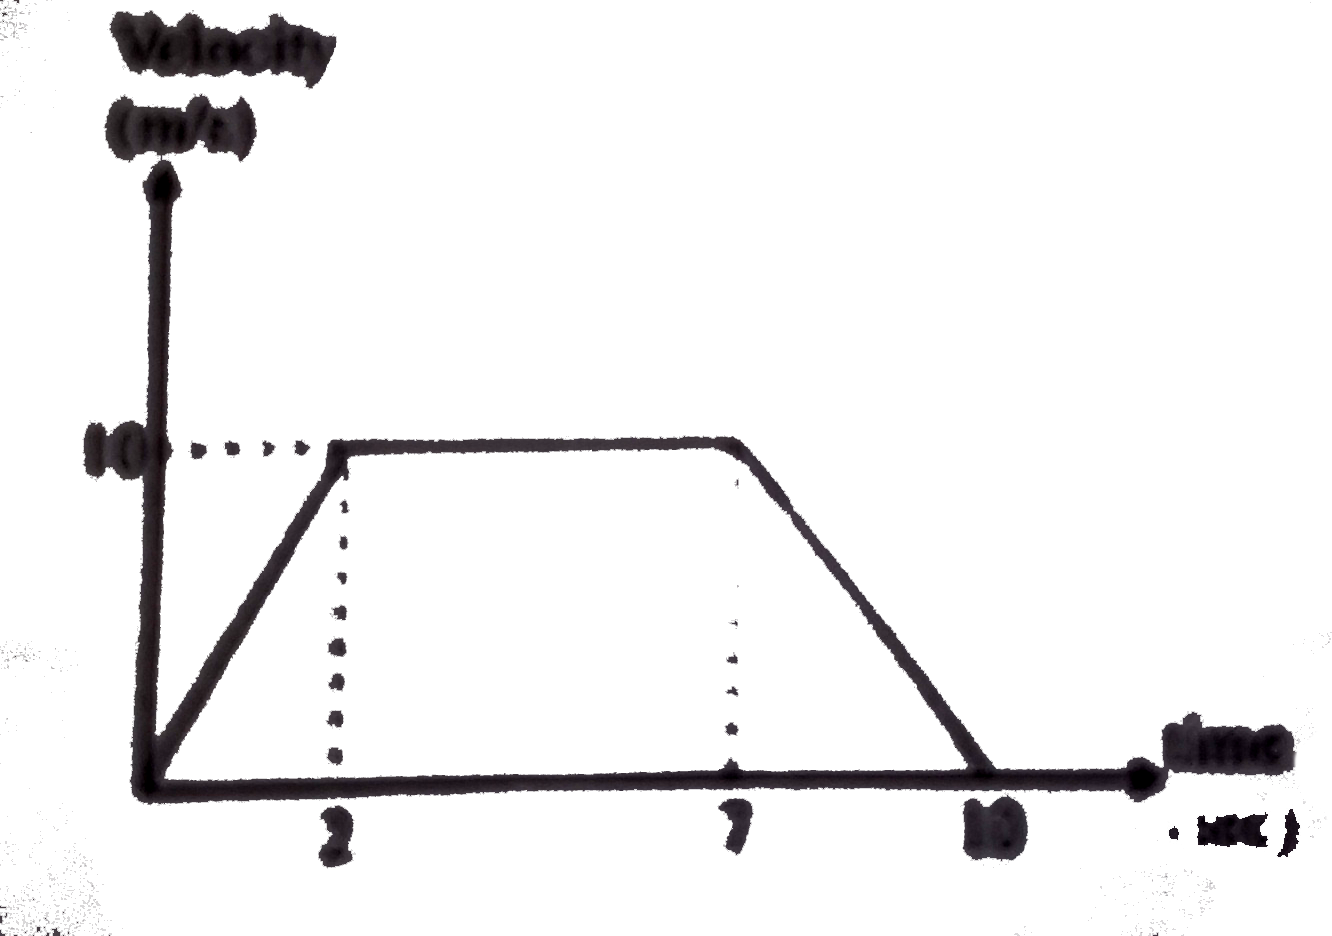 correct acceleration-time graph representing the motion of car is:A
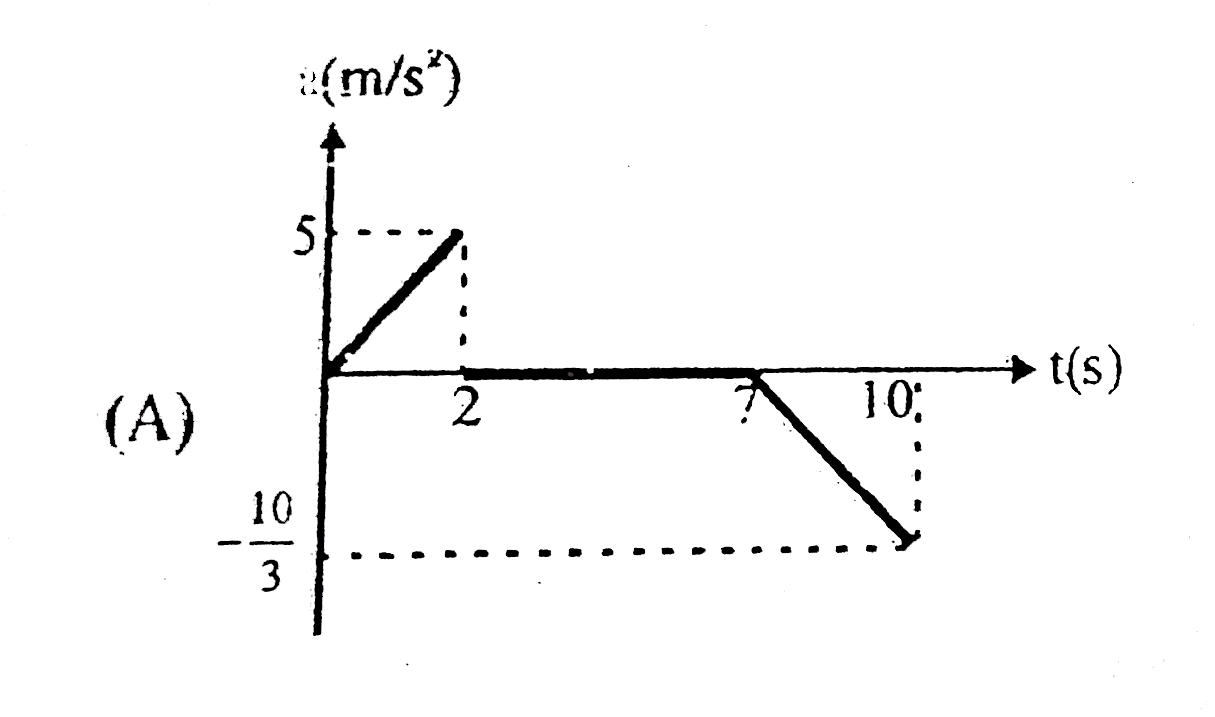 B
B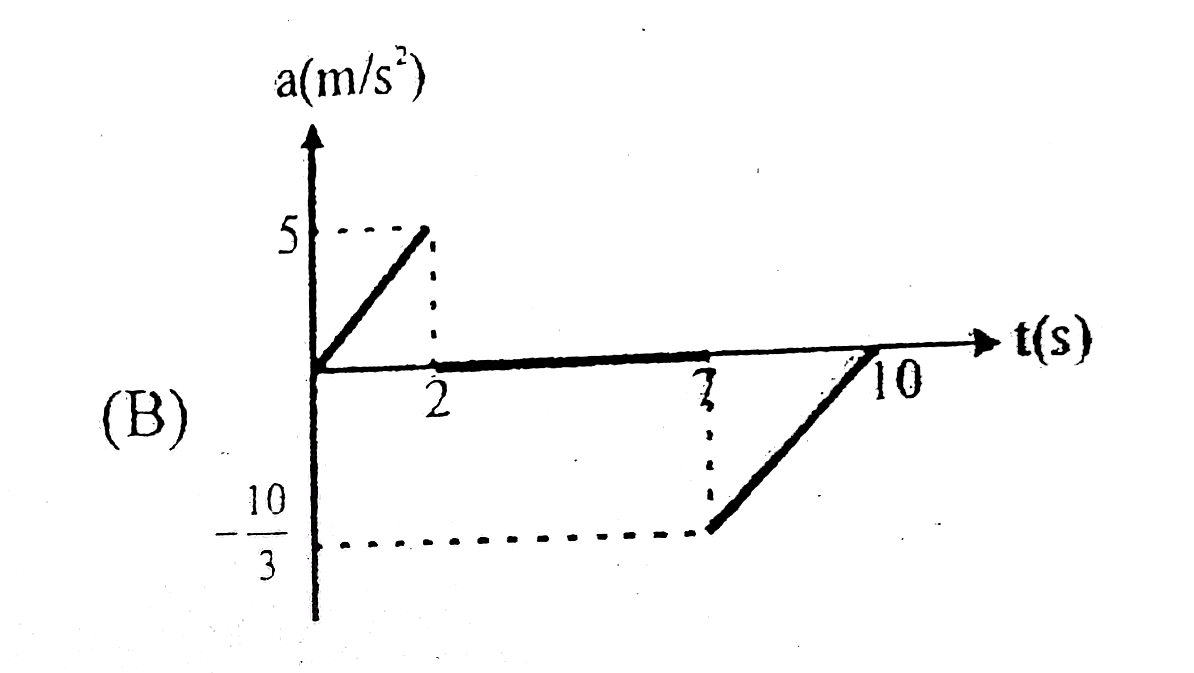 C
C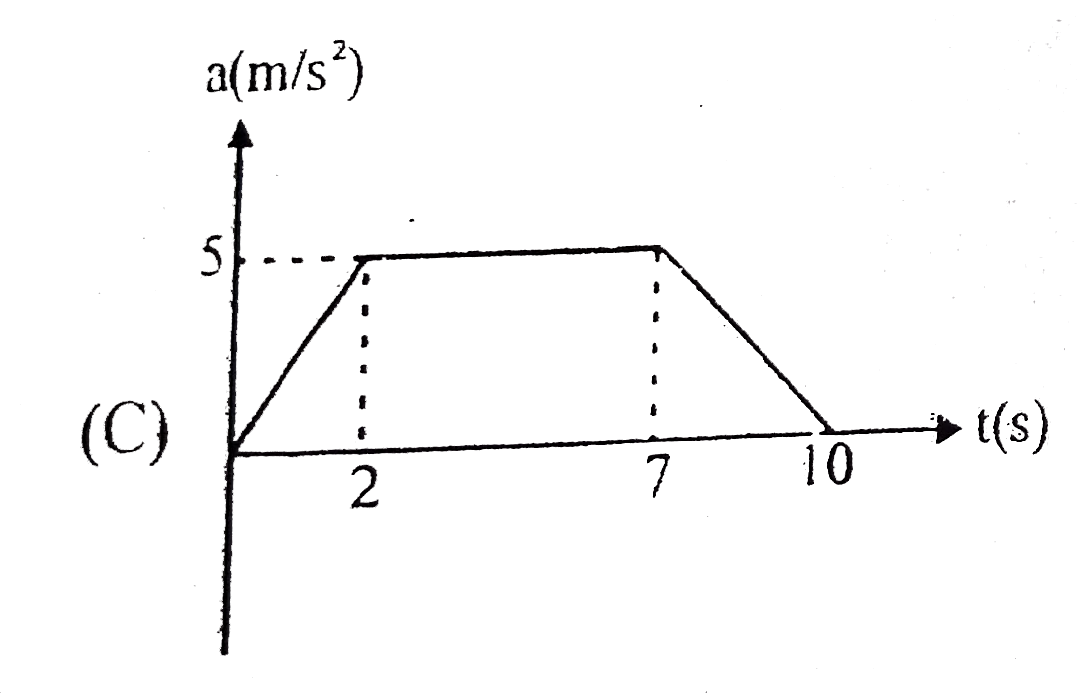 D
D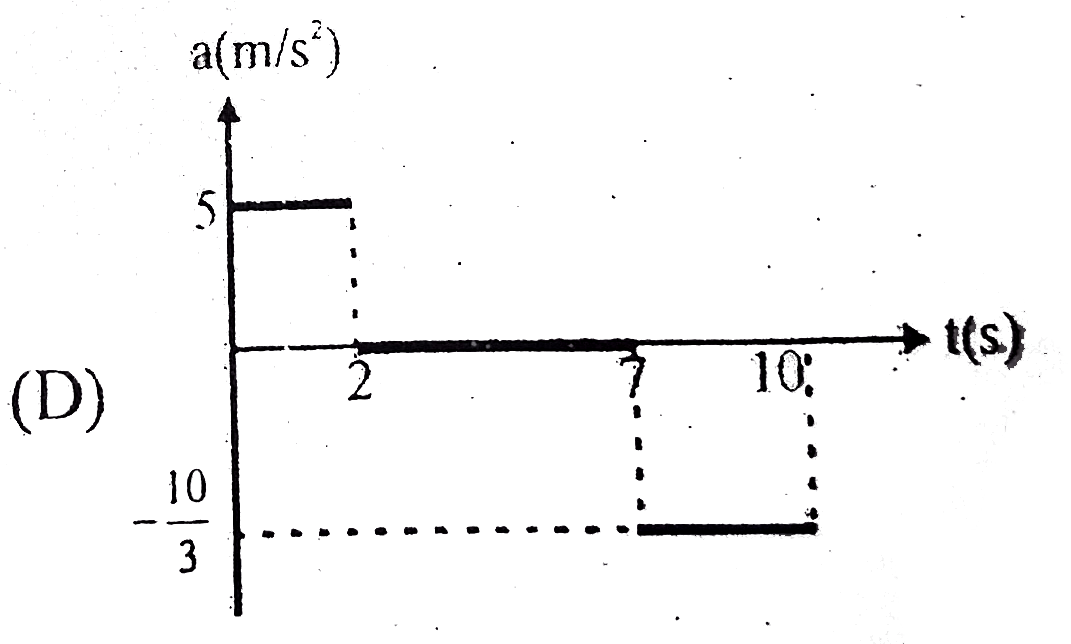
The velocity time graph of the motion of a car is given here.
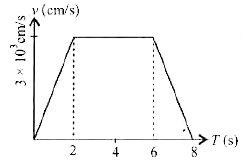 AThe distance travelled by the car in the first six seconds is 150 m.BThe deceleration of the car during the last two seconds are −15ms2.CThe distance travelled by the car in the first six second is 220 m.DThe deceleration of the car during the last two second is −20ms2
The velocity-time graphsof a car and a scooter are shown in the figure. (i) The difference between the distance travelled by the car and the scooter in 15 and (ii) the time at which the car will catch up with the scooter are, respectively.
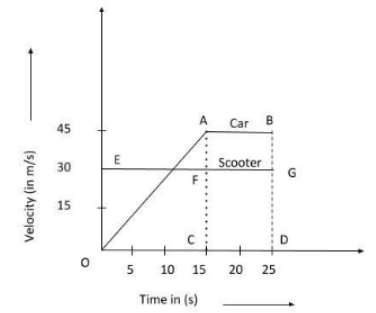
View SolutionThe velocity-time graph of a car moving along a straight road is shown in figure. The average velocity of the car is first 25 seconds is
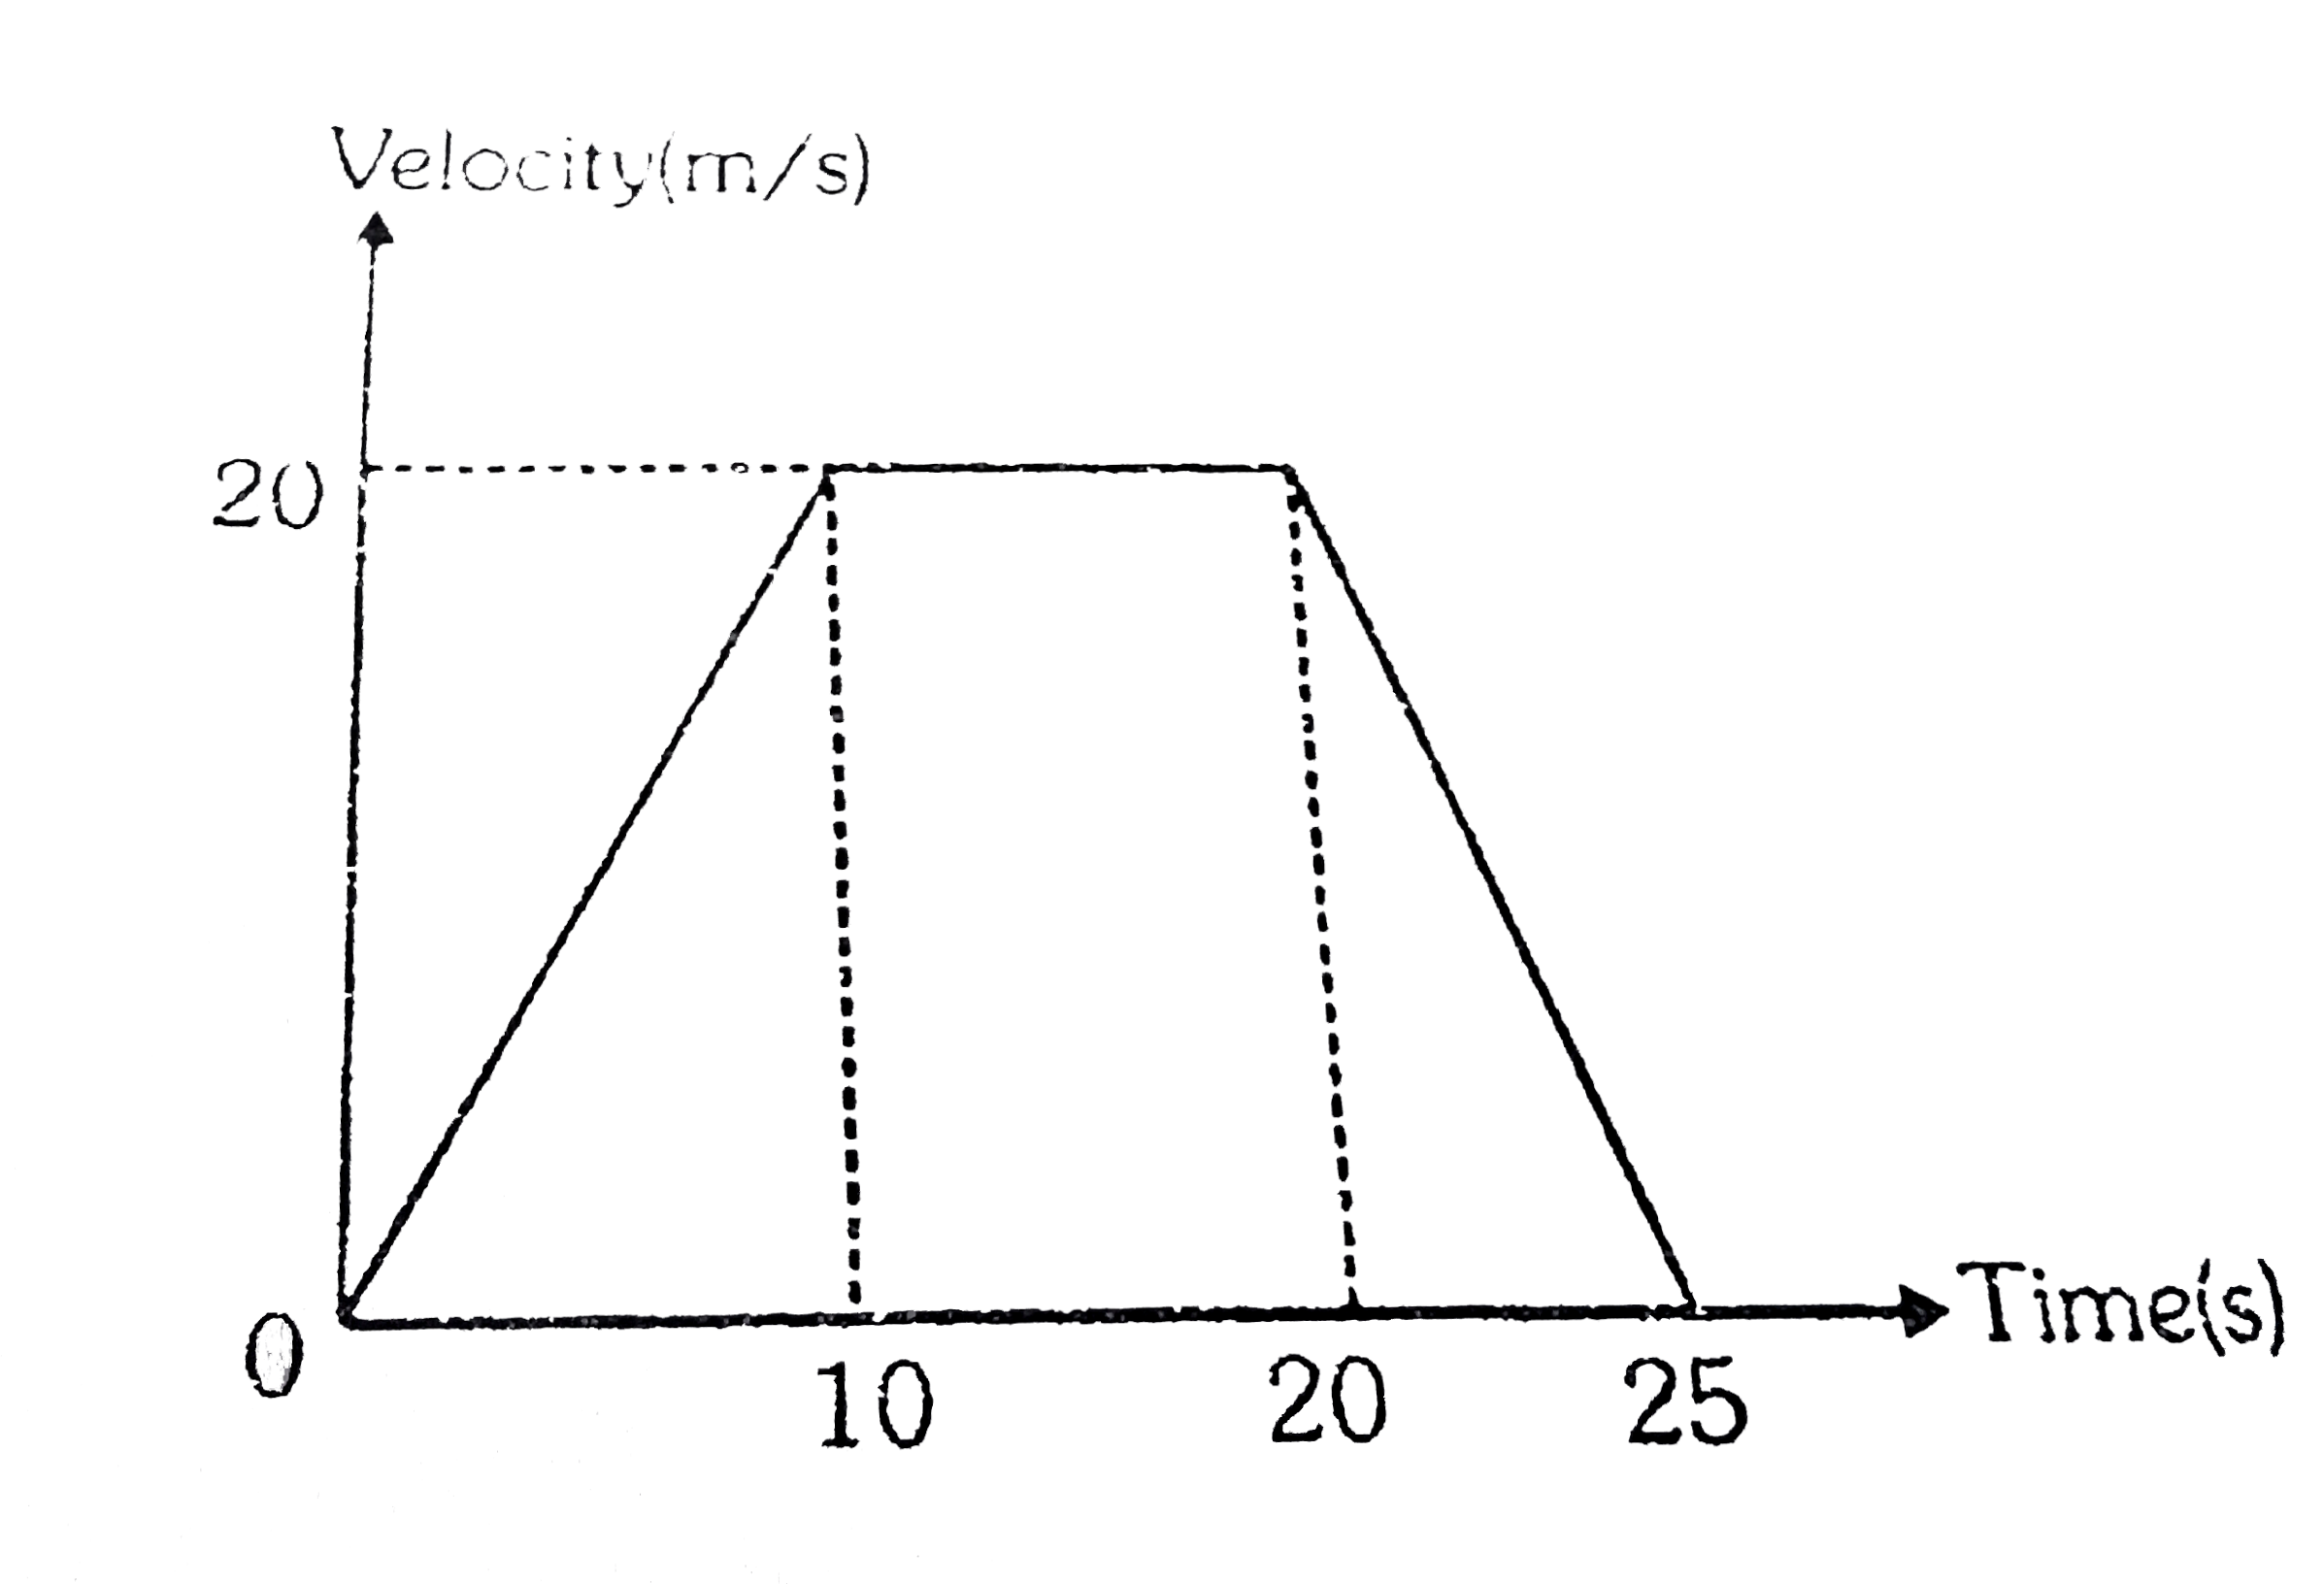
View SolutionThe velocity-time graph of a car moving along a straight road is shown in figure. The average velocity of the car in first 25 seconds is
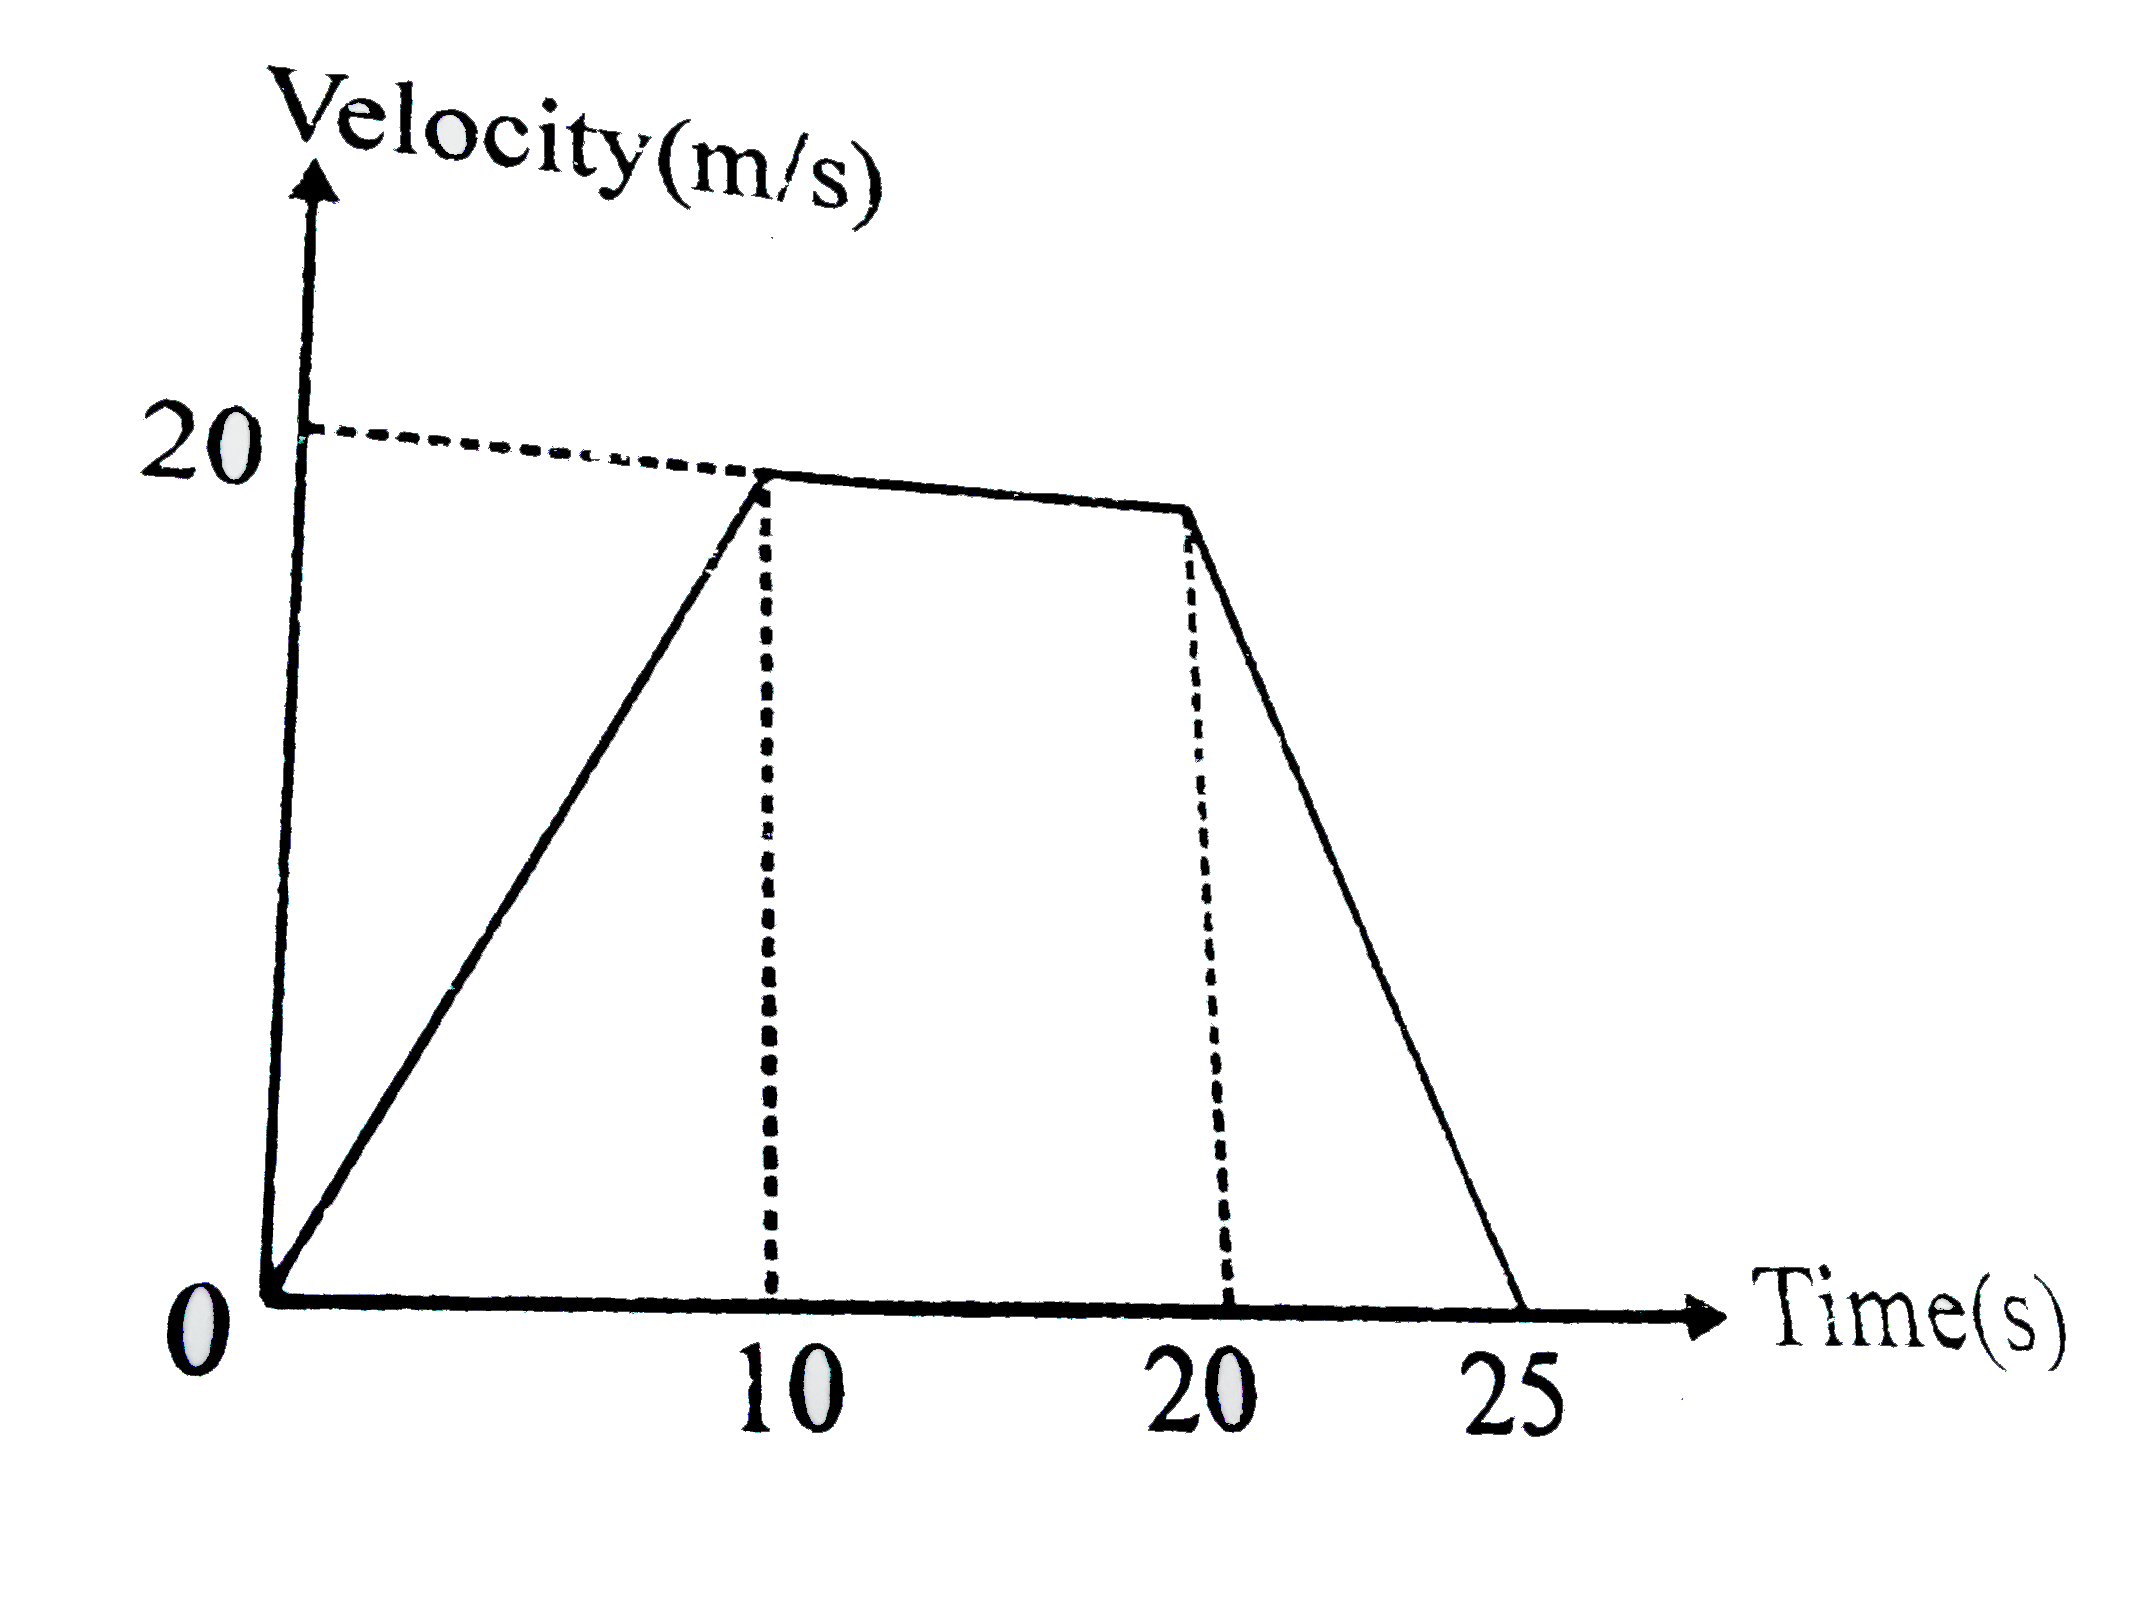
View SolutionThe diagram shows a velocity-time graph for a car moving in a straight line. At point Q the car must be
View SolutionThe distance x travelled by the car in above problem in time t is given by -
View Solution

