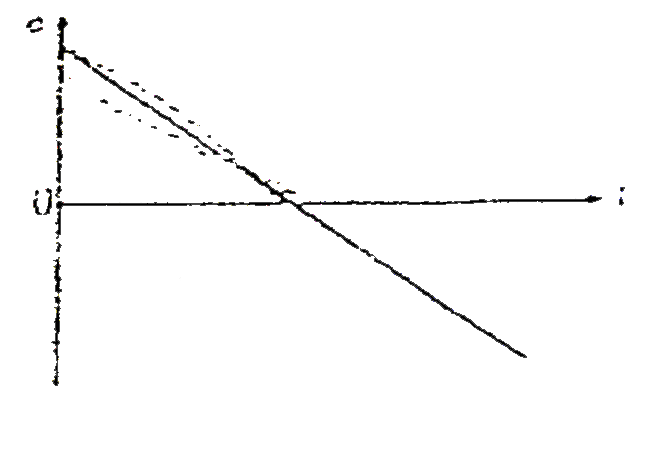
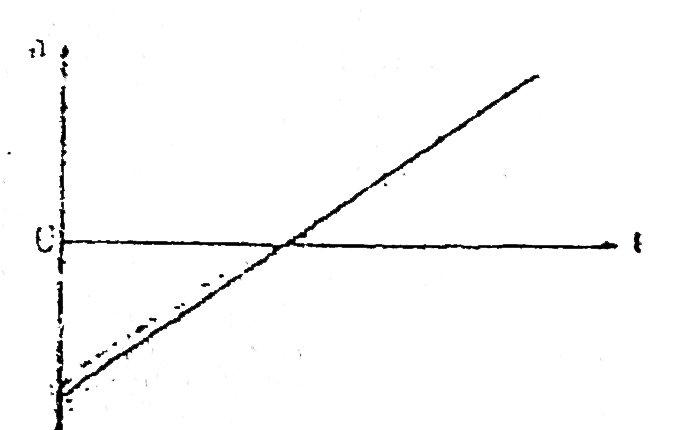
The graph shown the variation with times t of the velocity v of an object . Which one of the following graphs best represents the variation of acceleration a of the object with time t?



The correct Answer is:D
Ans. (4)
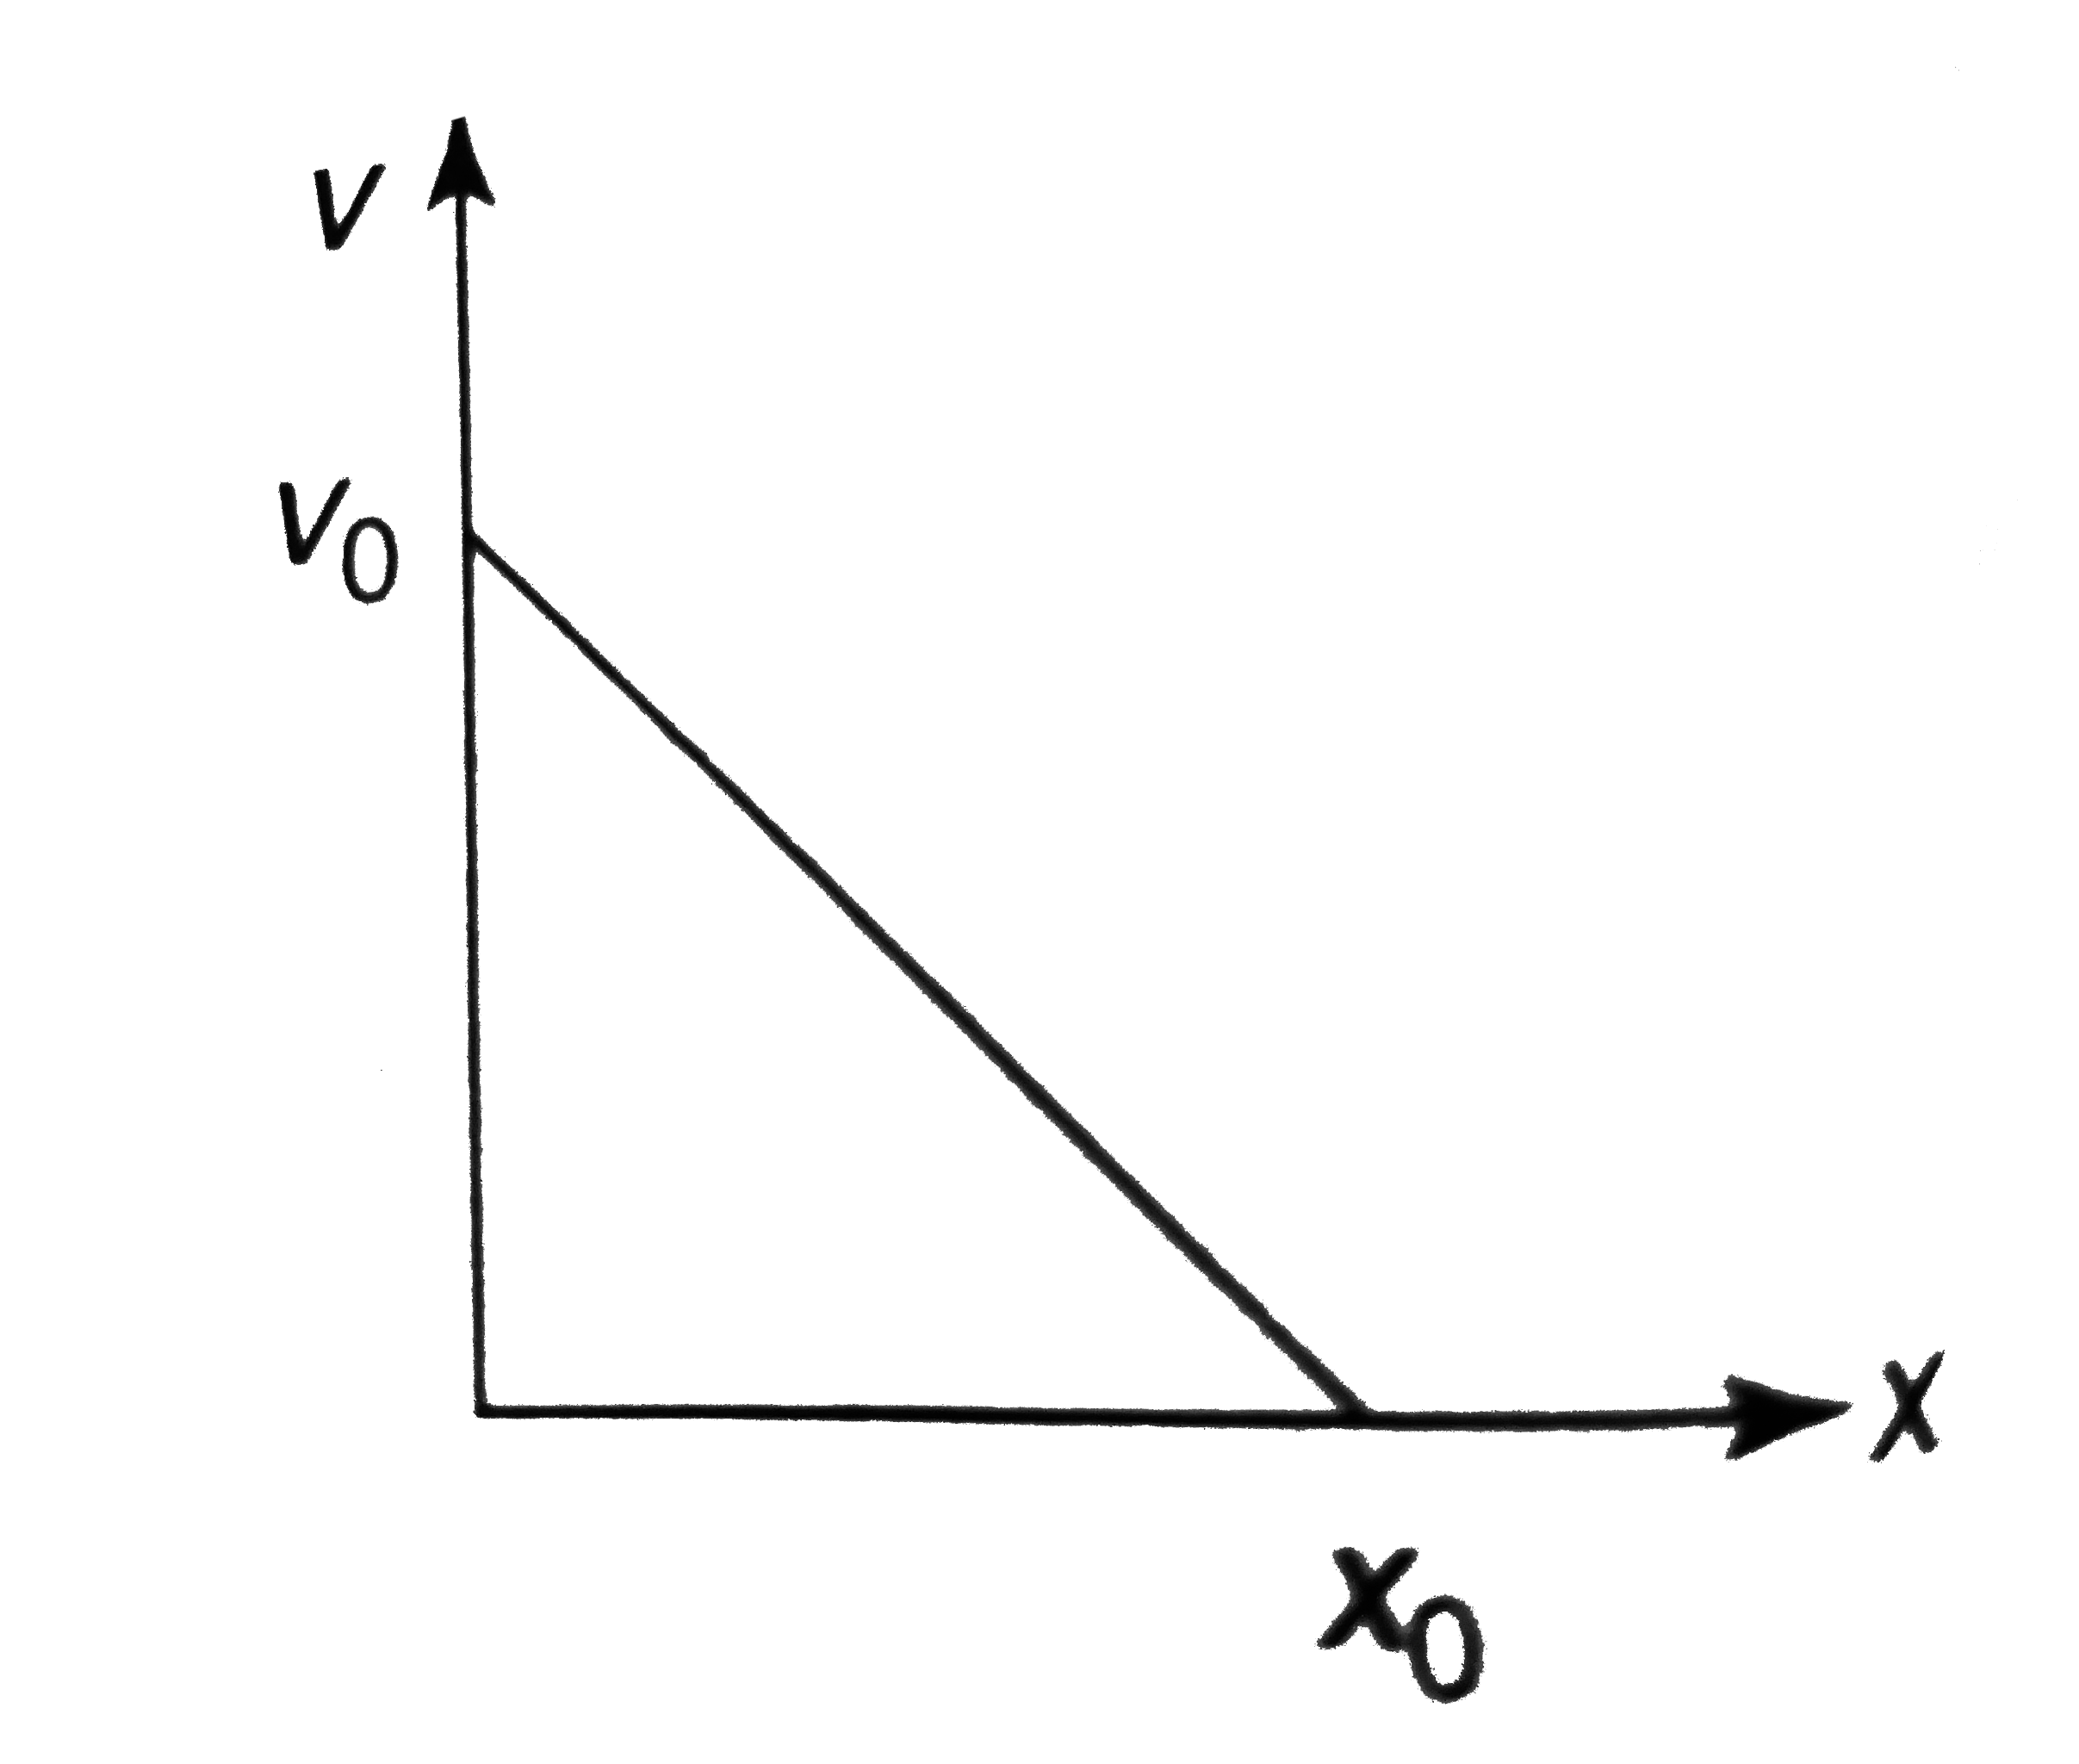
Acceleration a=dvdt and slope of a parabolic curve is a straight line.
Topper's Solved these Questions
- TEST PAPERBook:ALLENChapter:TEST PAPERExercise:PHYSICS
Explore 4 Videos
- TEST PAPERBook:ALLENChapter:TEST PAPERExercise:PHYSICS
Explore 4 Videos
- SIMPLE HARMONIC MOTIONBook:ALLENChapter:SIMPLE HARMONIC MOTIONExercise:Example
Explore 1 Video
- TEST PAPER 1Book:ALLENChapter:TEST PAPER 1Exercise:PHYSICS
Explore 11 Videos
Similar Questions
A body is acted upon by a constant force fromtime t=0 to a time t=T after which it does not experience any force. Which of the following graphs best represents the variation of the velocity of the body with time ?
View Solutionwhich of the following graph represents the variation of resistivity (ρ) with temperature (T) for copper?
View Solution
Knowledge Check
Which of the following graphs best represents the variation of acceleration 'a' with displacement x?
A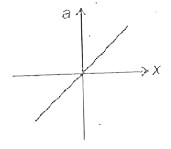 B
B C
C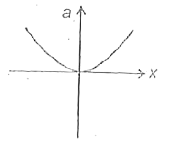 D
D
Which of the following graphs represents the variation of activity (A) of a radioactive substance with time (t).
A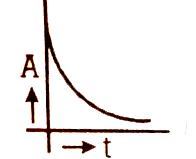 B
B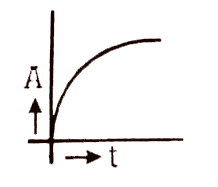 C
C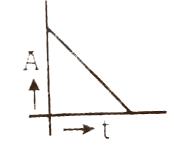 D
D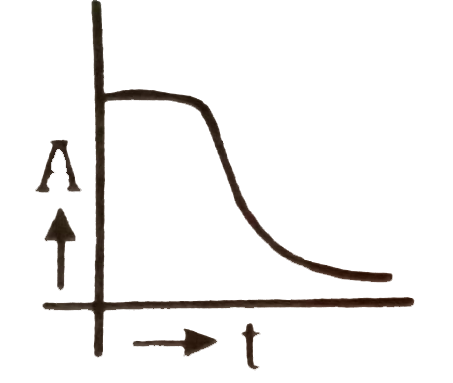
The given graph shows the variation of velocity with displacement. Which one of the graphs given below correctly represents the variation of acceleration with displacement ?
 A
A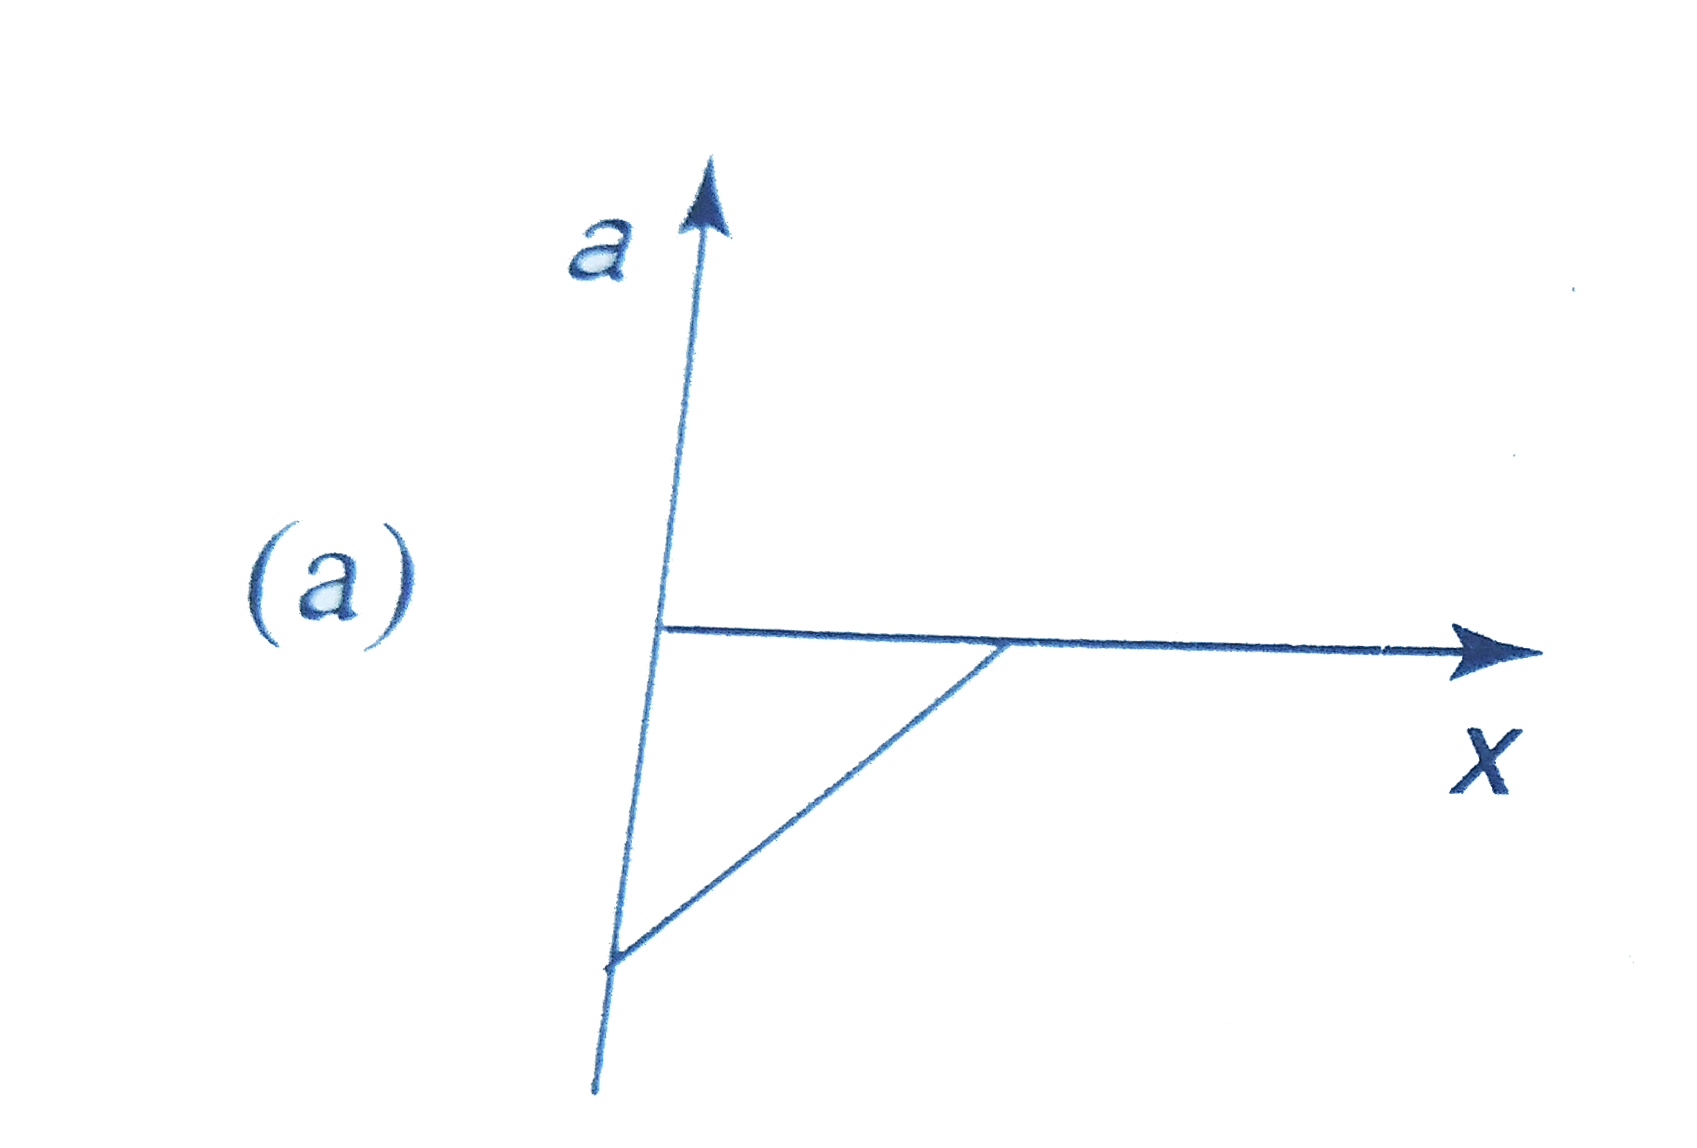 B
B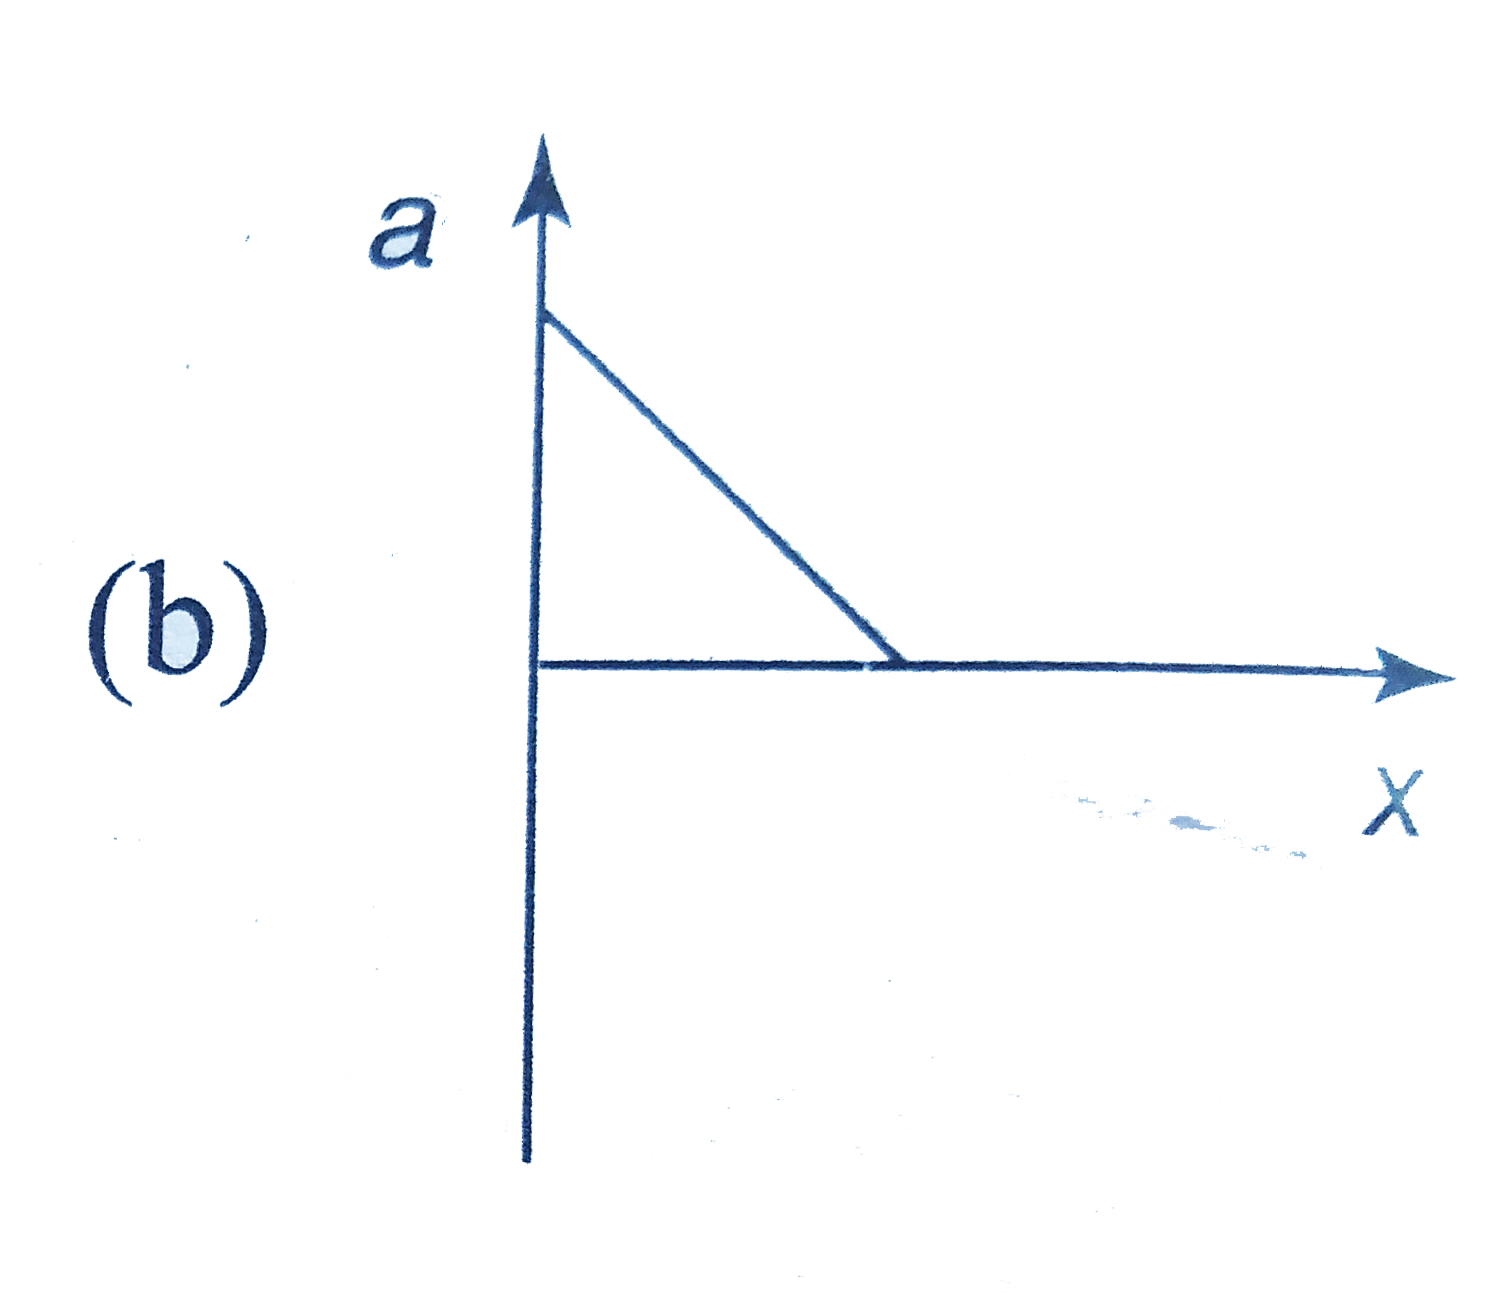 .C
.C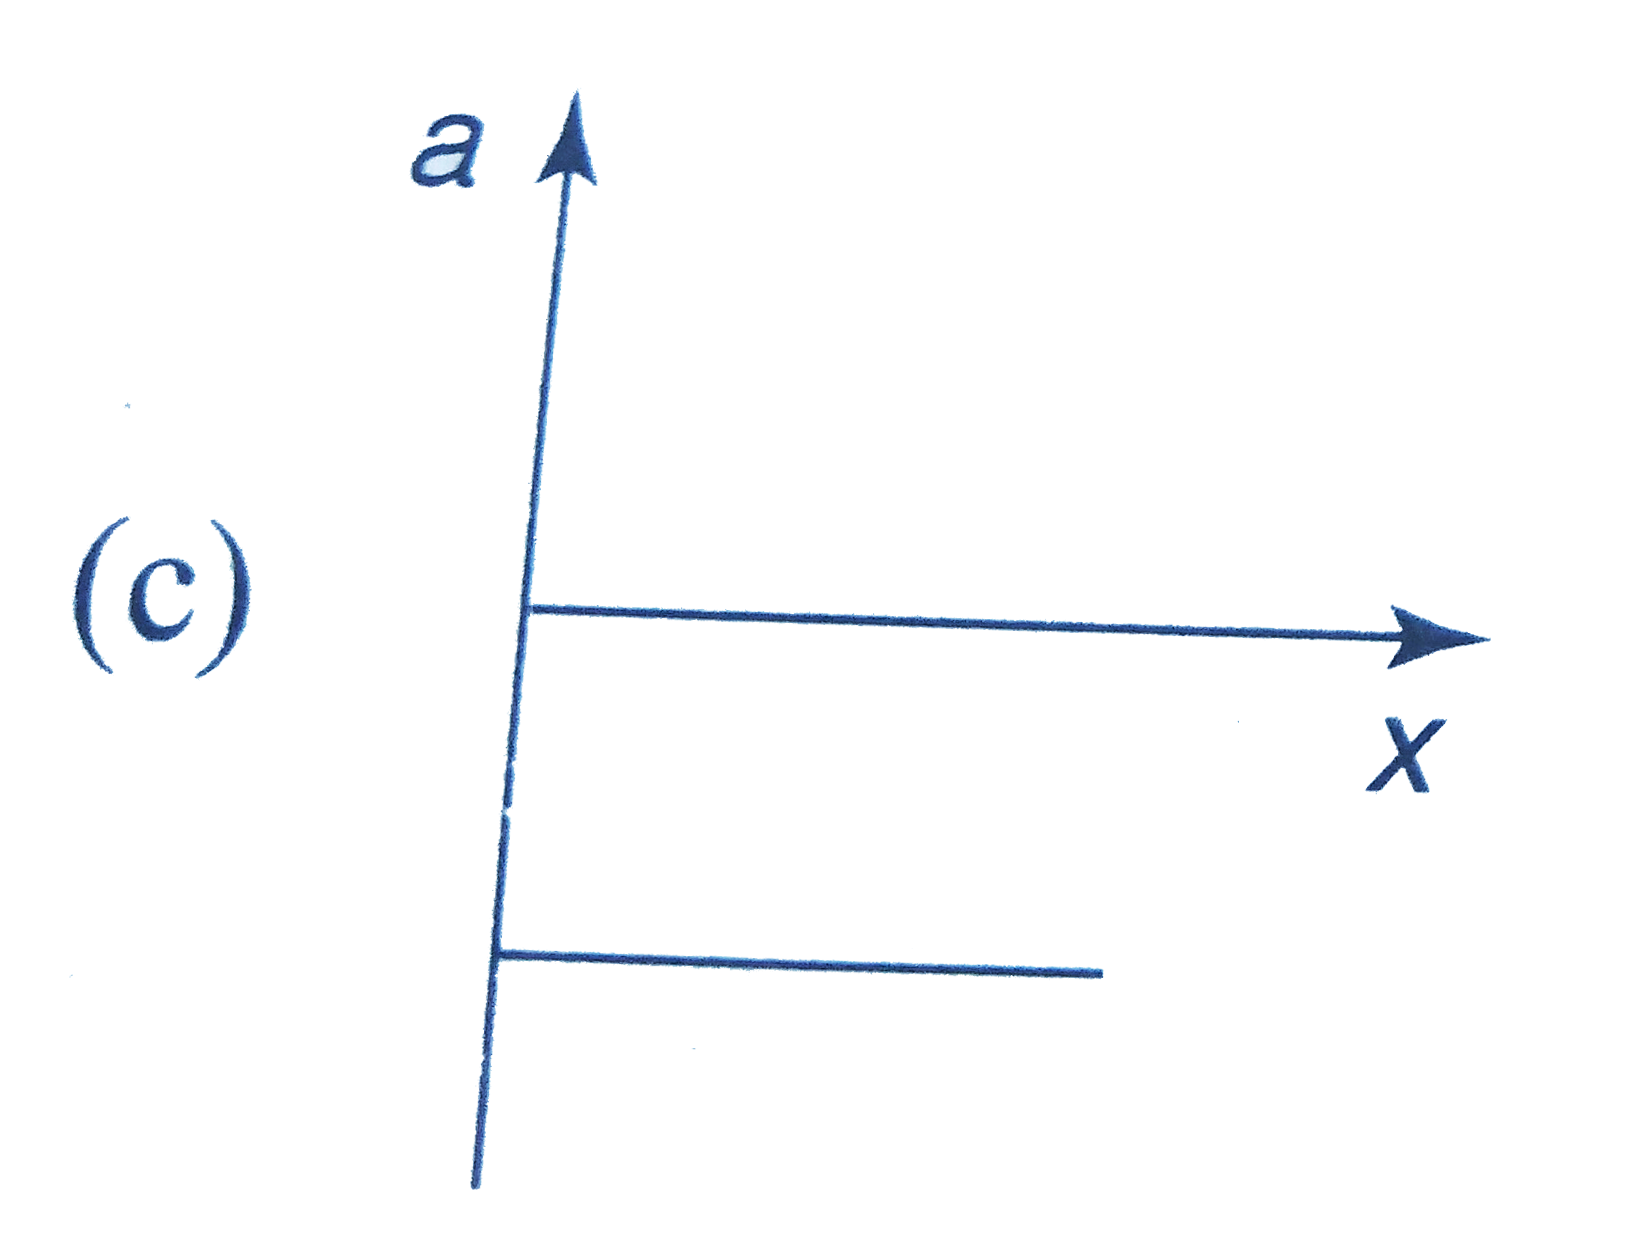 .D
.D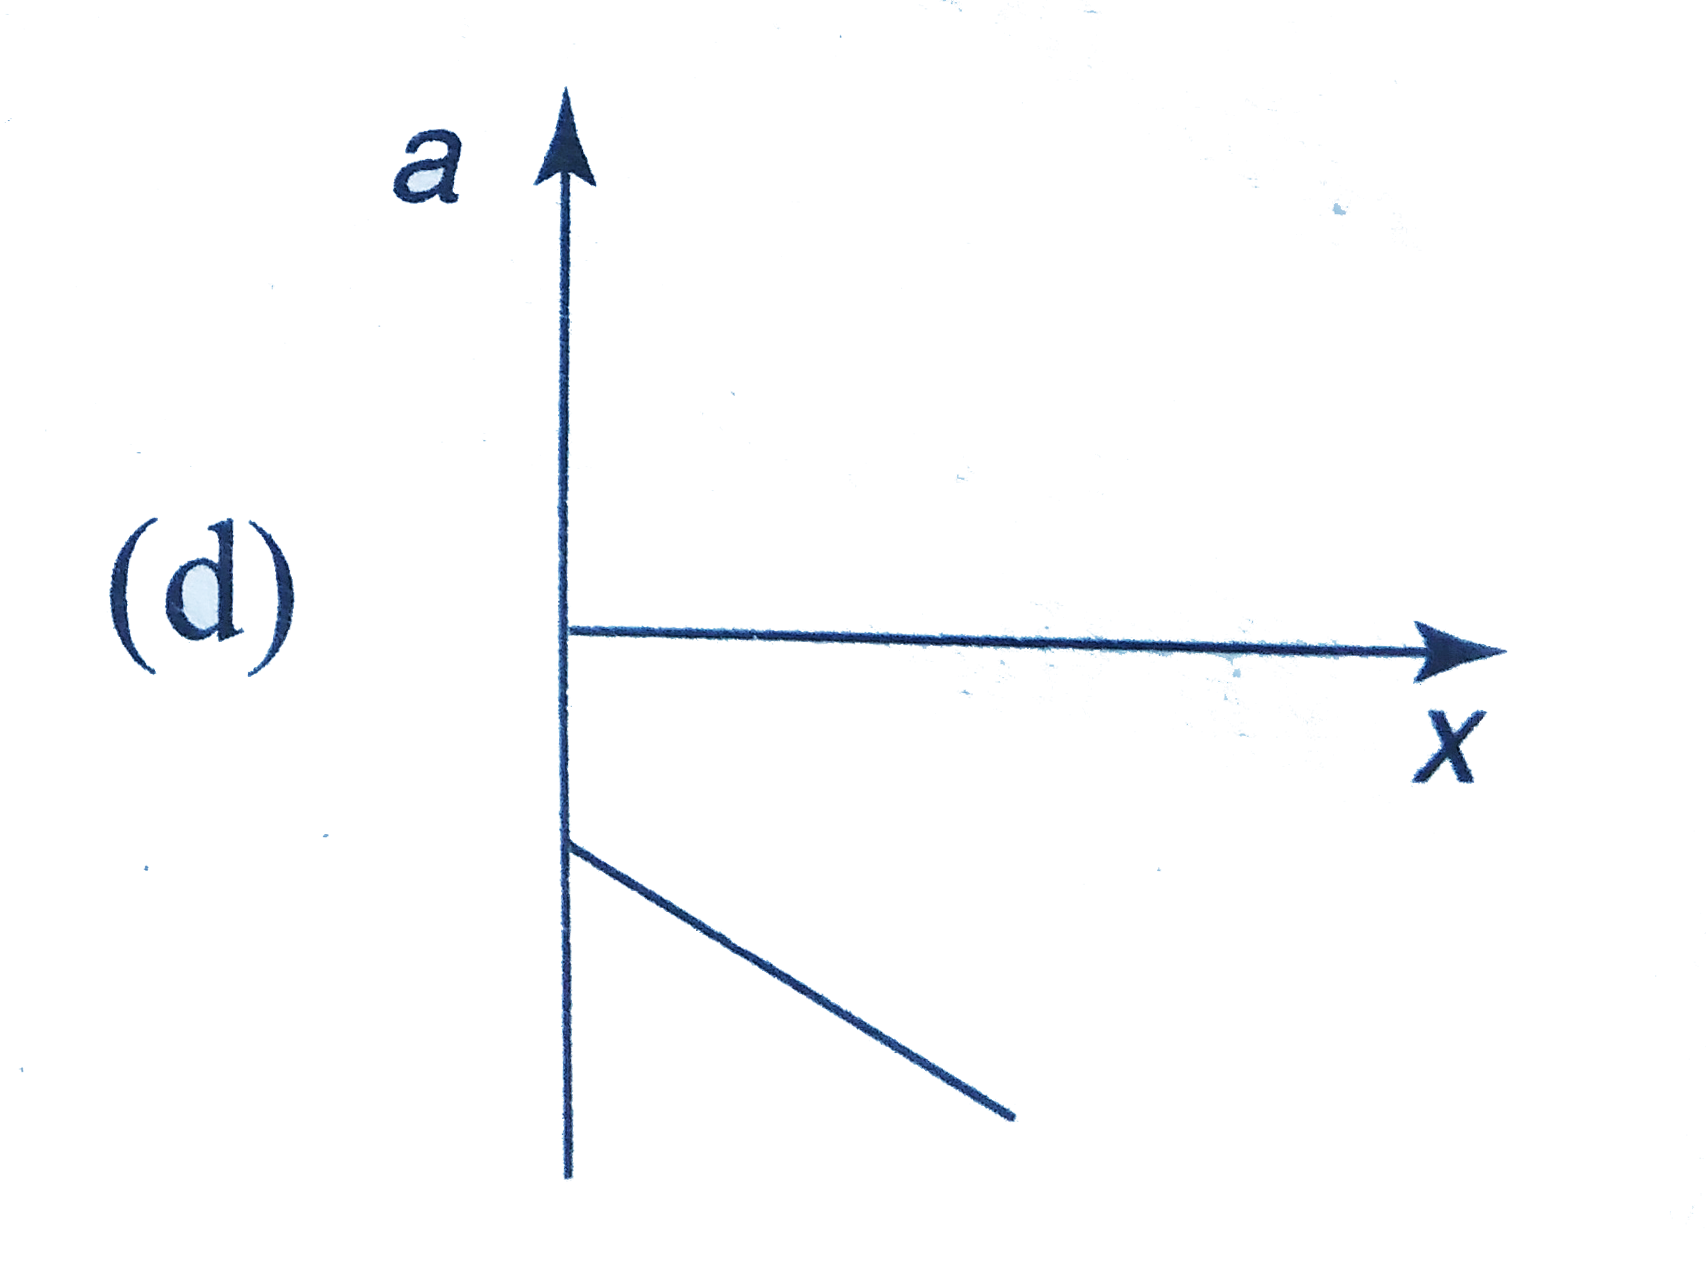 .
.
Which of the following x-t graphs shows an object moving with negative acceleration ?

View SolutionWhich of the following graphs may not repersent variation of distance (S) with respect ot time (t) ?
View SolutionThe oscillationof a body on a smooth horizontal surface is represented by the equation
x=Acosωt
where x= displacement at time t, ω= frequency of oscillation. Which one of the following graphs shows correctly the variation of acceleration a with time t ?
View Solutionwhich of the following graph represents the variation of resistivity (ρ) with temperature (T) for copper?
View SolutionAt time t=0, some radioactive gas is injected into a sealed vessel. At time T, some more of the same gas is injected into the same vessel. Which one of the following graphs best represents the variation of the logarithm of the activity A of the gas with time t?
View Solution

