Which of the following x-t graphs shows an object moving with negative acceleration ?

The correct Answer is:3
Hint : Change in velocity is acceleration and the slope of x-t graph gives velocity
Topper's Solved these Questions
- MOTION IN STRAIGHT LINEBOOK - AAKASH INSTITUTECHAPTER - MOTION IN STRAIGHT LINEEXERCISE - Assignment (SECTION - A)
50 Videos
- MOTION IN STRAIGHT LINEBOOK - AAKASH INSTITUTECHAPTER - MOTION IN STRAIGHT LINEEXERCISE - Assignment (SECTION - B)
19 Videos
- MOTION IN STRAIGHT LINEBOOK - AAKASH INSTITUTECHAPTER - MOTION IN STRAIGHT LINEEXERCISE - Assignment (SECTION - J)
2 Videos
- MOTION IN A STRAIGHT LINEBOOK - AAKASH INSTITUTECHAPTER - MOTION IN A STRAIGHT LINEEXERCISE - ASSIGNMENT (SECTION - D)
15 Videos
- MOVING CHARGE AND MAGNESIUMBOOK - AAKASH INSTITUTECHAPTER - MOVING CHARGE AND MAGNESIUMEXERCISE - SECTION D
16 Videos
Similar Questions
Knowledge Check
The oscillationof a body on a smooth horizontal surface is represented by the equation
x=Acosωt
where x= displacement at time t, ω= frequency of oscillation. Which one of the following graphs shows correctly the variation of acceleration a with time t ?A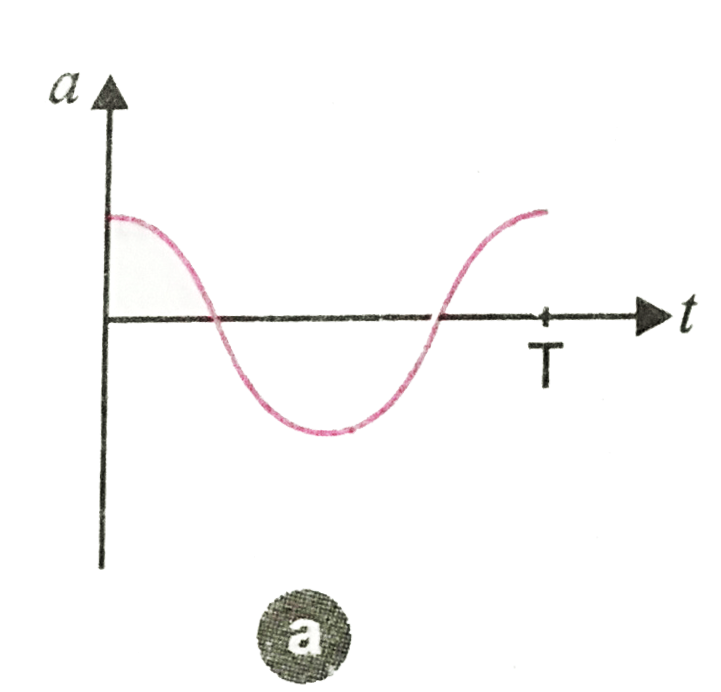 B
B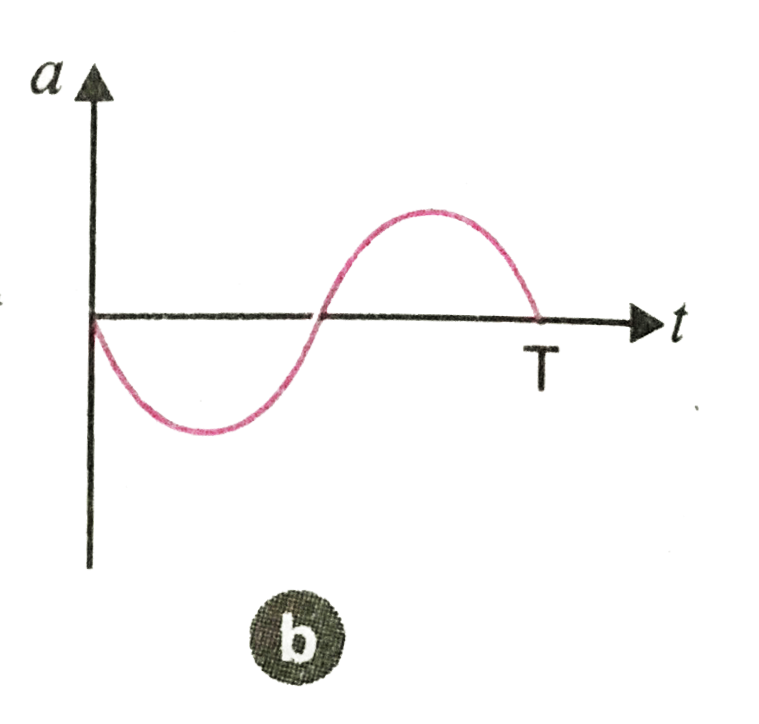 C
C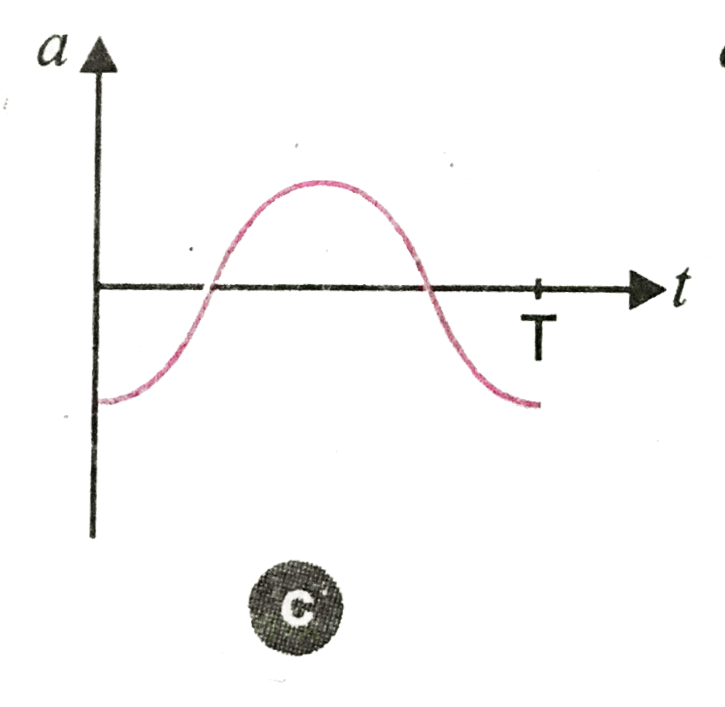 D
D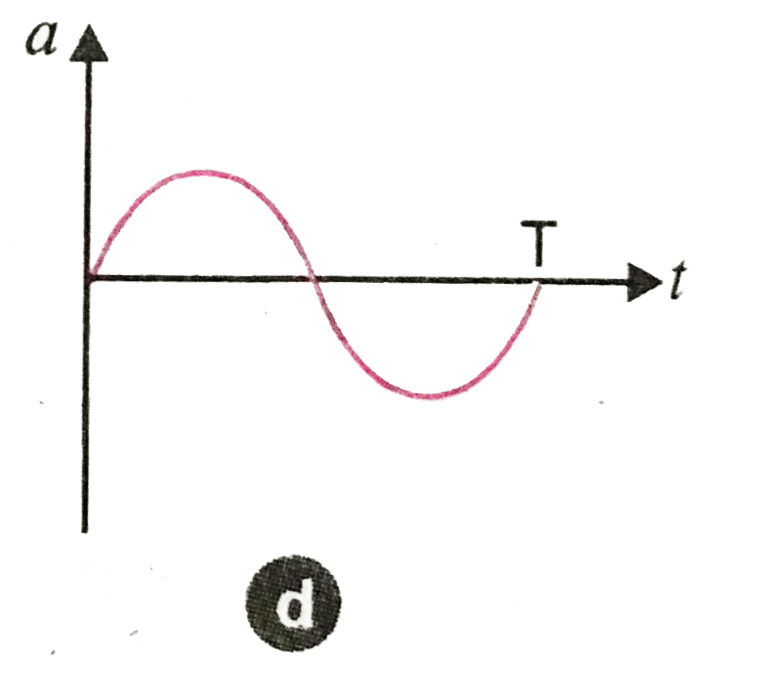
Which graph corresponds to an object moving with a constant negative acceleration and a positive velocity ?
A B
B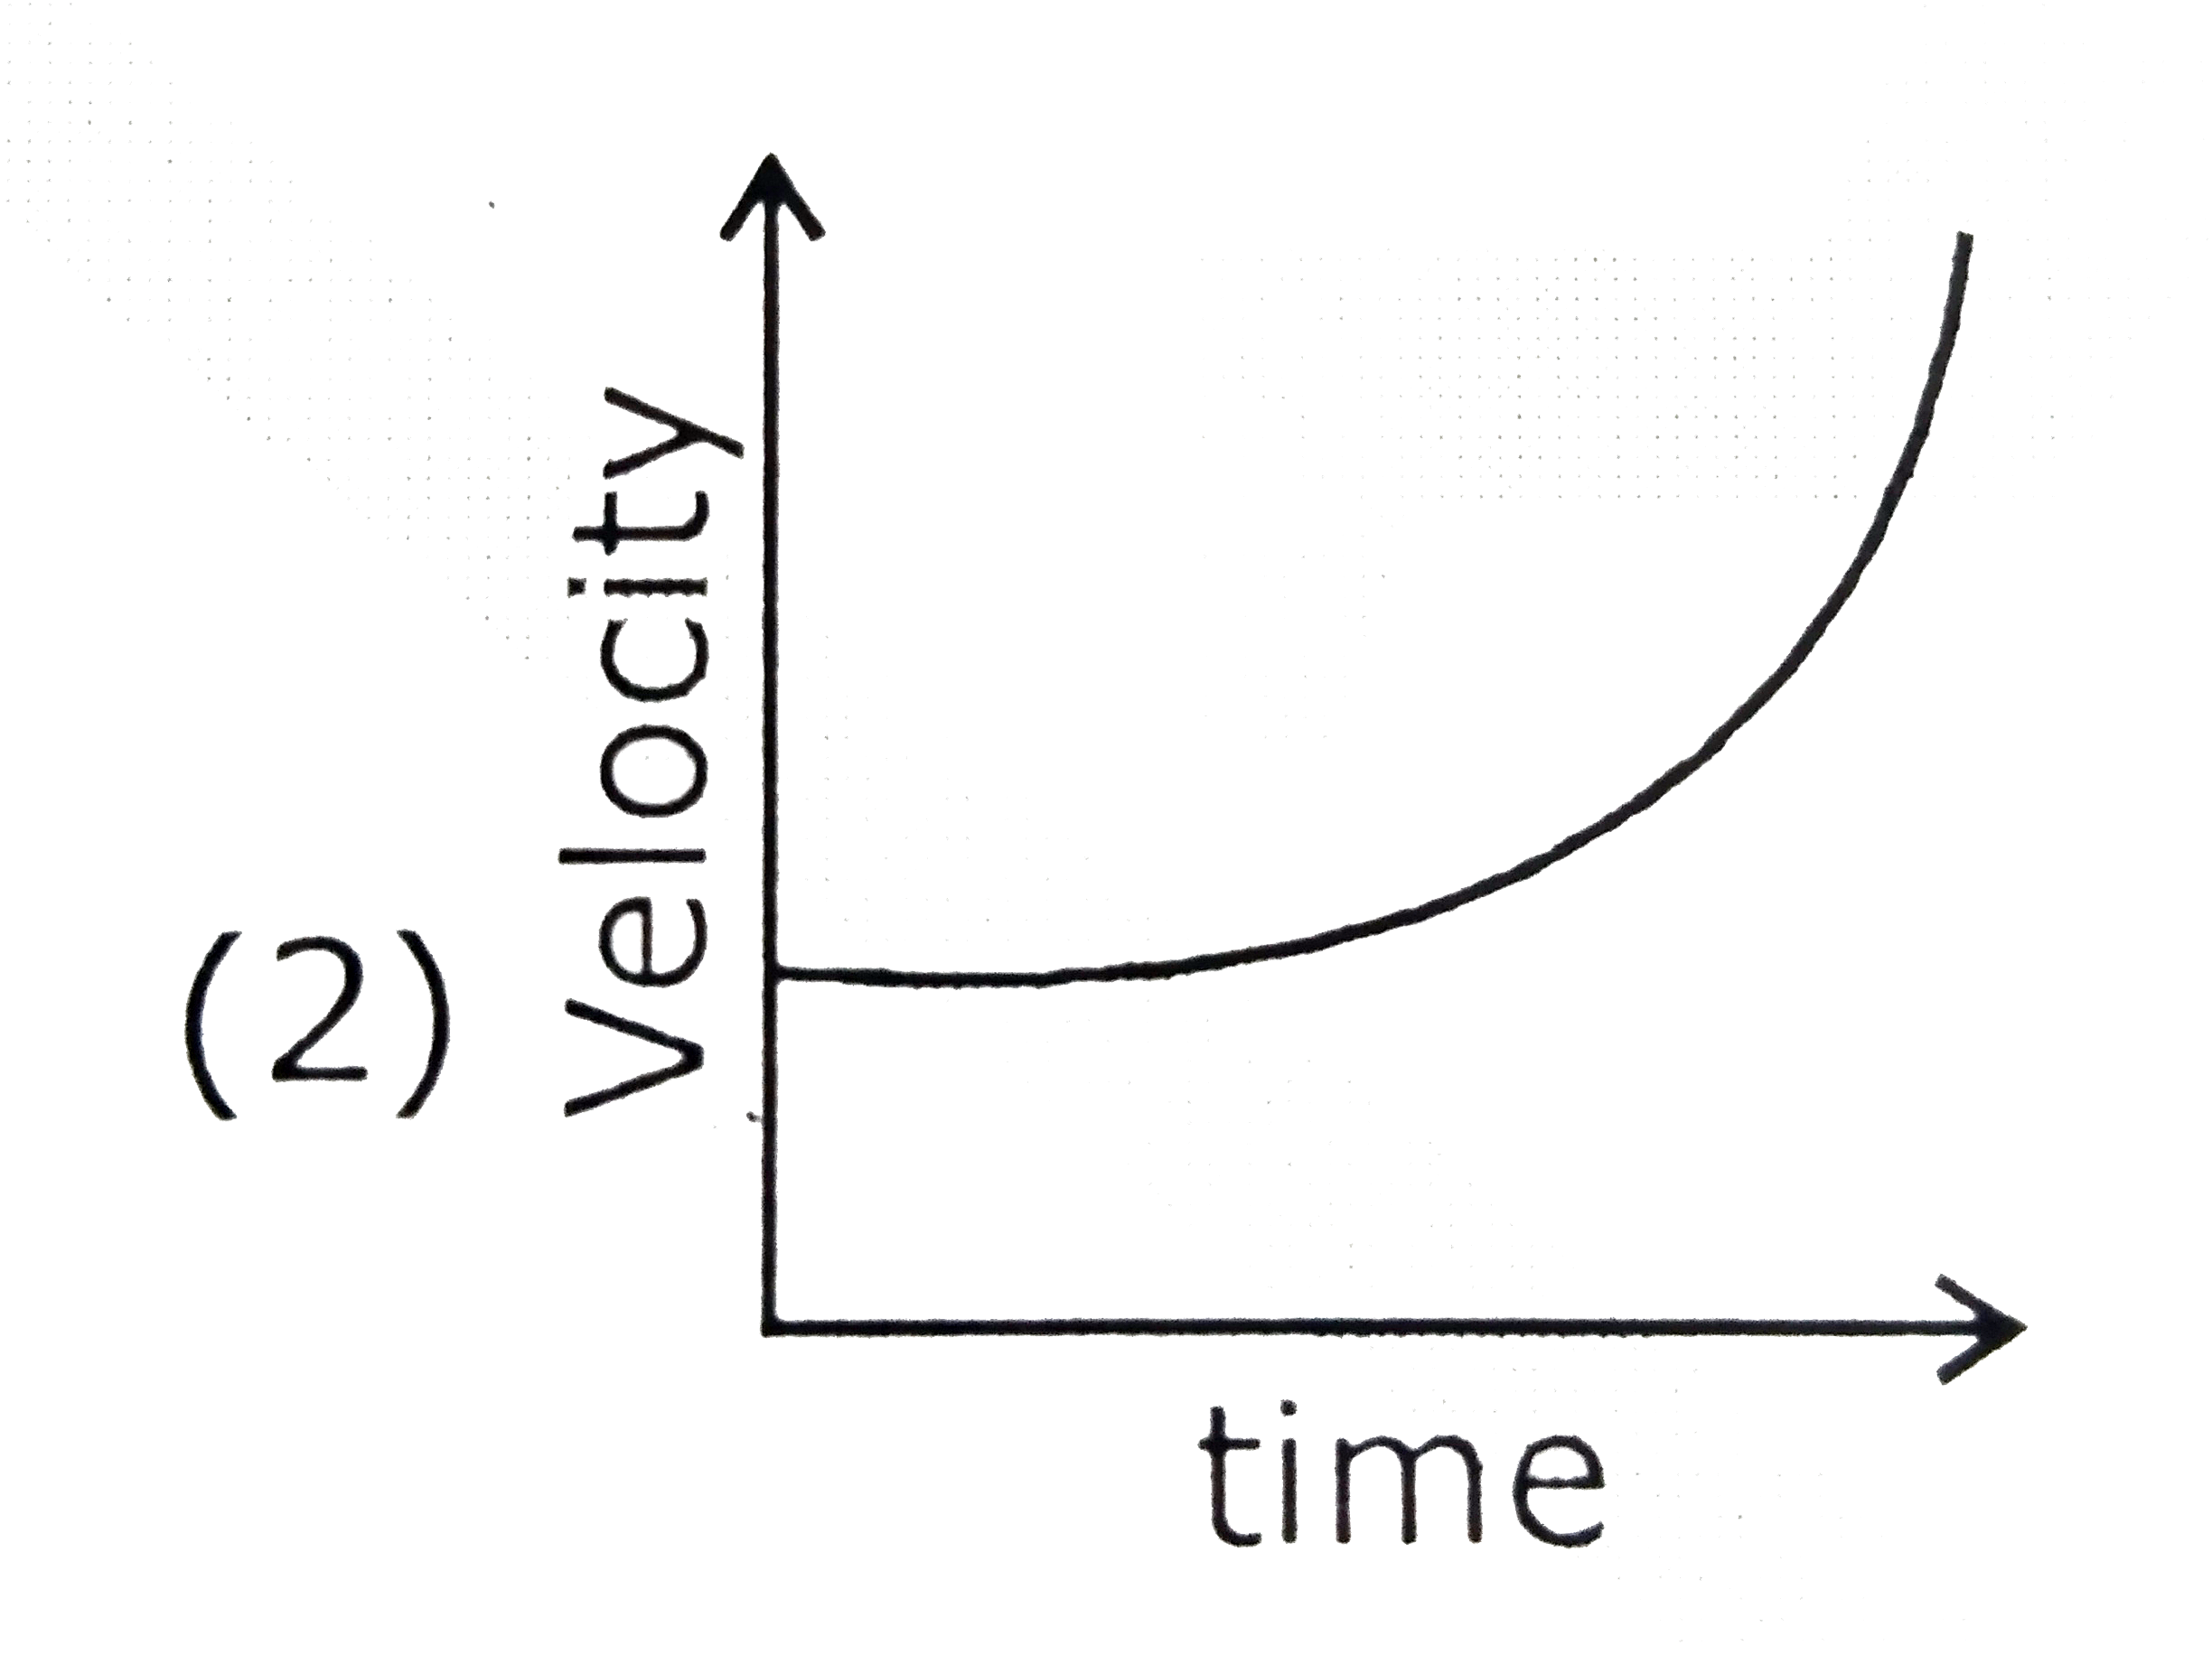 C
C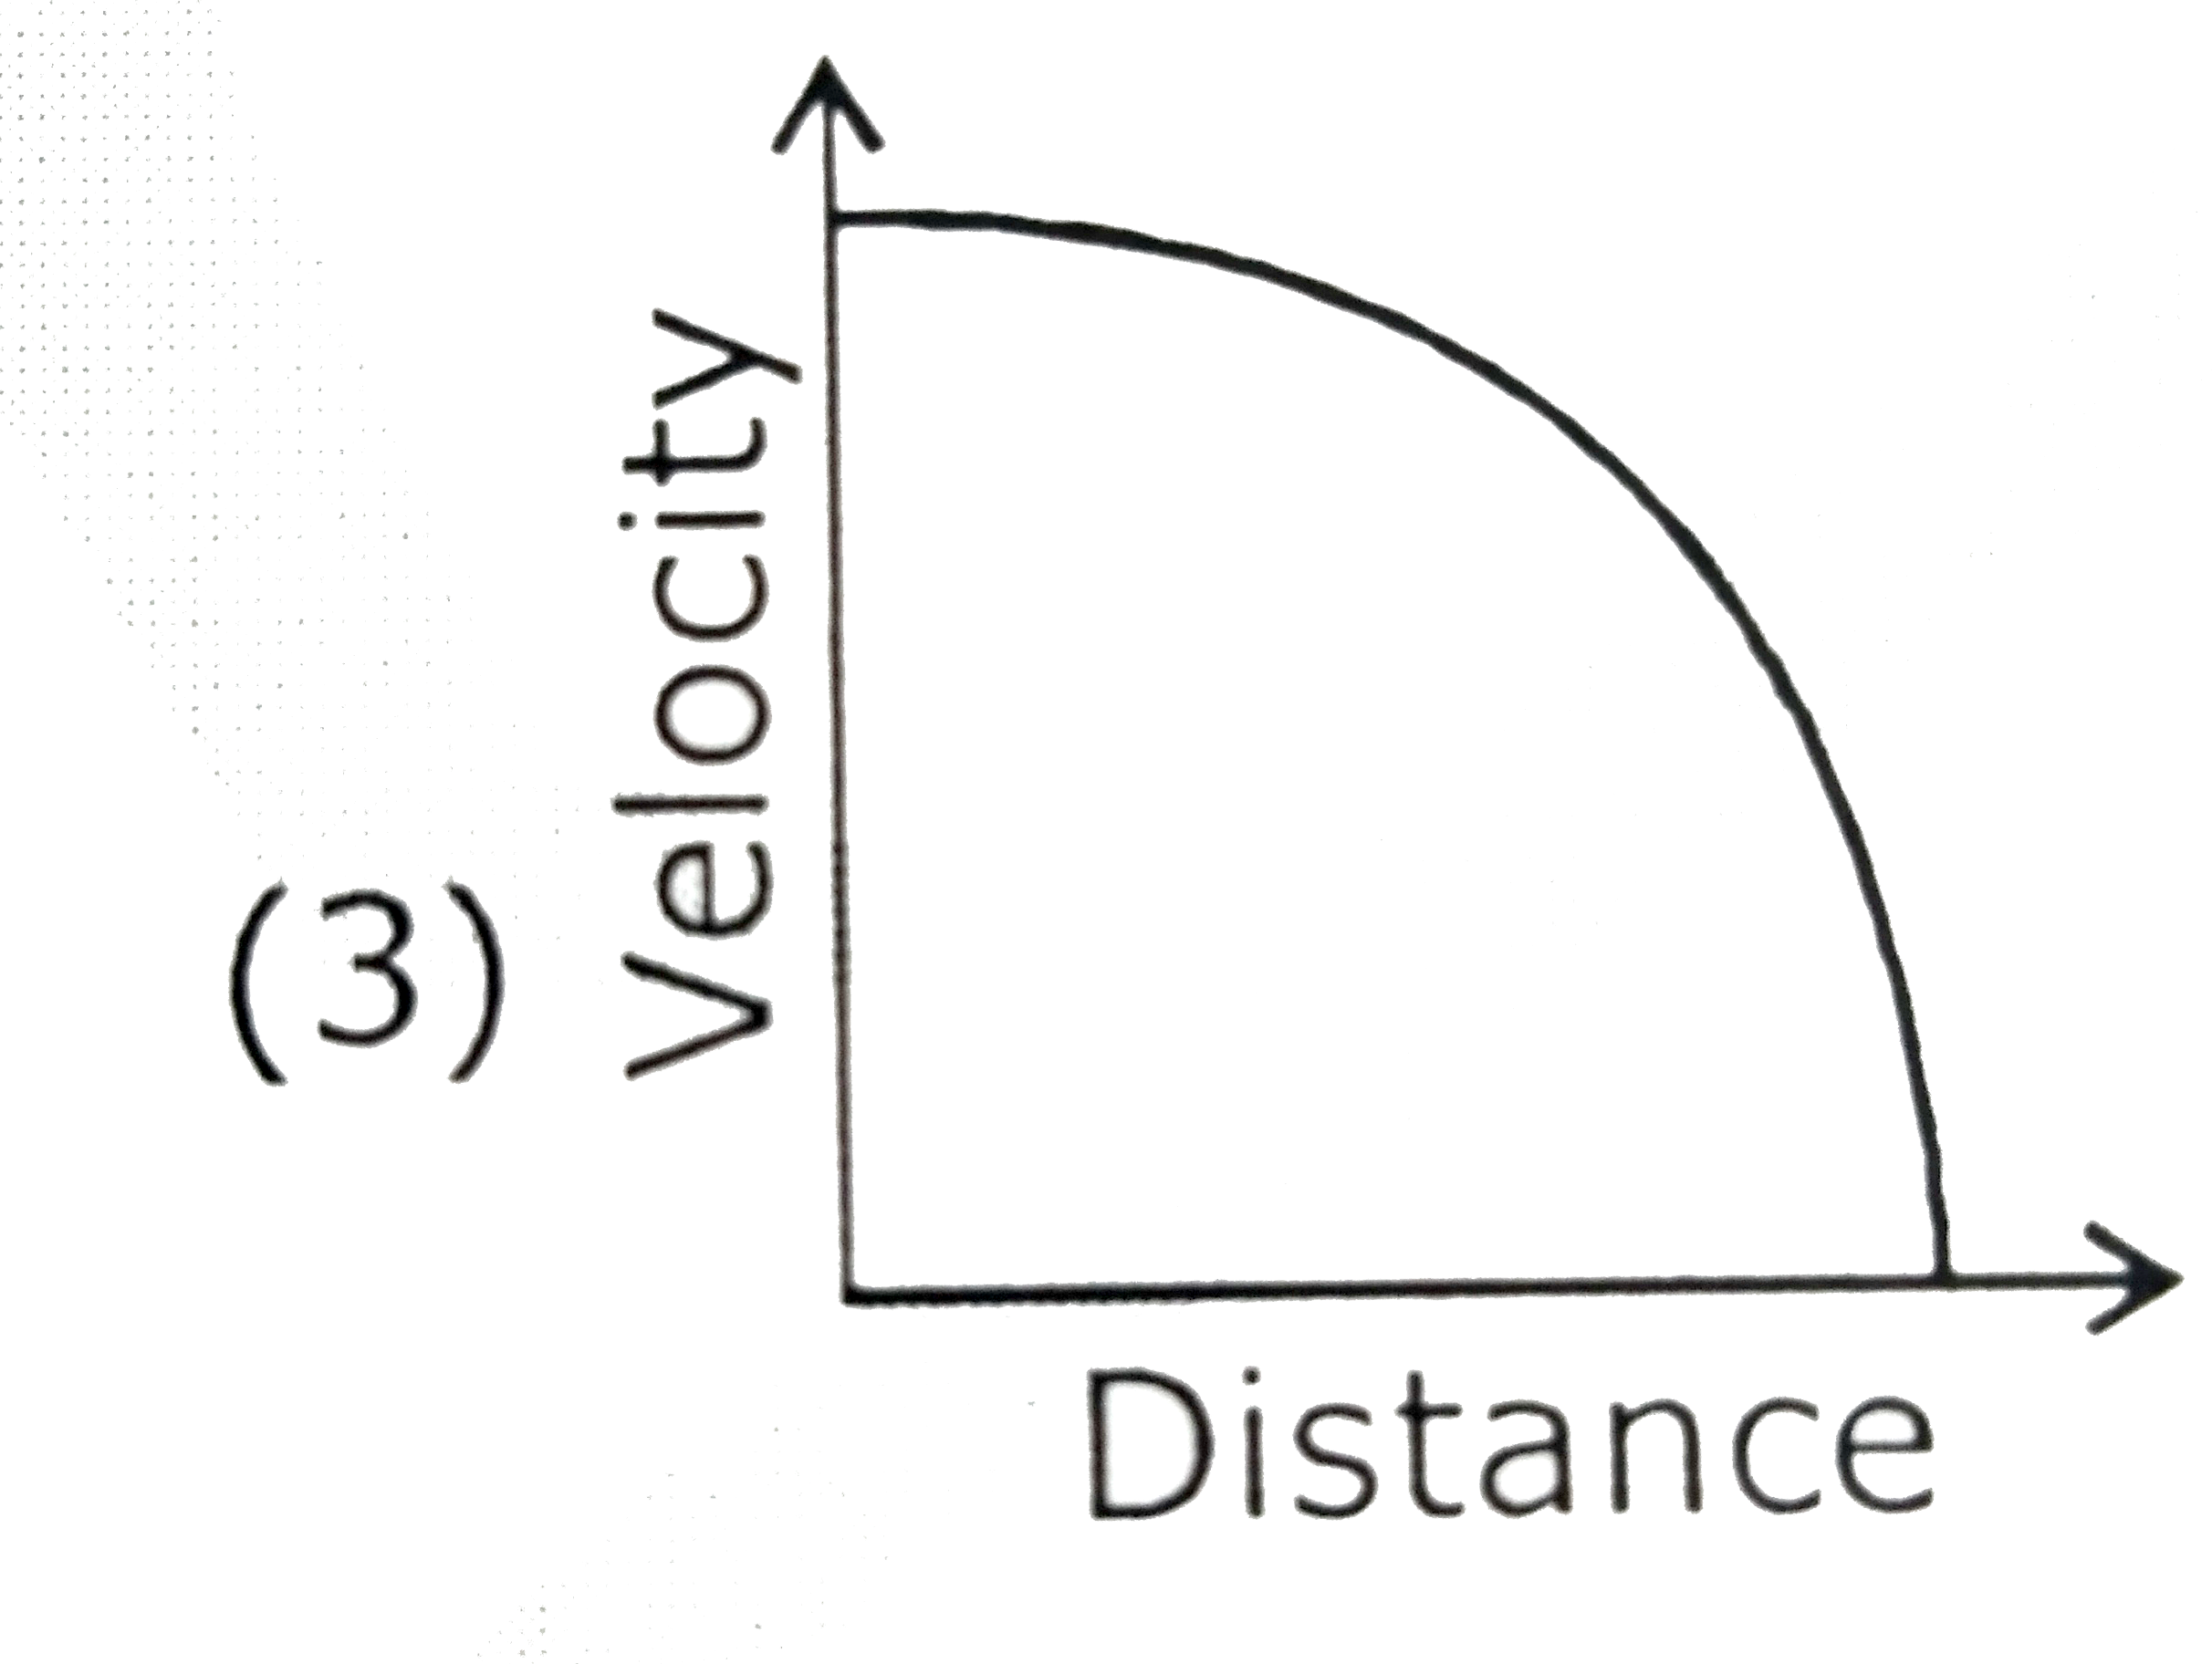 D
D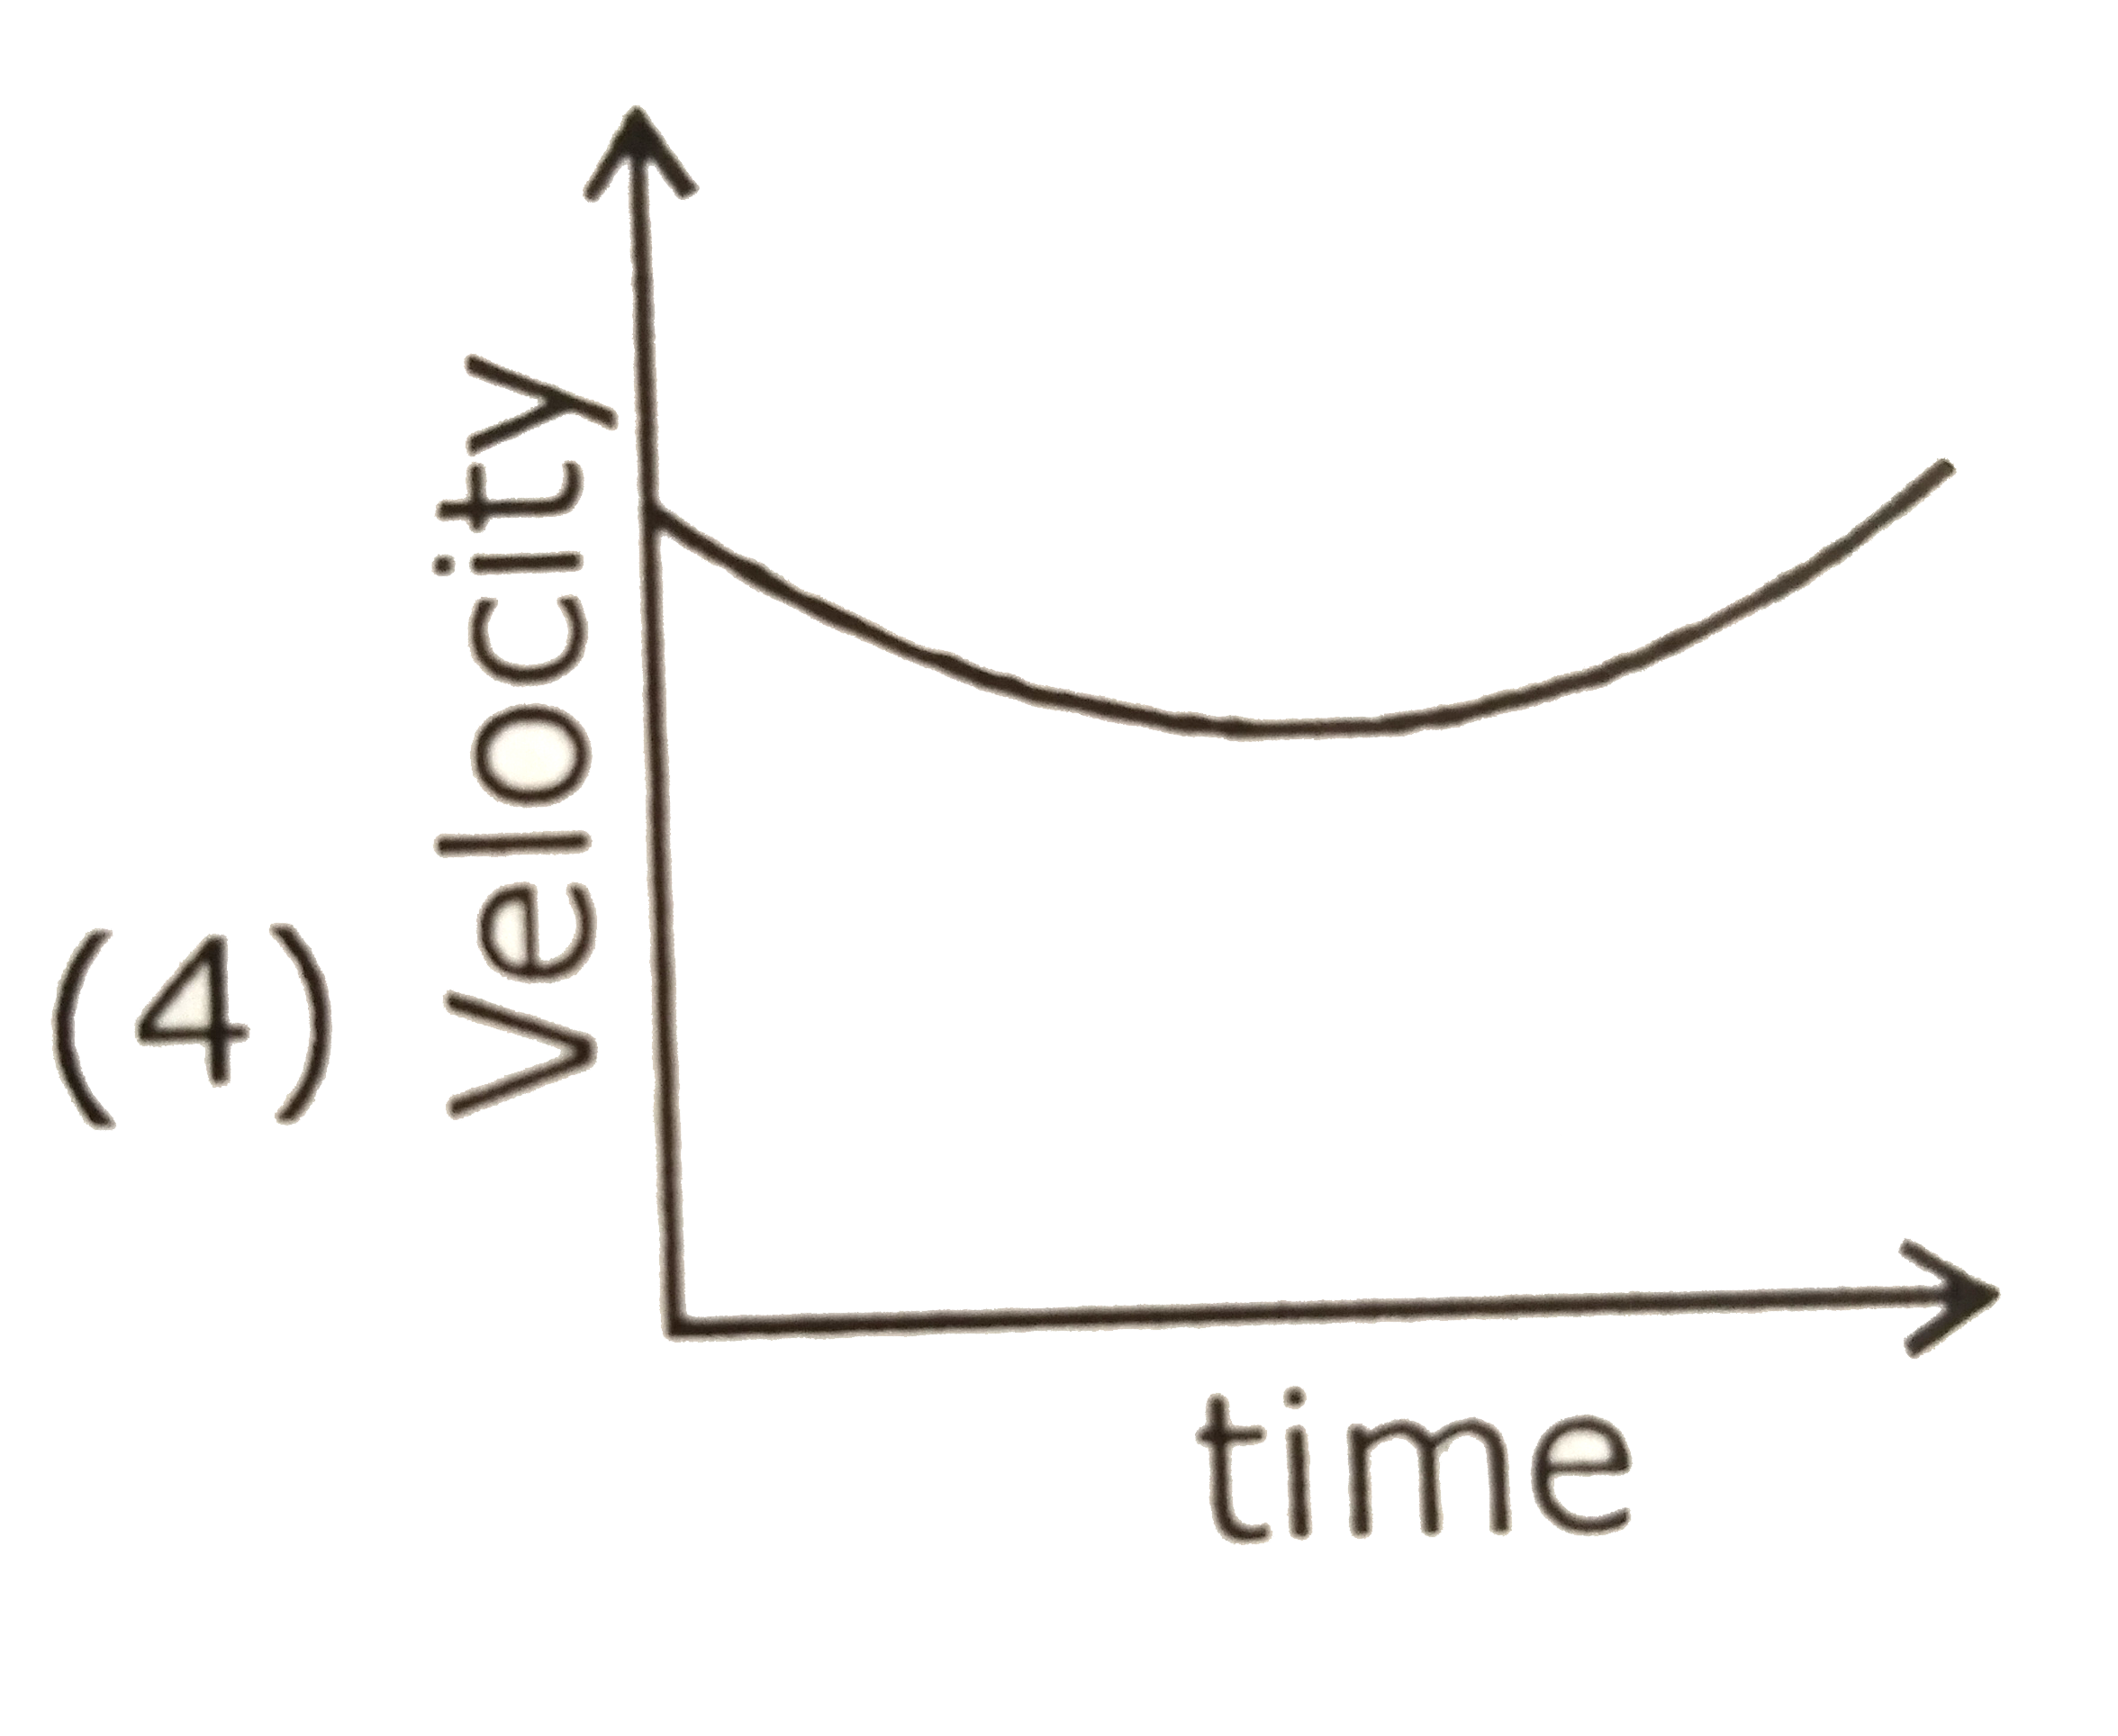
Position - time graph for motion with negative acceleration is
A B
B C
C D
D
Draw the position-time graph of a moving object, moving with zero acceleration.
View SolutionShow that the area under the velocity-time graph of an object moving with constant acceleration in a straight line in certain time interval is equal to the distance covered by the object in that interval.
View SolutionShow that area under the velocity-time graph of an object moving with constant acceleration in a straight line in certain time interval is equal to the distance covered by the object in the interval.
View SolutionThe oscillation of a body on a smooth horizontal surface is represented by the equation,
X=Acos(ωt)
where, X = displacement at time t
ω= frequency of oscillation
Which one of the following graphs shows correctly the variation a with t?
Here, a = acceleration at time t
T = time period
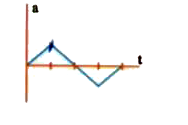
View SolutionWhich of the following v Vs t graph are correct representation for the acceleration Vs time graph shown below
View Solution