The potential energy of a particle moving along axis is shown in figure. Which one of the following graphs represents the variation of kinetic energy of this particel if its total mechanical enery is
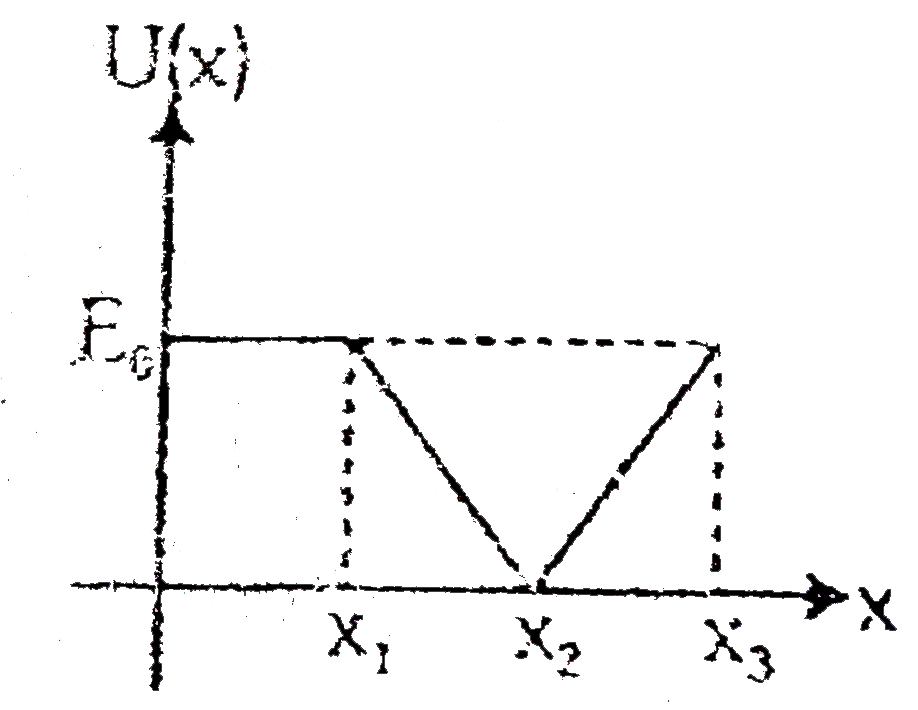
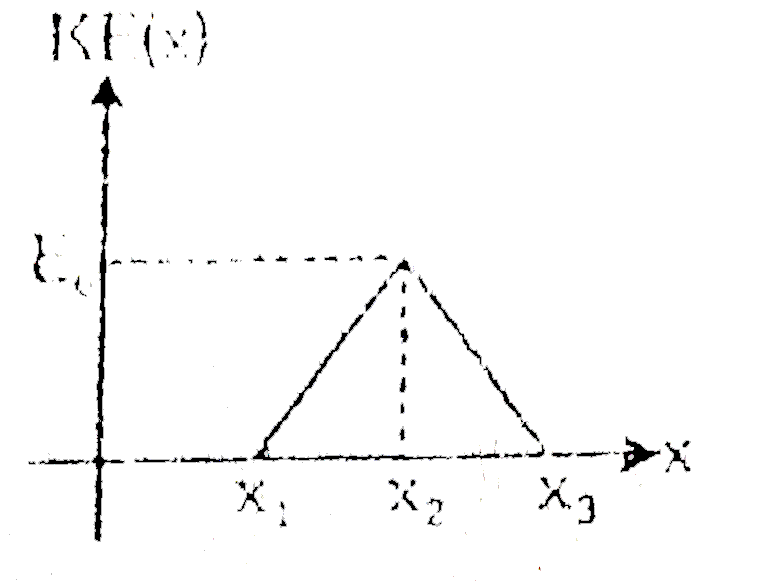
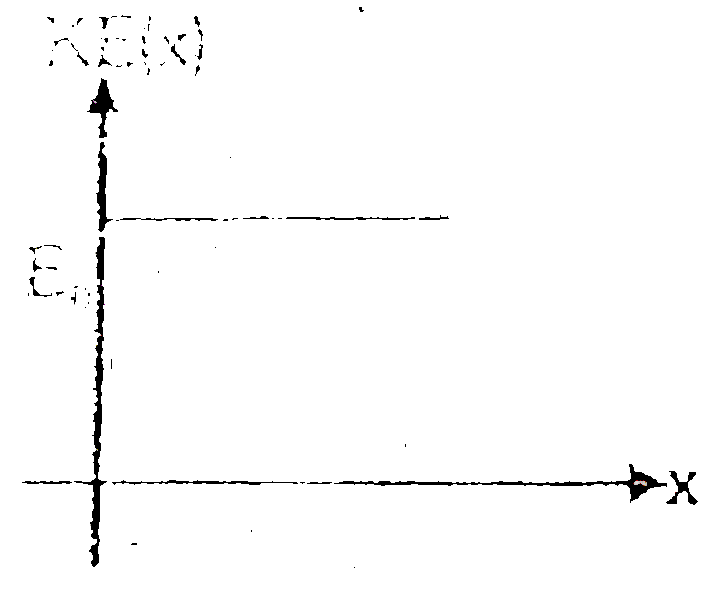
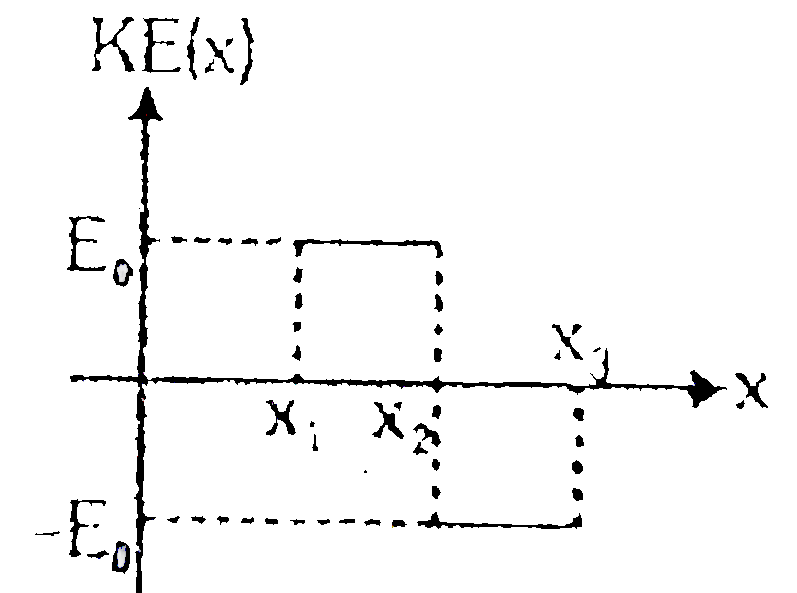
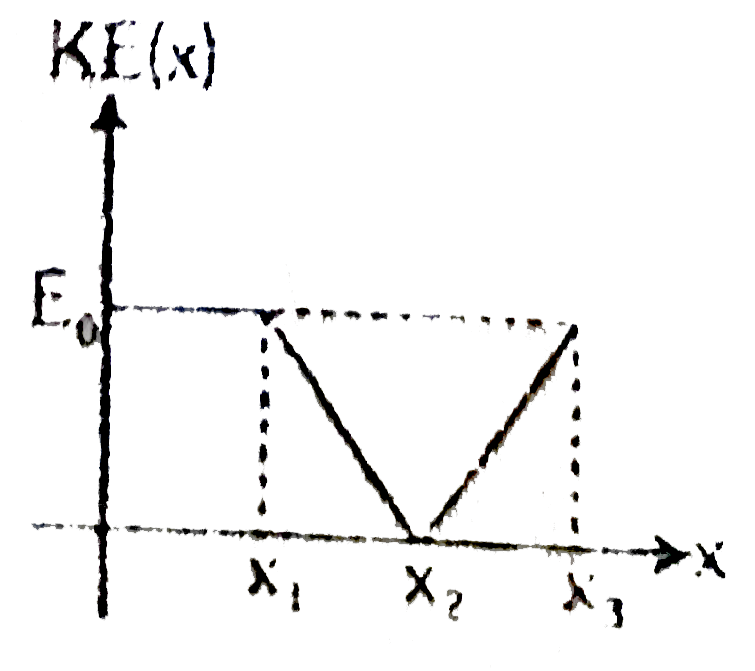
The correct Answer is:A
constant
Topper's Solved these Questions
- TEST PAPERBOOK - ALLENCHAPTER - TEST PAPEREXERCISE - PHYSICS
4 Videos
- TEST PAPERBOOK - ALLENCHAPTER - TEST PAPEREXERCISE - PHYSICS
4 Videos
- SIMPLE HARMONIC MOTIONBOOK - ALLENCHAPTER - SIMPLE HARMONIC MOTIONEXERCISE - Example
1 Videos
- TEST PAPER 1BOOK - ALLENCHAPTER - TEST PAPER 1EXERCISE - PHYSICS
11 Videos
Similar Questions
Which one of the following graphs represents the variation of maximum kinetic energy (EK) of the emitted electrons with frequency u in photoelectric effect correctly ?
View SolutionThe potential energy U(x) of a particle moving along x - axis is given by U(x)=ax−bx2. Find the equilibrium position of particle.
View Solution
Knowledge Check
A body moves from rest with a constant acceleration. Which one of the following graphs represents the variation of its kinetic energy K with the distance travelled x?
A B
B C
C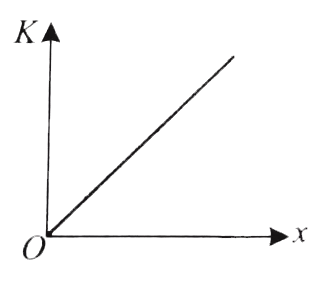 D
D
A body moves from rest with a constant acceleration. Which one of the following graphs represents the variation of its kinetic energy K with the distance travelled x?
A B
B C
C D
D
A body moves from rest with a constant ac- celeration. Which of the following graphs represents the variation of its kinetic energy (E) with distance travelled (x)?
A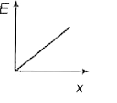 B
B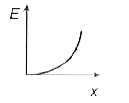 C
C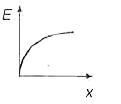 D
D
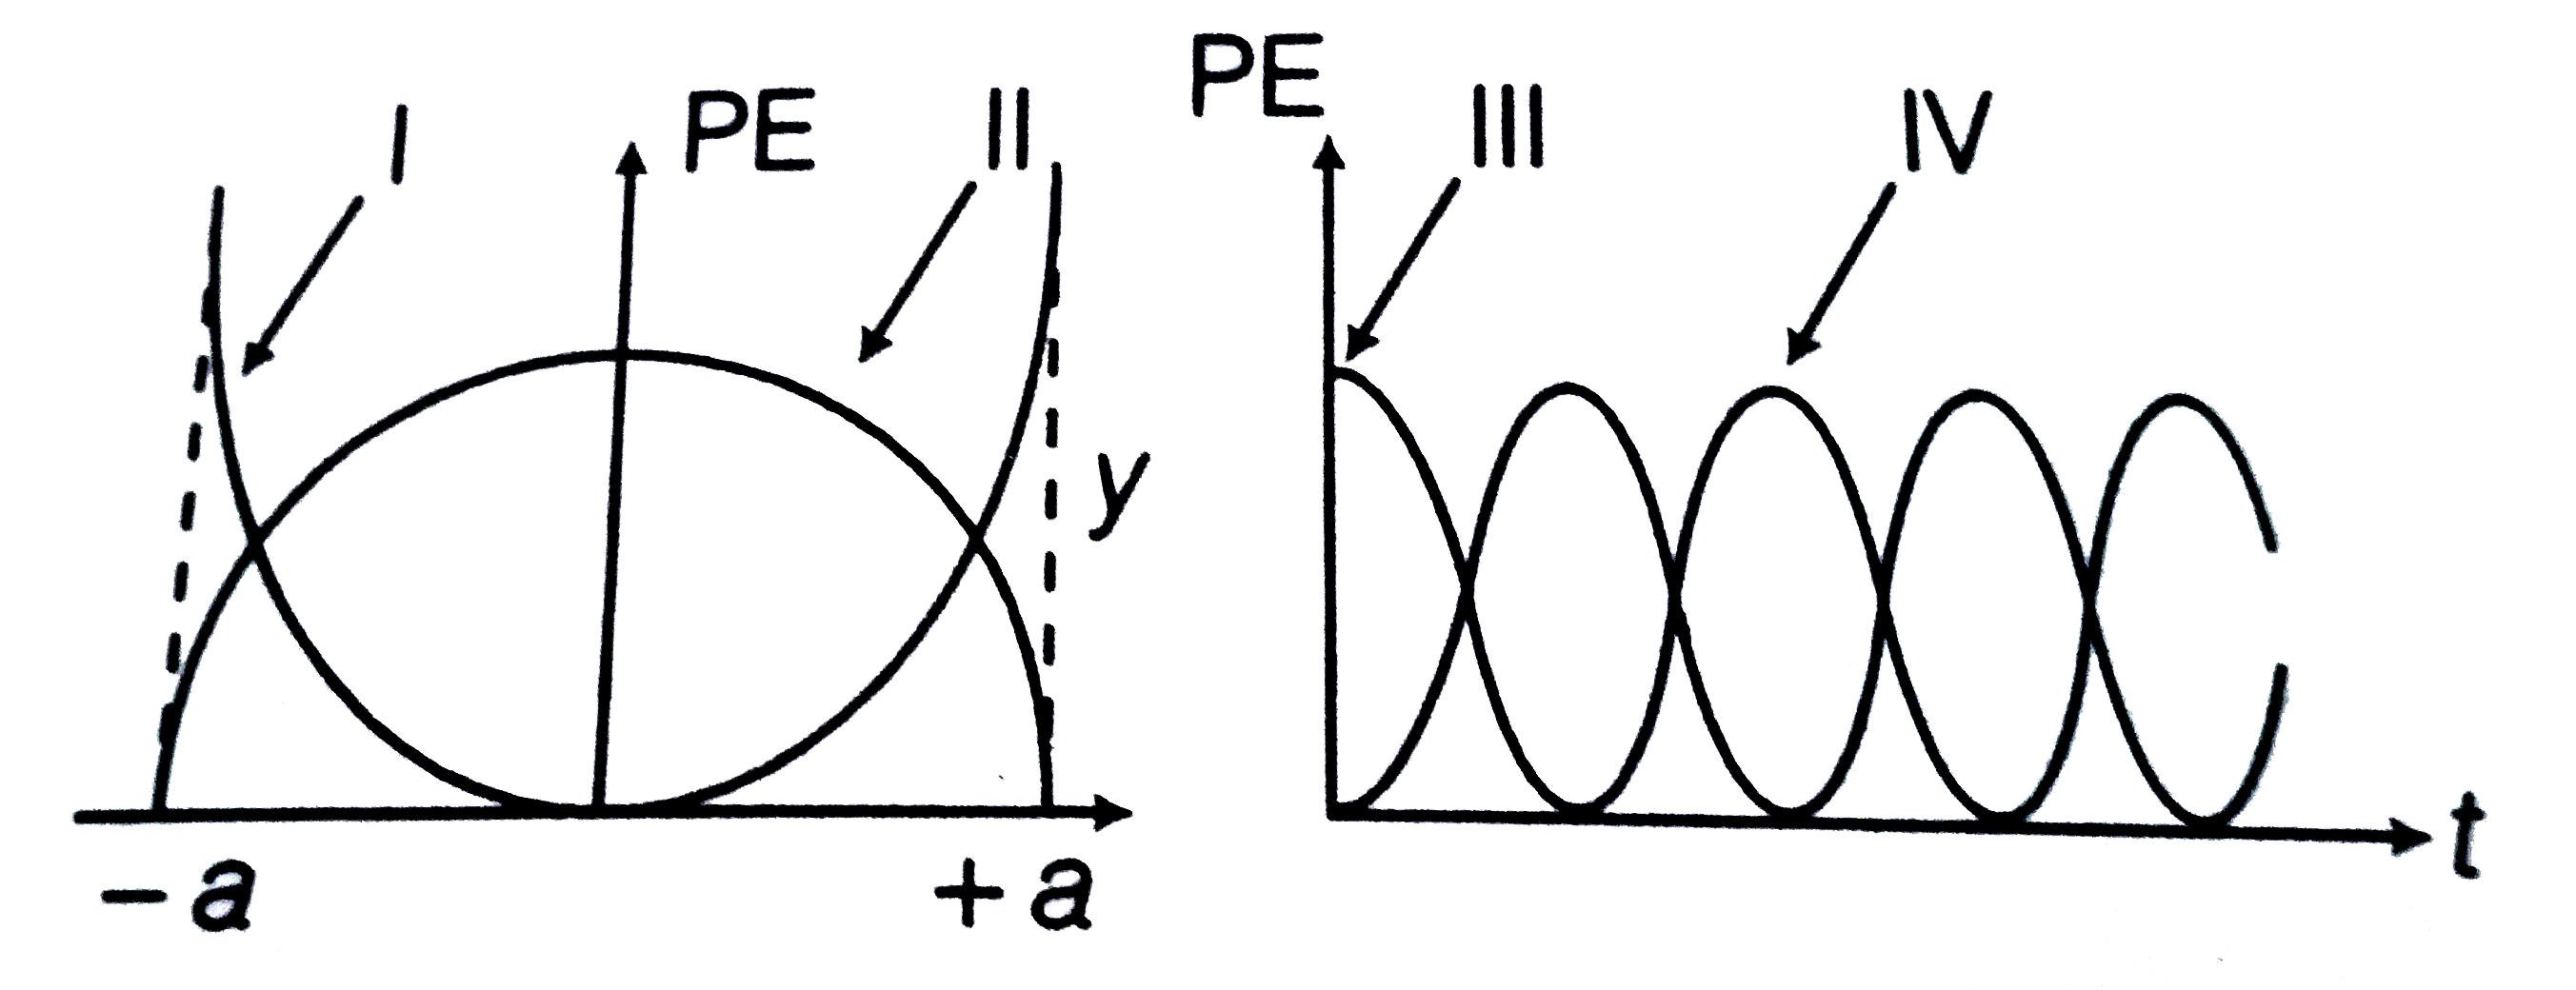
If for a particle executing SHM, the equation of SHM is given as y=acosωt. Then which of the following graphs represents the variation in potential energy?
View SolutionConsider the folllowing graph of potential energy (U) vs position (x) for a particle travelling along x−axis. No other contact force exists, as shown in figure.
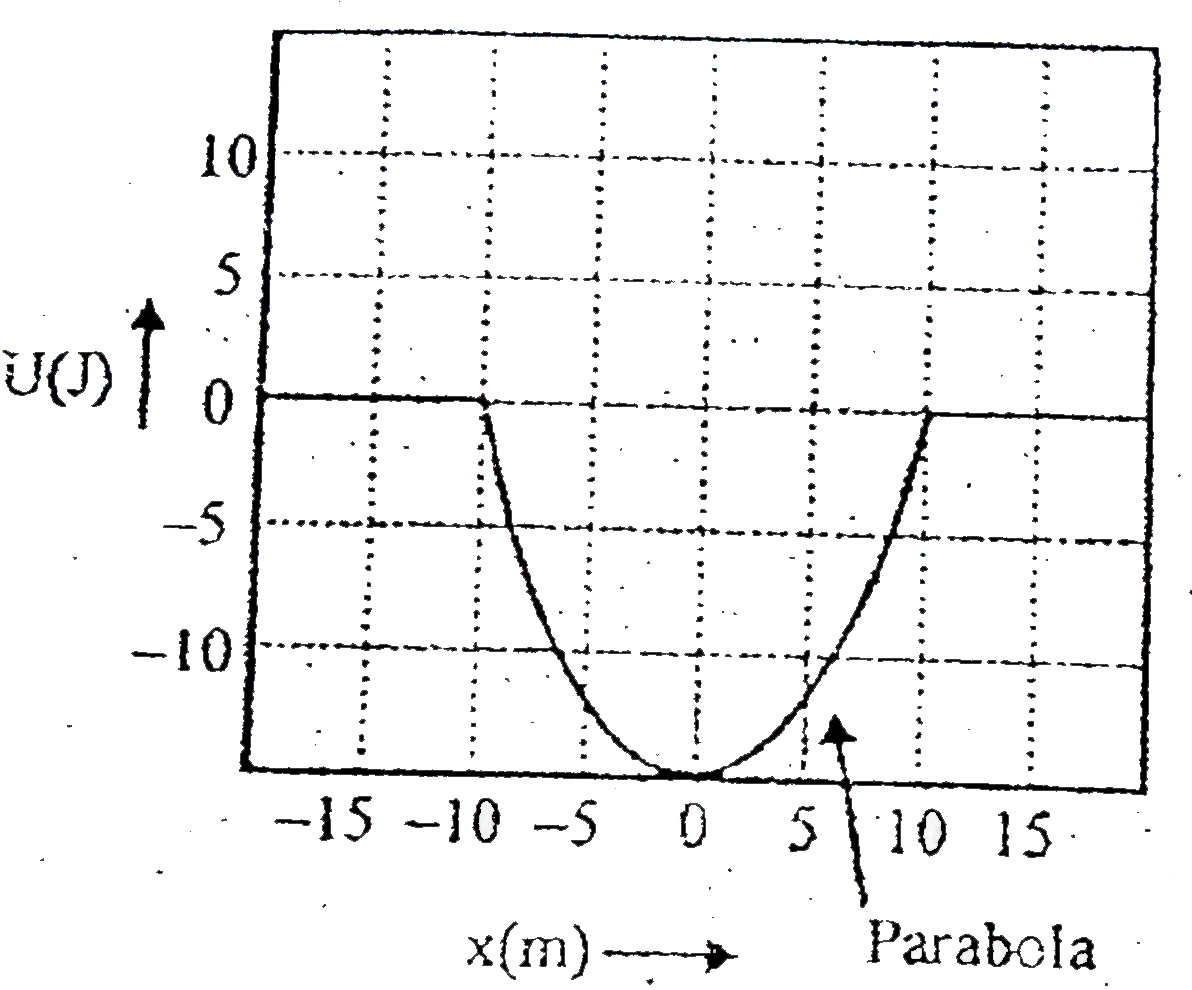
which of the following graph represents teh force corresponding to the given potential ?
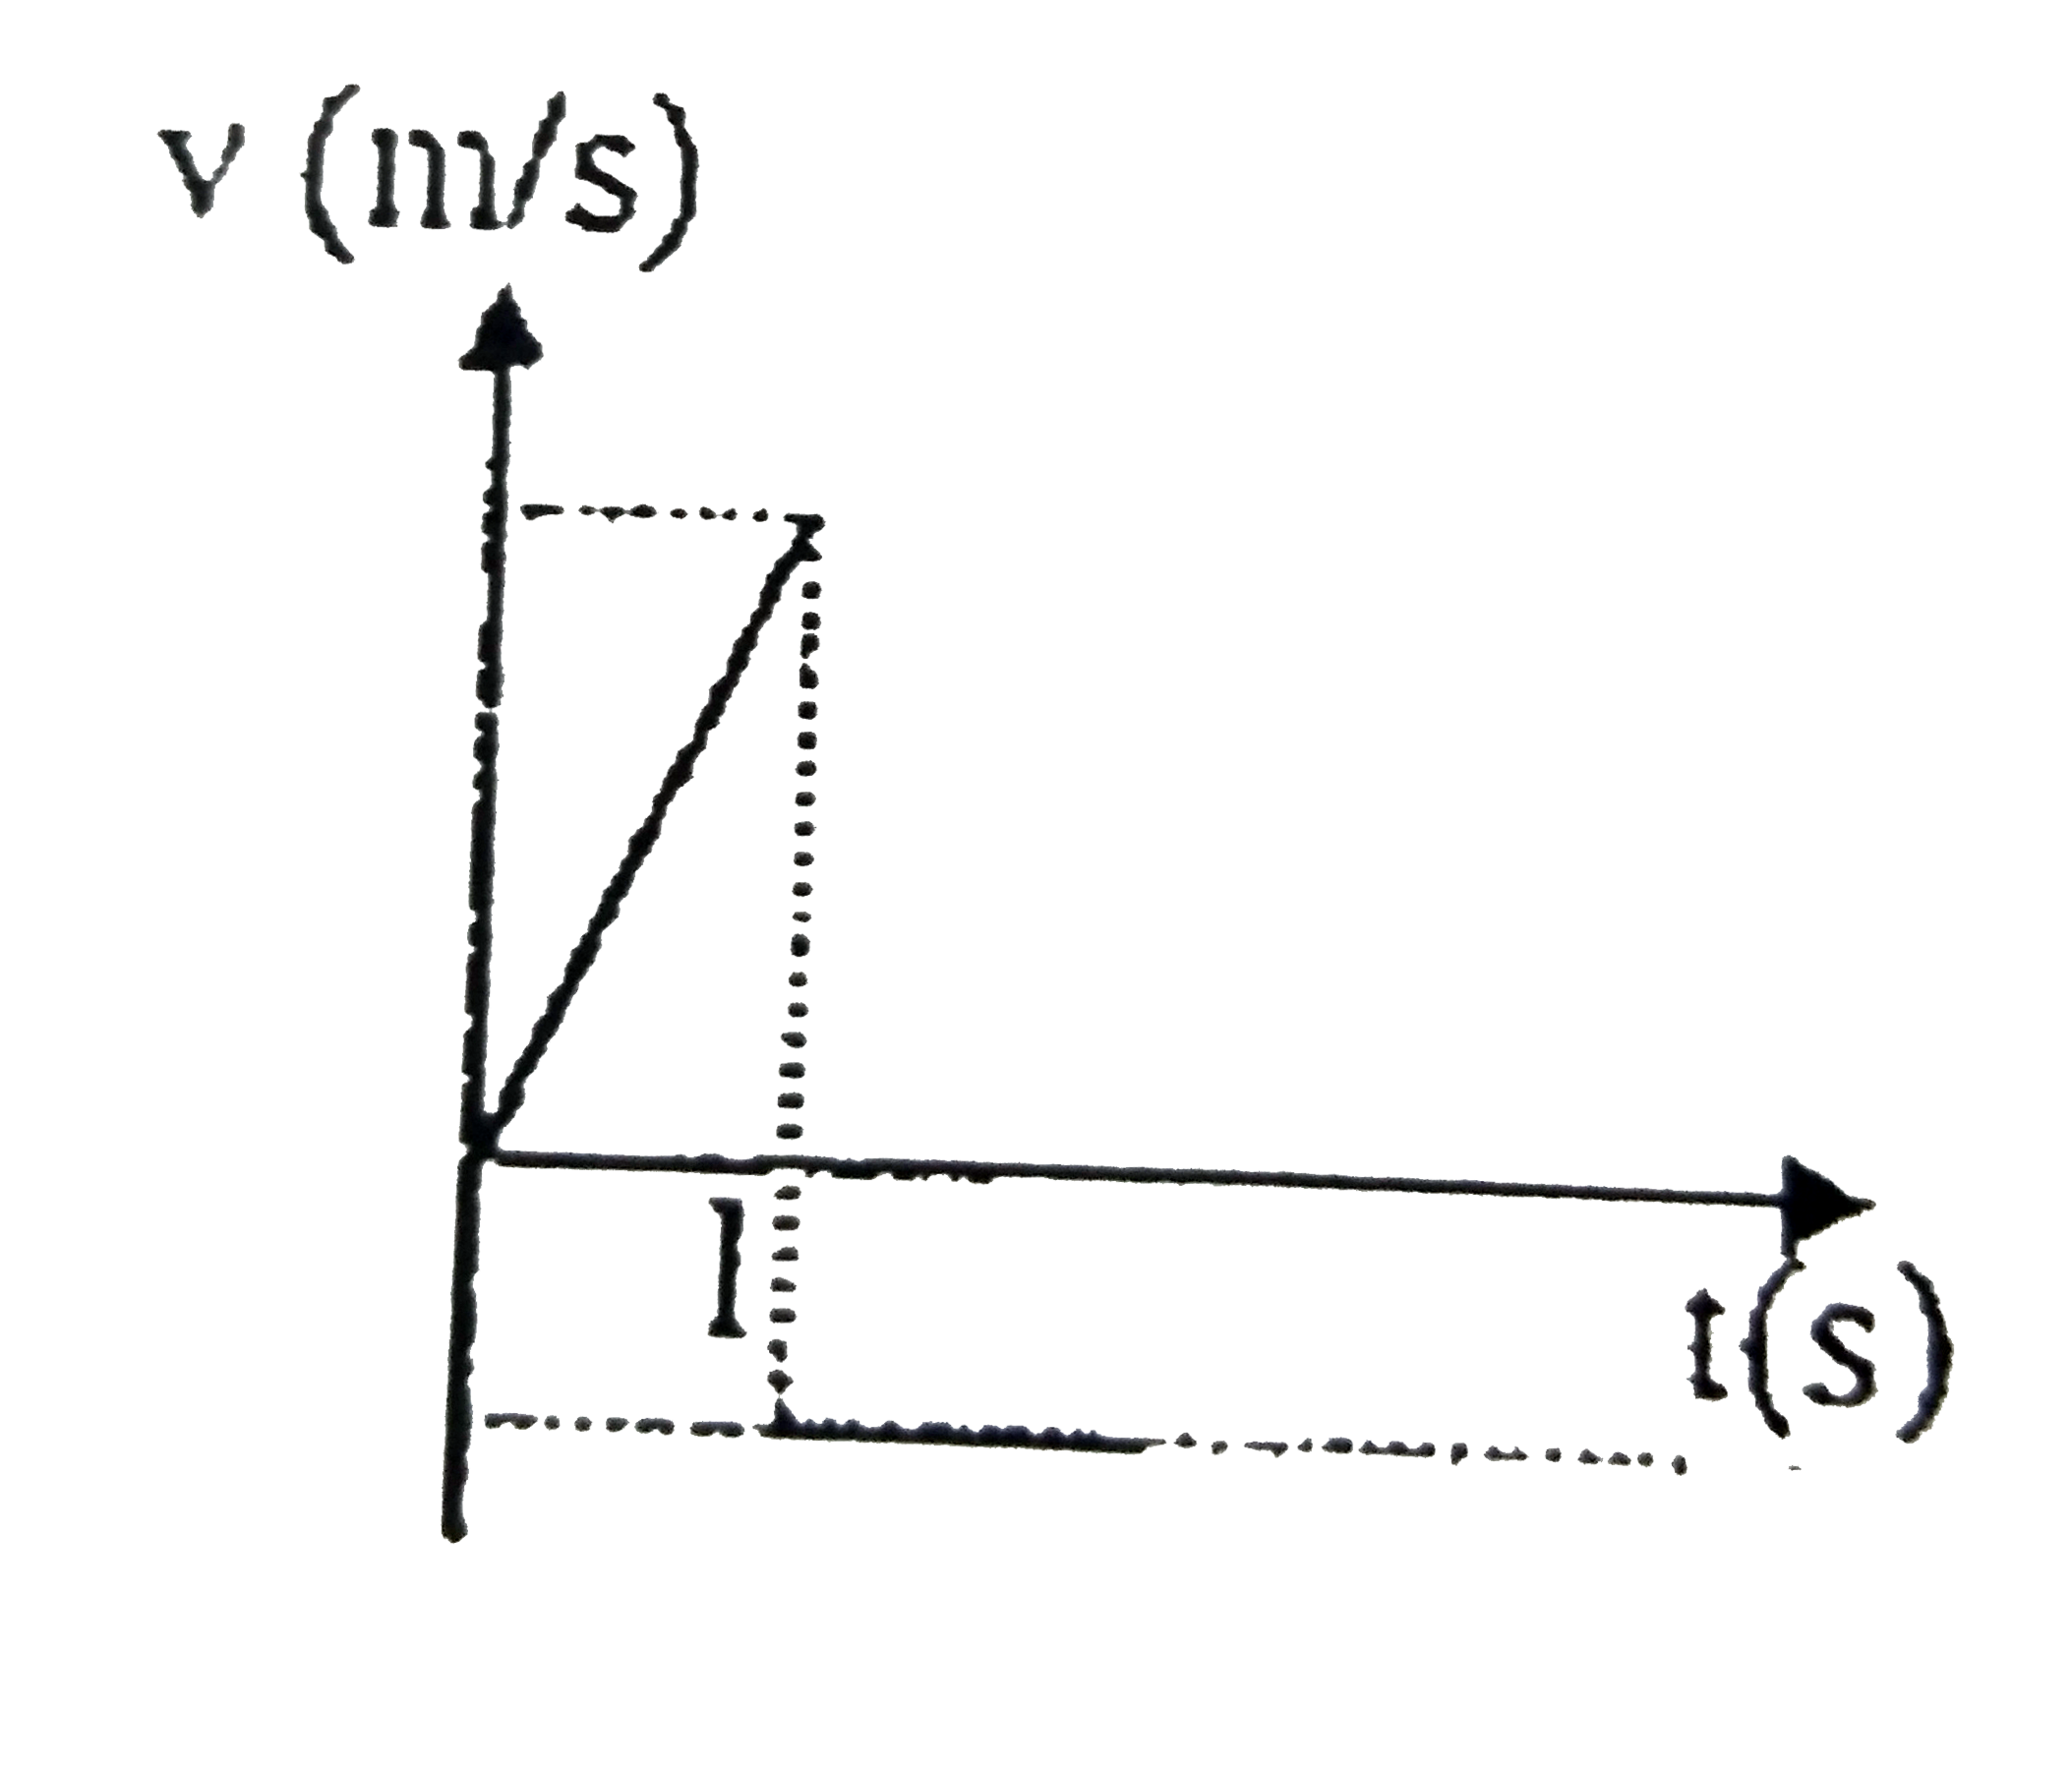
View SolutionThe velocity time graph for a particle moving along X-axis is shown in the figure. The corresponding displacement time graph is correctly shown by
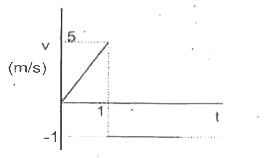
View SolutionThe velocity time graph for a particle moving along x-axis is shown in the figure. The corresponding displacement time graph is correctly shown by
View SolutionThe kinetic energy K of a particle moving along x - axis varies its position (x) as shown in figure.
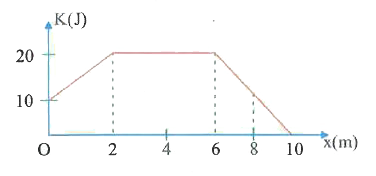
The magnitude of force acting on particle at x = 9m is
View Solution
