Consider the folllowing graph of potential energy (U) vs position (x) for a particle travelling along x−axis. No other contact force exists, as shown in figure.
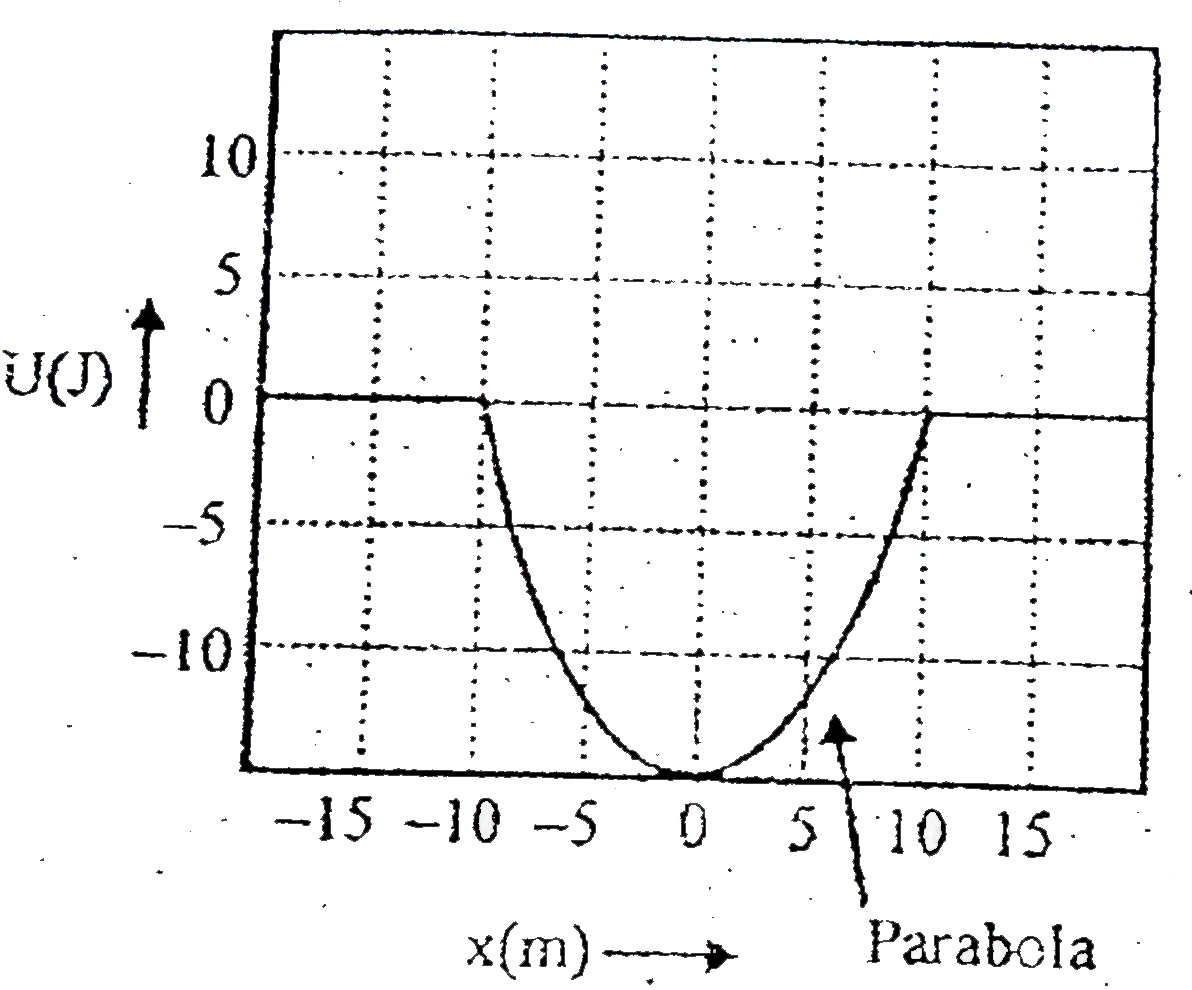
which of the following graph represents teh force corresponding to the given potential ?
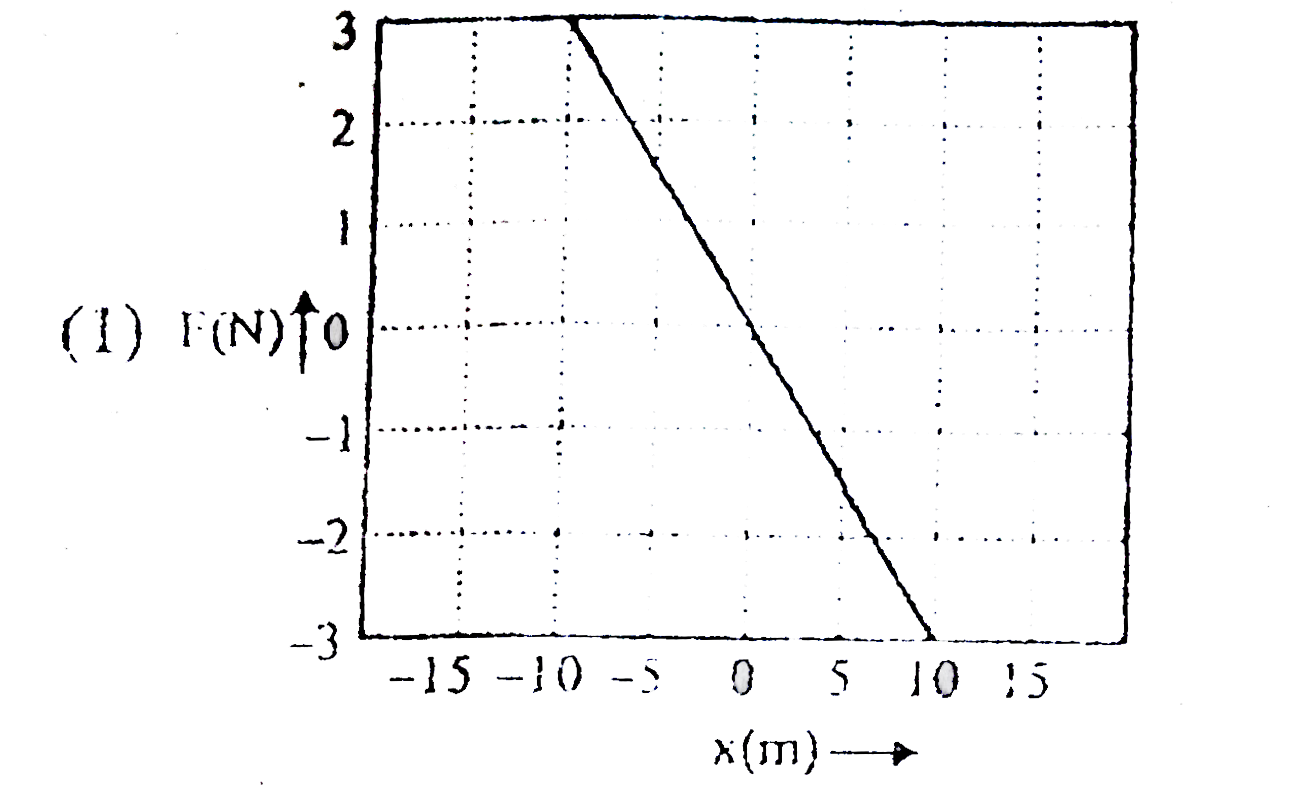
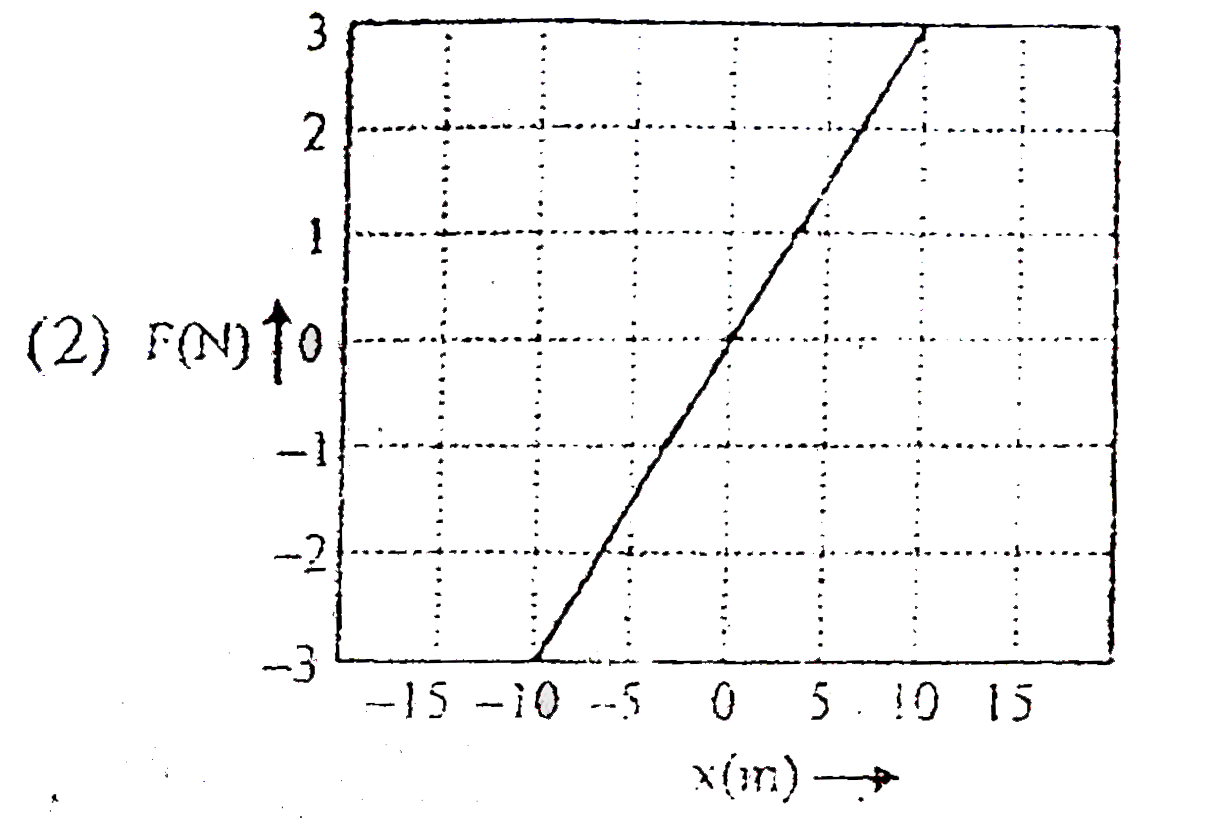
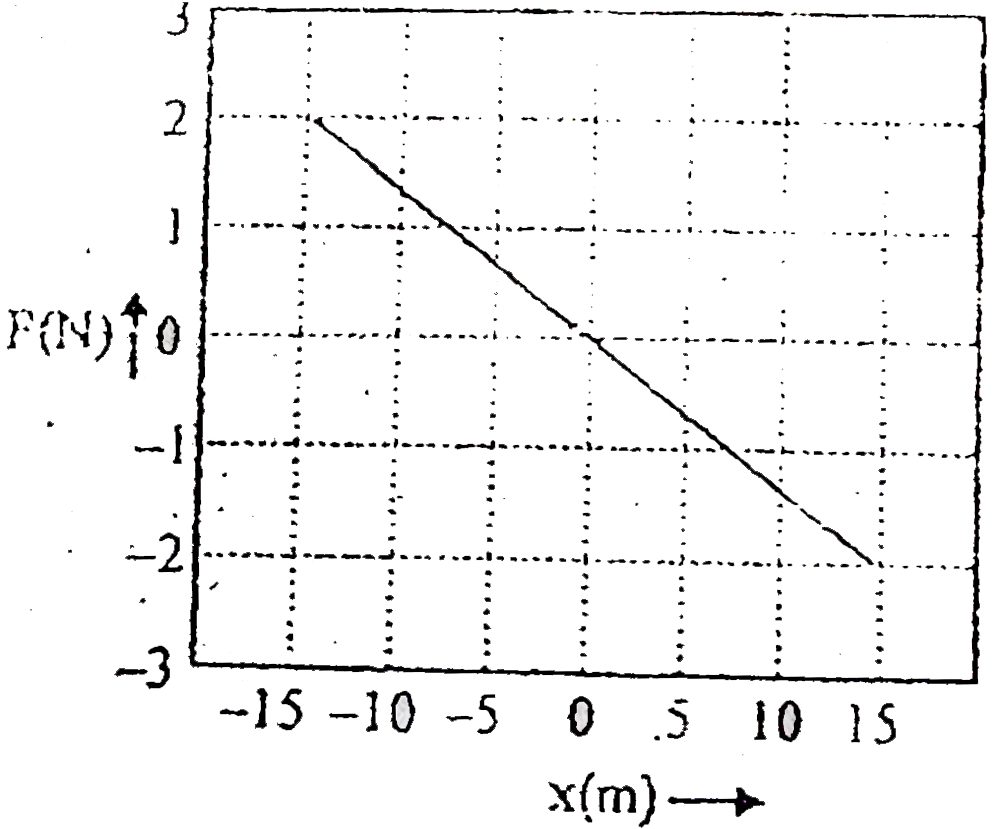
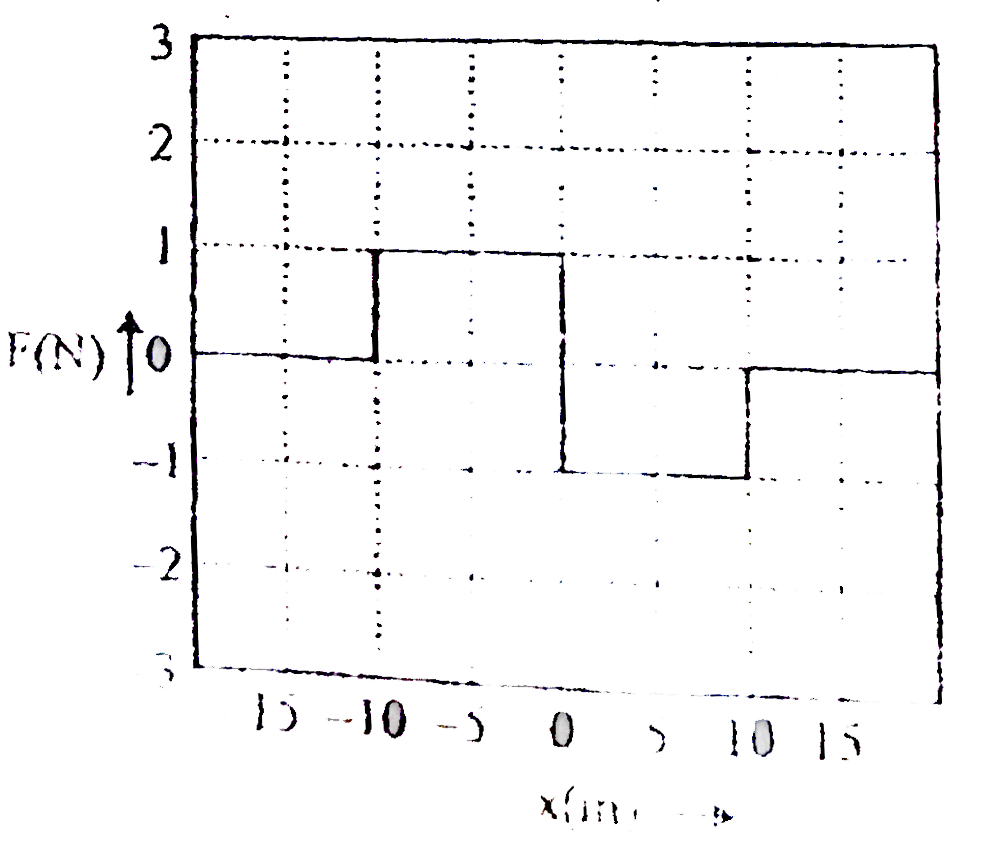
The correct Answer is:A
Fx=−dUdx
Topper's Solved these Questions
- TEST PAPERBook:ALLENChapter:TEST PAPERExercise:PHYSICS
Explore 4 Videos
- TEST PAPERBook:ALLENChapter:TEST PAPERExercise:PHYSICS
Explore 4 Videos
- SIMPLE HARMONIC MOTIONBook:ALLENChapter:SIMPLE HARMONIC MOTIONExercise:Example
Explore 1 Video
- TEST PAPER 1Book:ALLENChapter:TEST PAPER 1Exercise:PHYSICS
Explore 11 Videos
Similar Questions
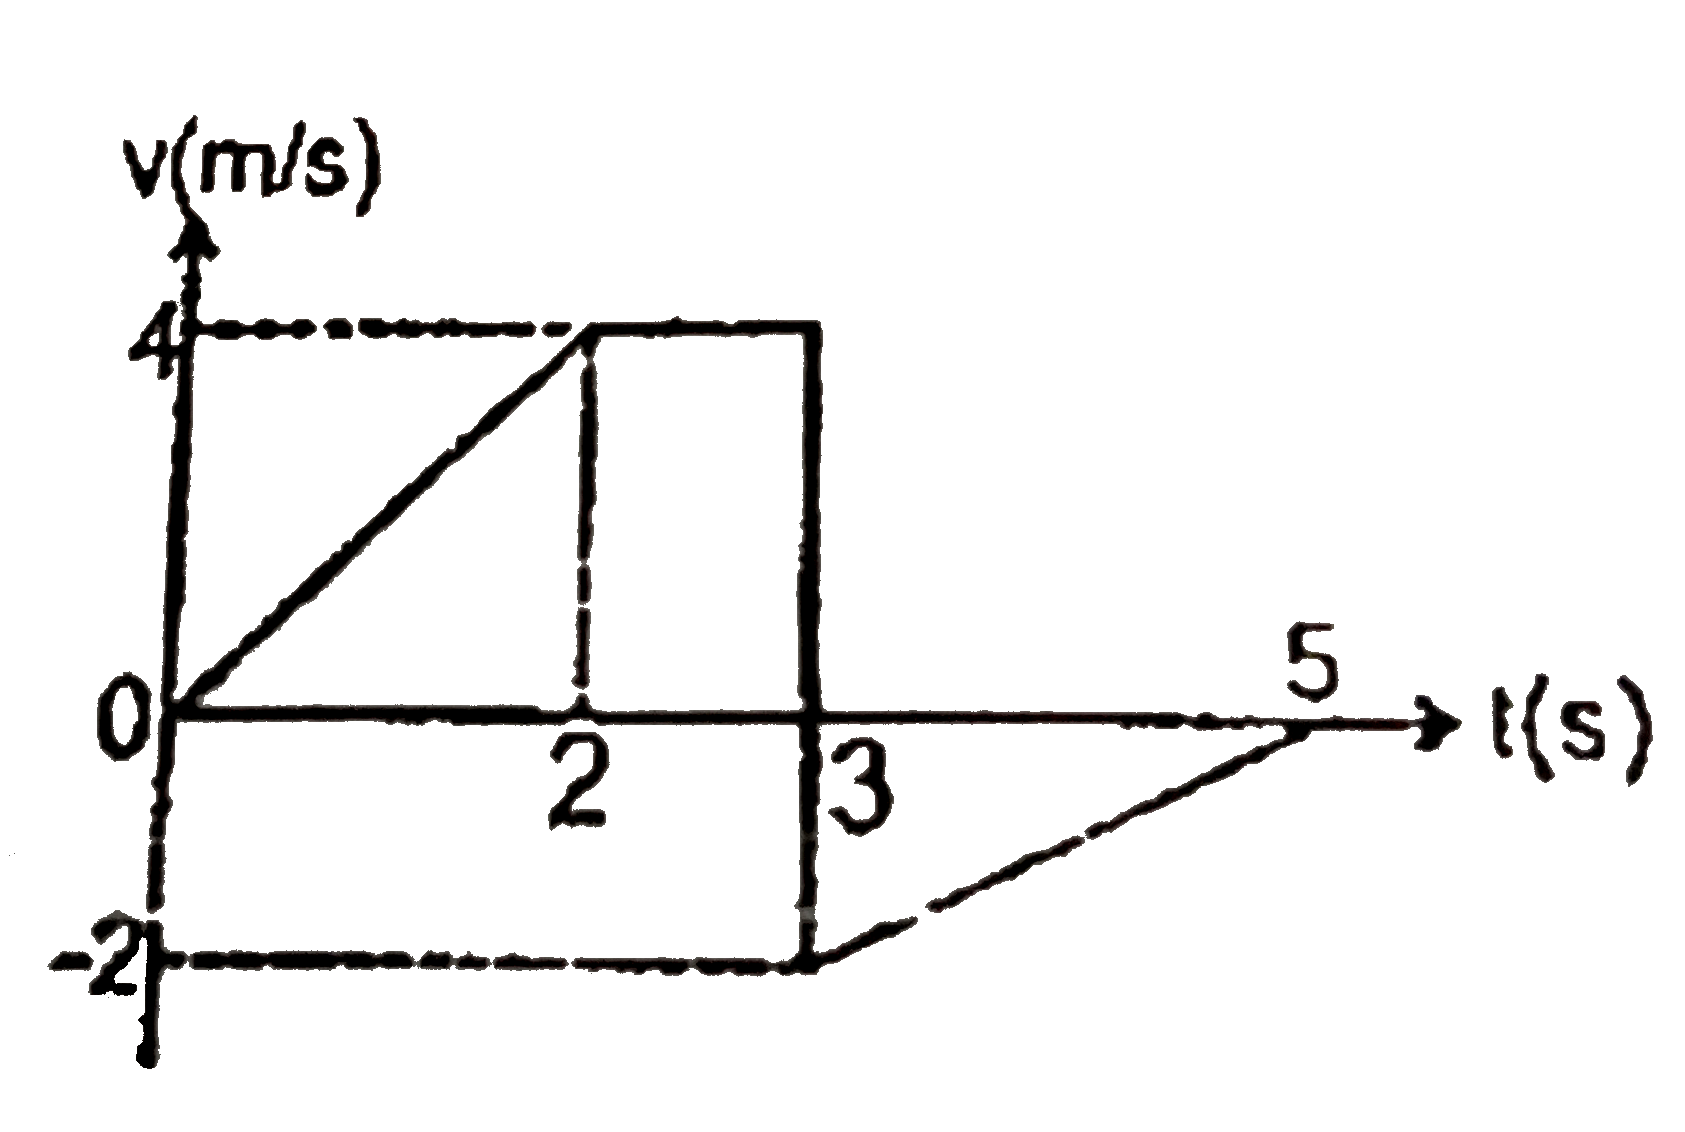
For a particle moving along x-axis, velocity-time graph is as shown in figure. Find the displacement of the particle?
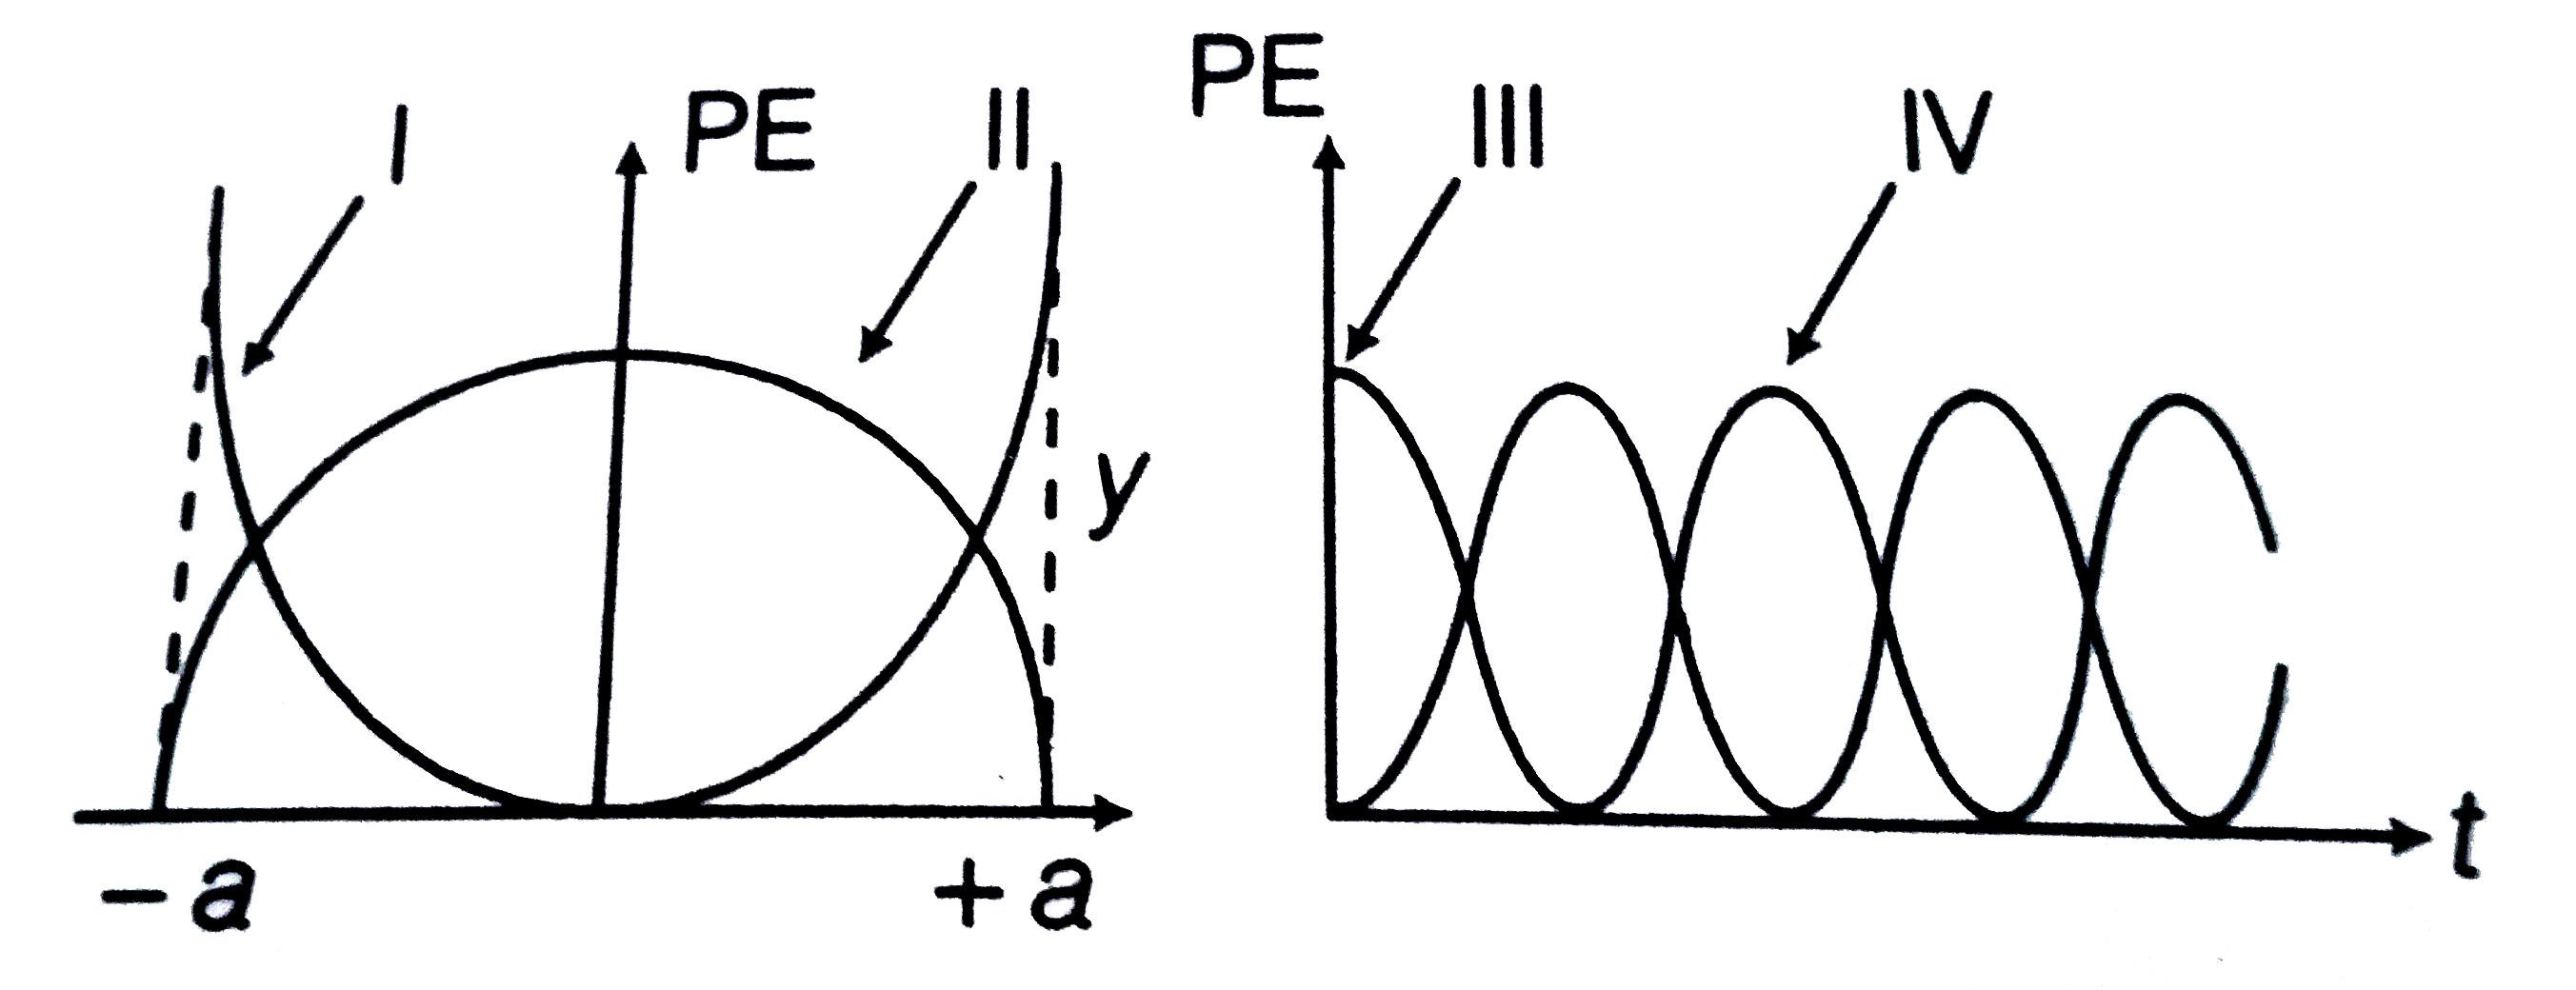
View SolutionIf for a particle executing SHM, the equation of SHM is given as y=acosωt. Then which of the following graphs represents the variation in potential energy?
View Solution
Knowledge Check
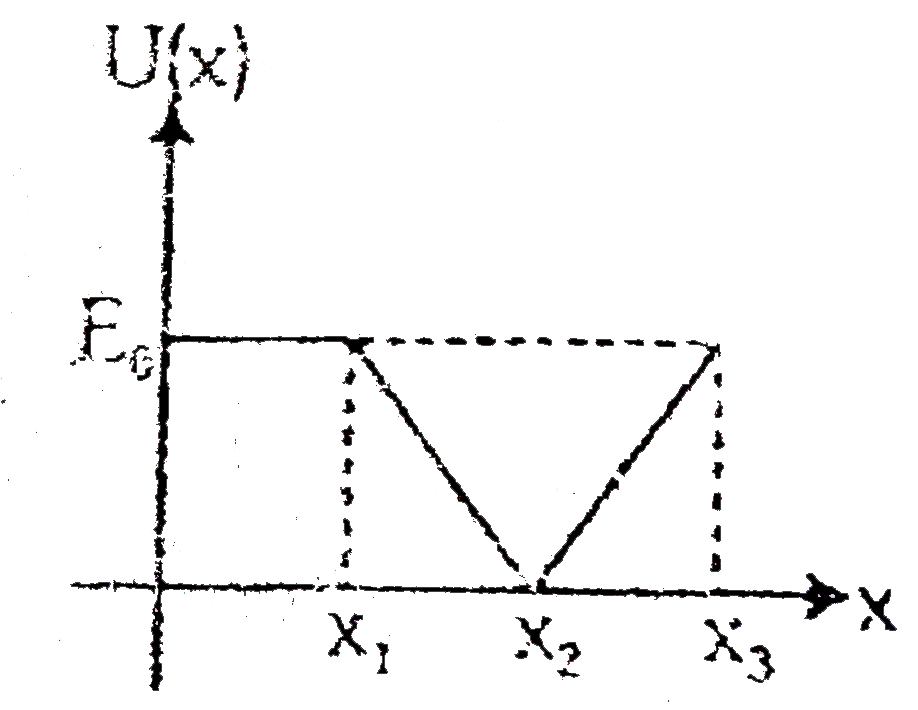
The potential energy U(x) of a particle moving along x−axis is shown in figure. Which one of the following graphs represents the variation of kinetic energy of this particel if its total mechanical enery is E0
 A
A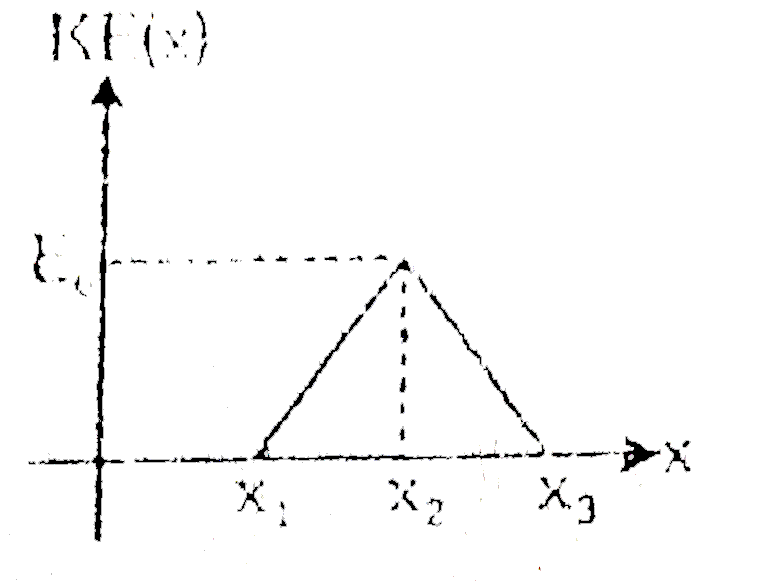 B
B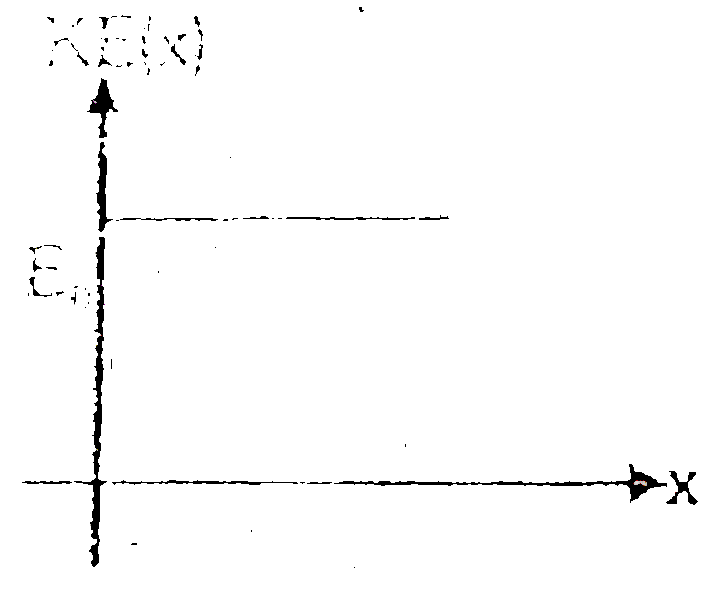 C
C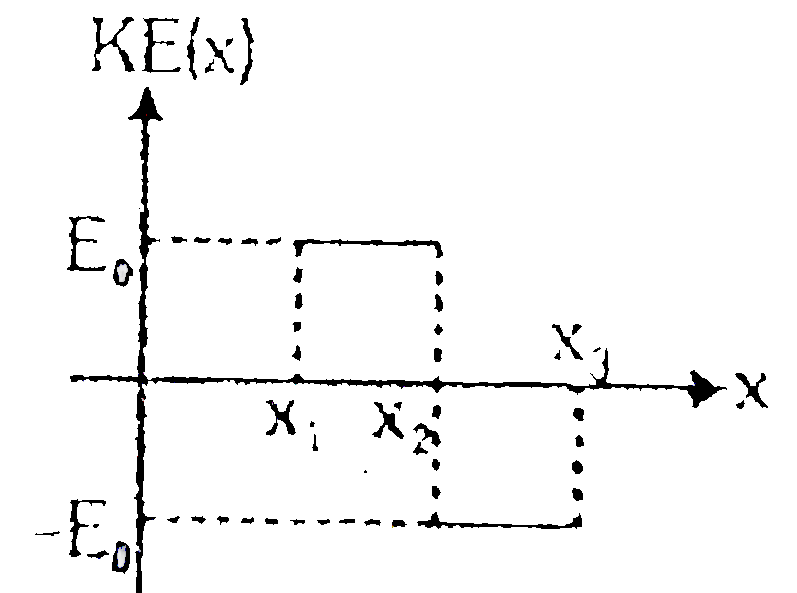 D
D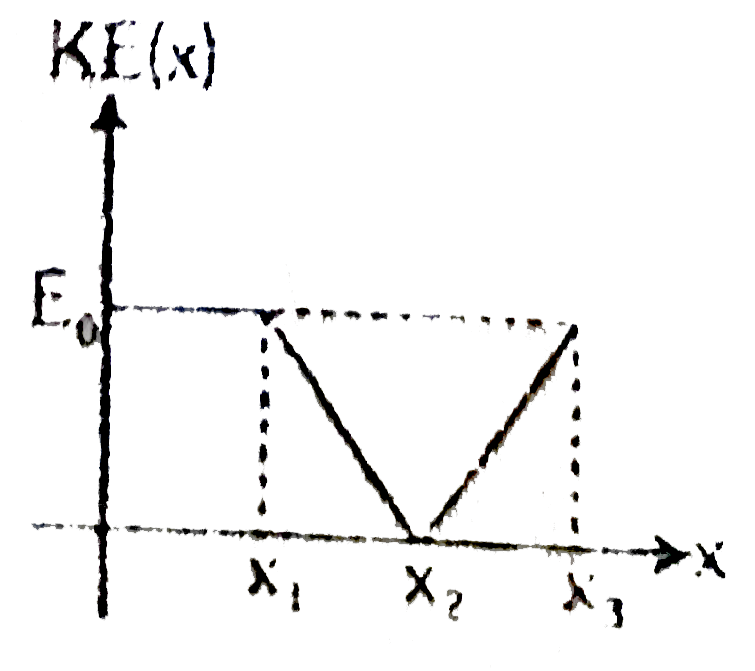
The potential energy in given according to the following graph.

Which of the following graph represent the force?A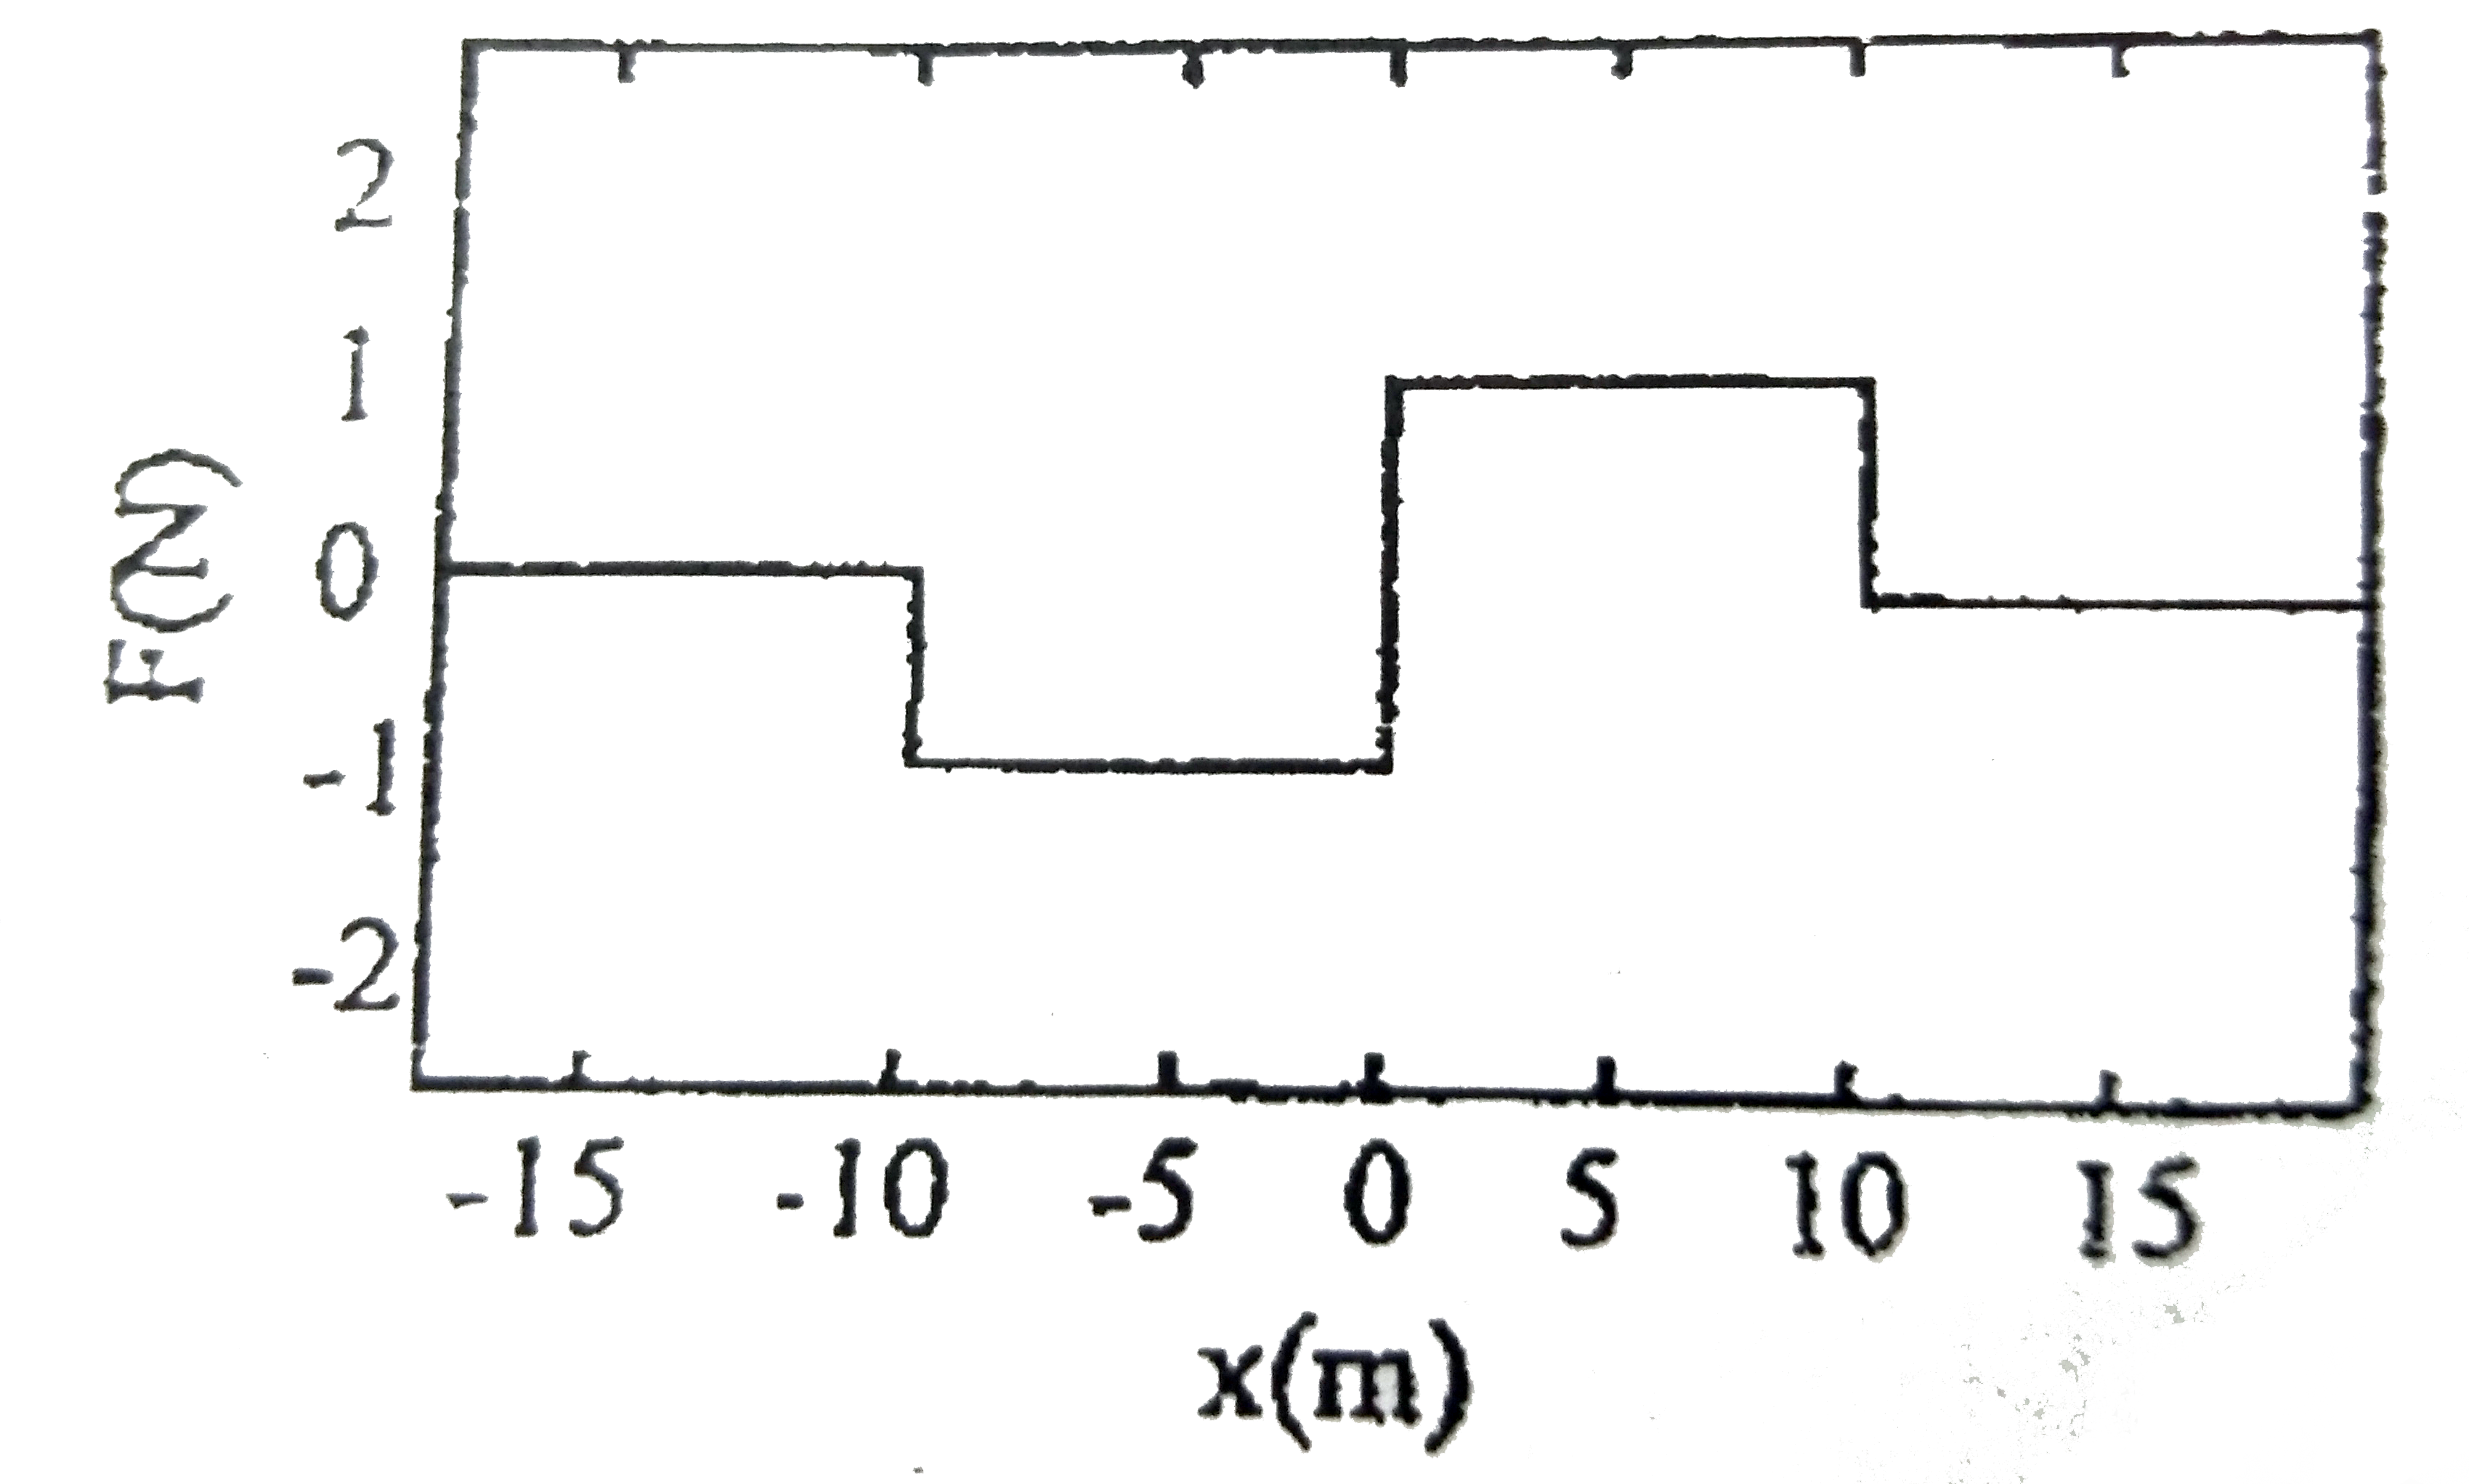 B
B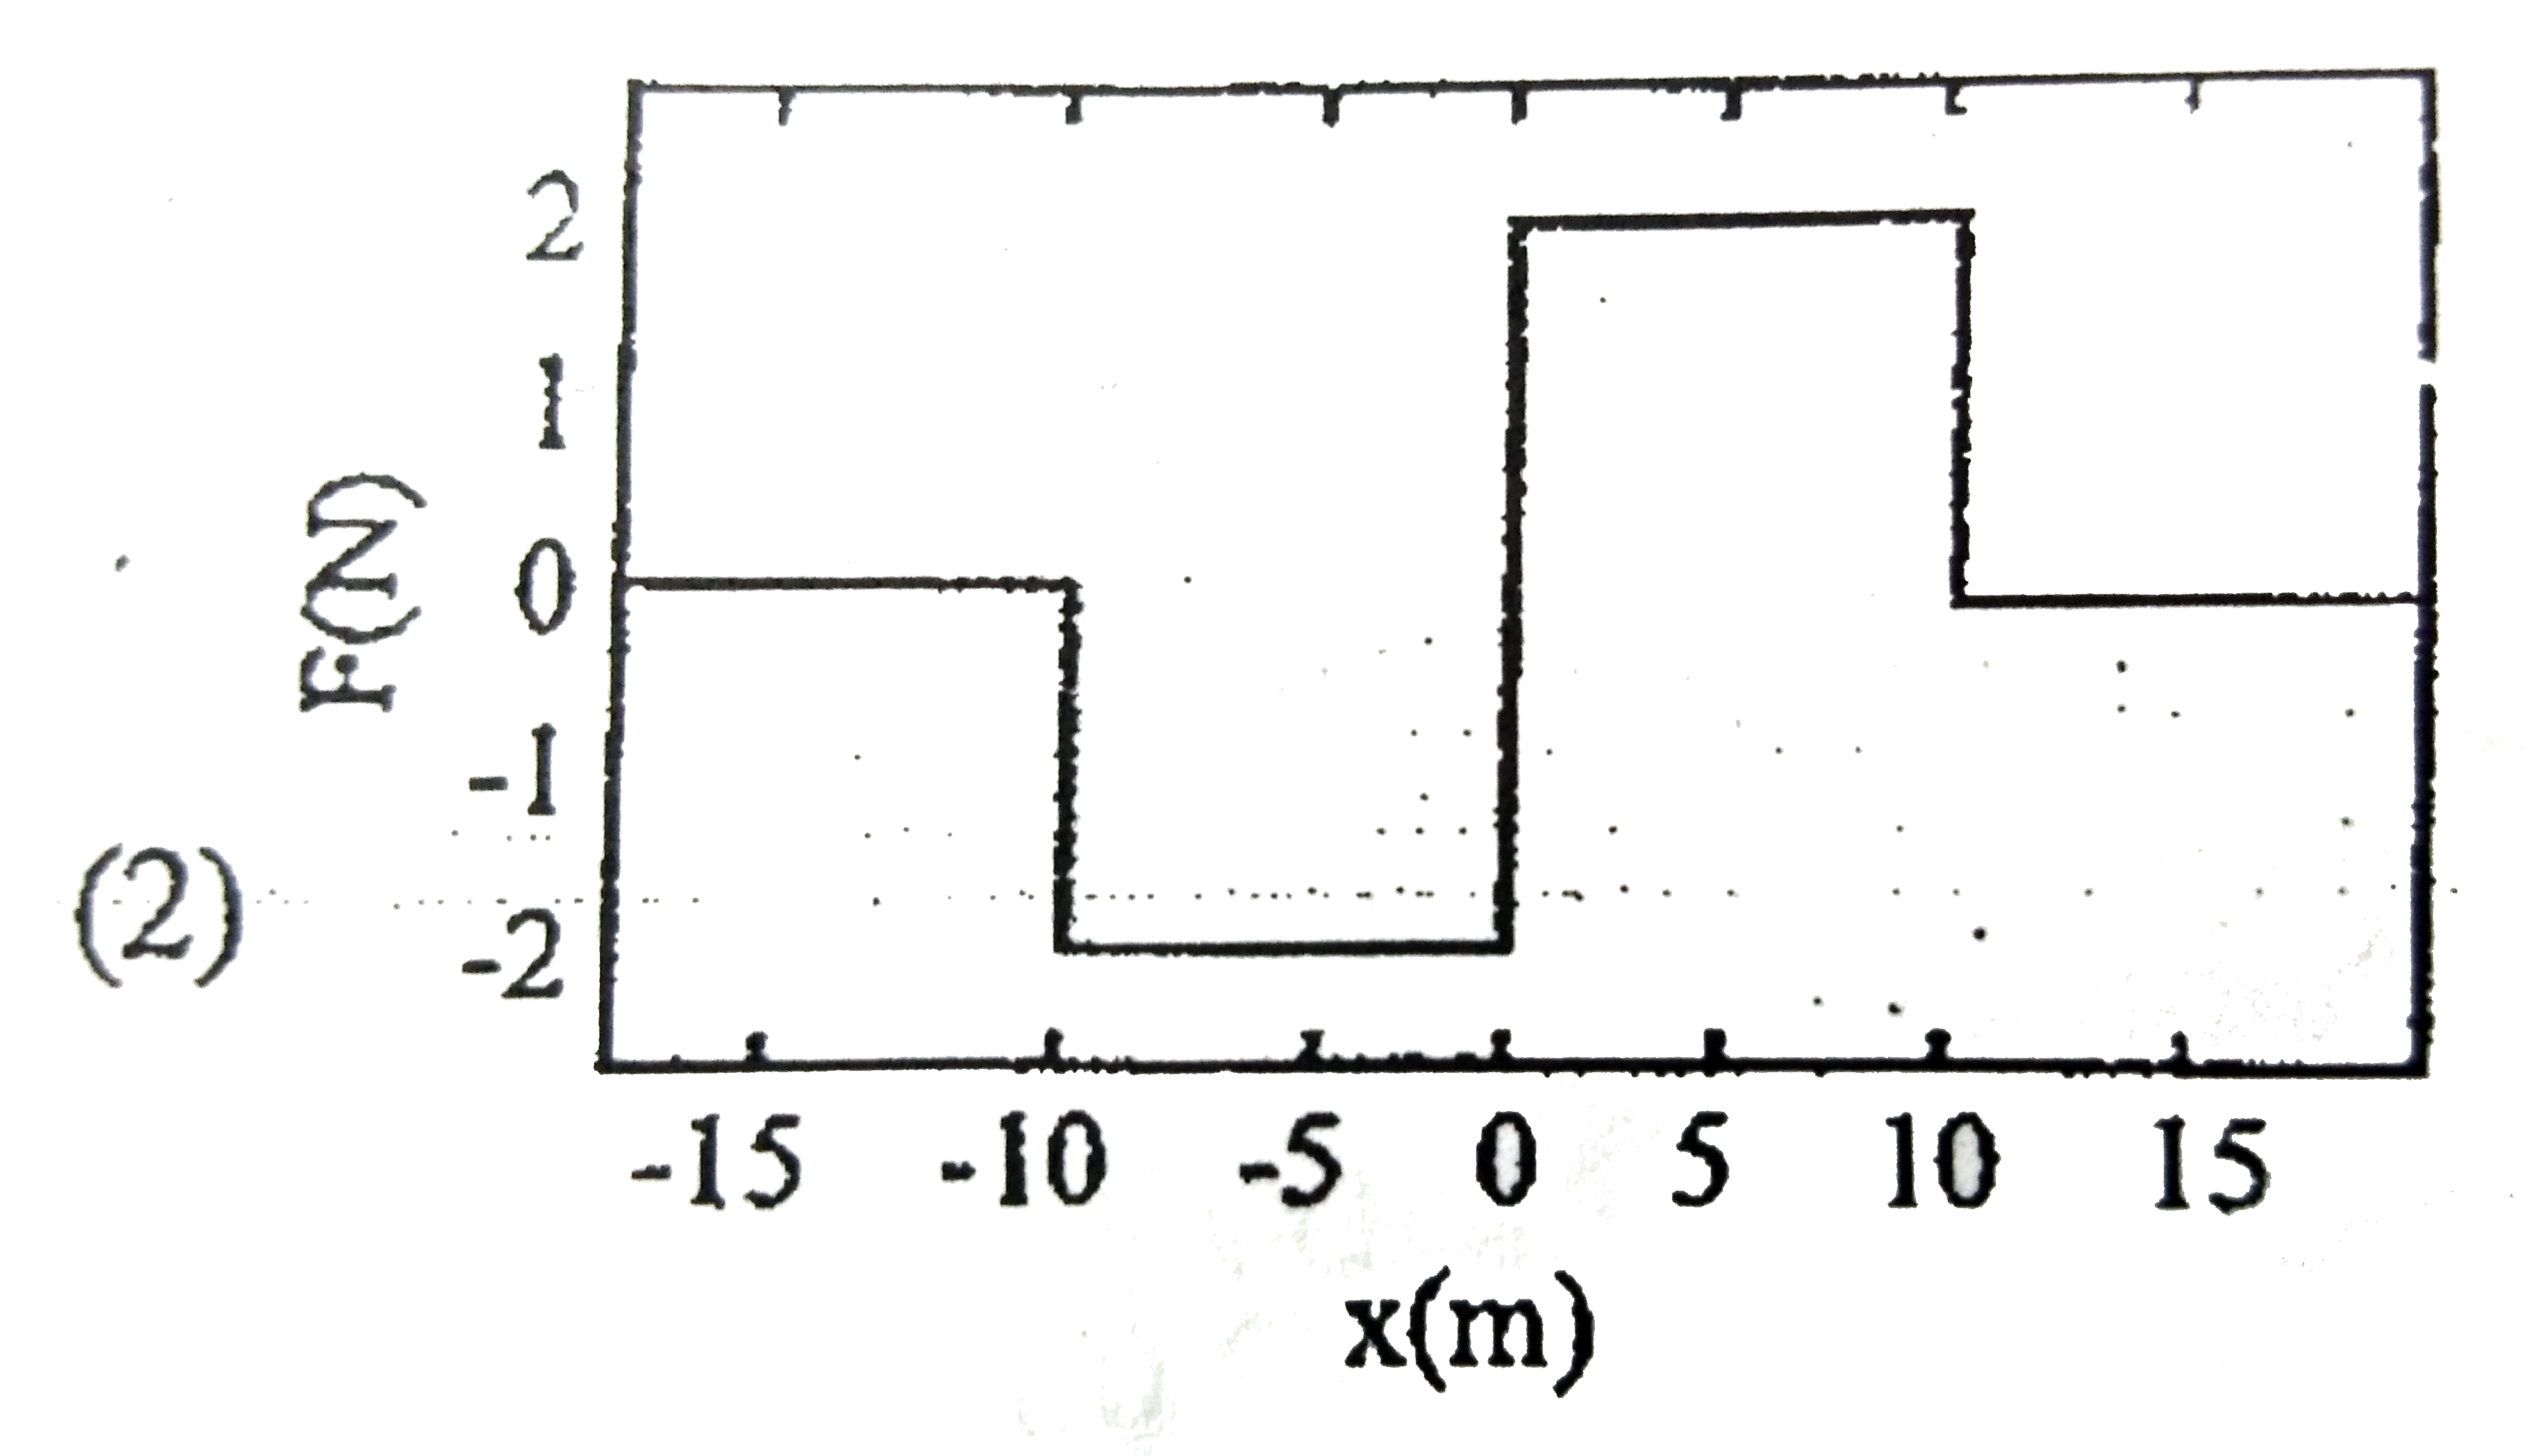 C
C D
D
For a particle moving along x-axis, a scaled x-6 graph is shown in figure. Mark the correct statement (s).
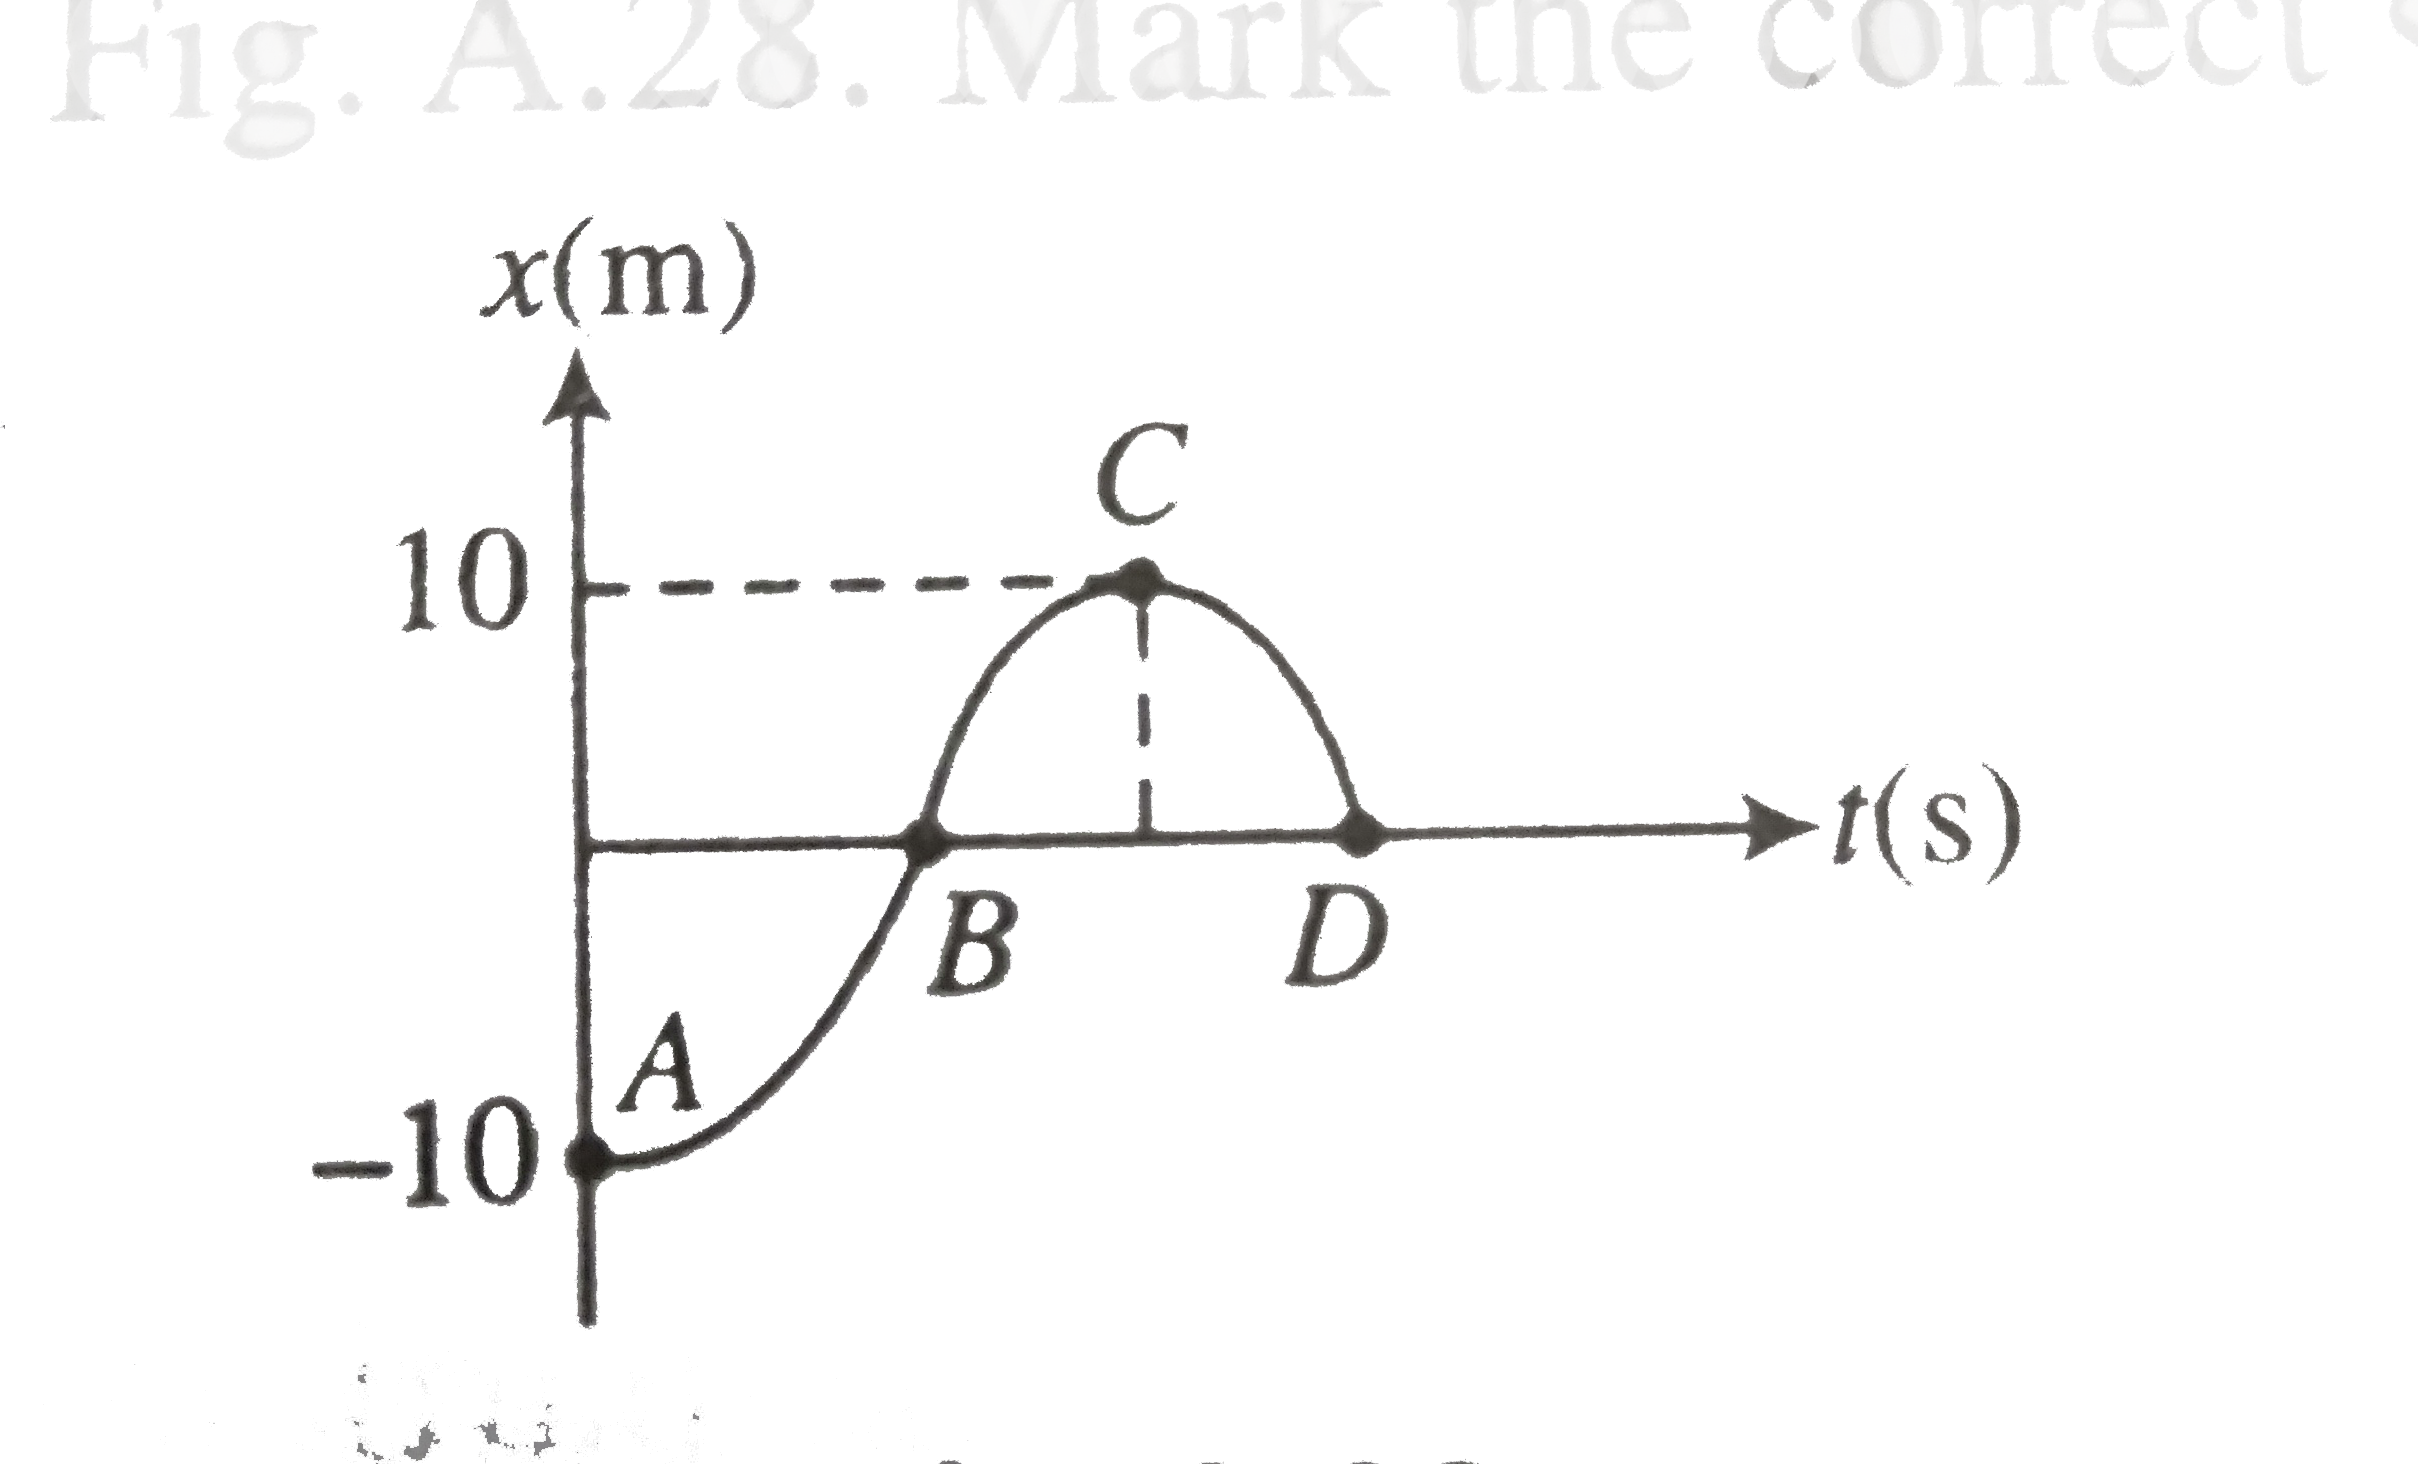 ASpeed of the particle is greatest at C.BSpeed of the particle is greatest at B.CParticle is speeding up in region marked CD.DParticle is speeding up in region marked AB.
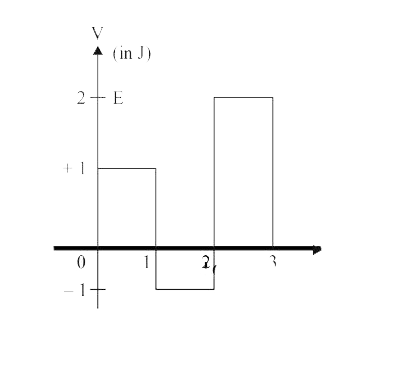
The potential energy ‘V’ of a particle moving along the positive x-direction in a conservative force field varies as shown in the figure. The total energy is E=2. Draw the corresponding kinetic energy K vs x graph.
View SolutionThe kinetic energy (KE) versus time graph for a particle moving along a straight line is as shown in the figure. The force versus time graph for the particle may be

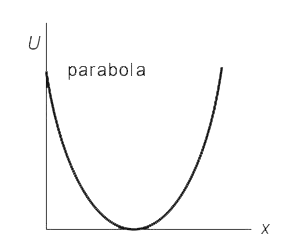
View SolutionThe first graph shows the potential energy U(x) for a particle moving on the x axis. Which of the other four graphs correctly gives the force F exerted on the particle?
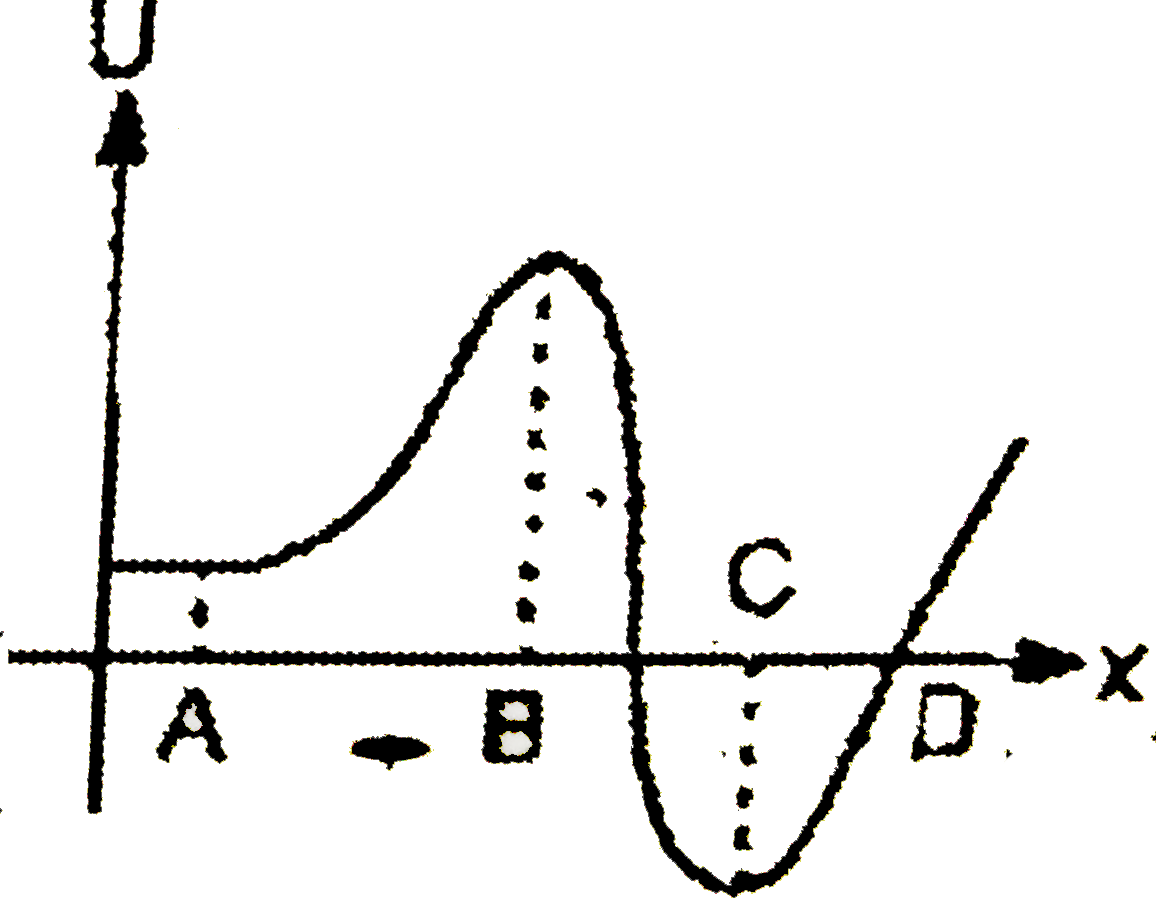
View SolutionThe following plot shows the variation of potential energy (U) of a system versus position (x). From the graph we can interpret that :
View SolutionA particle is moving along X-axis under a force such that its position -time graph is as shown in figure.

As the particle passes position (1):
View Solution