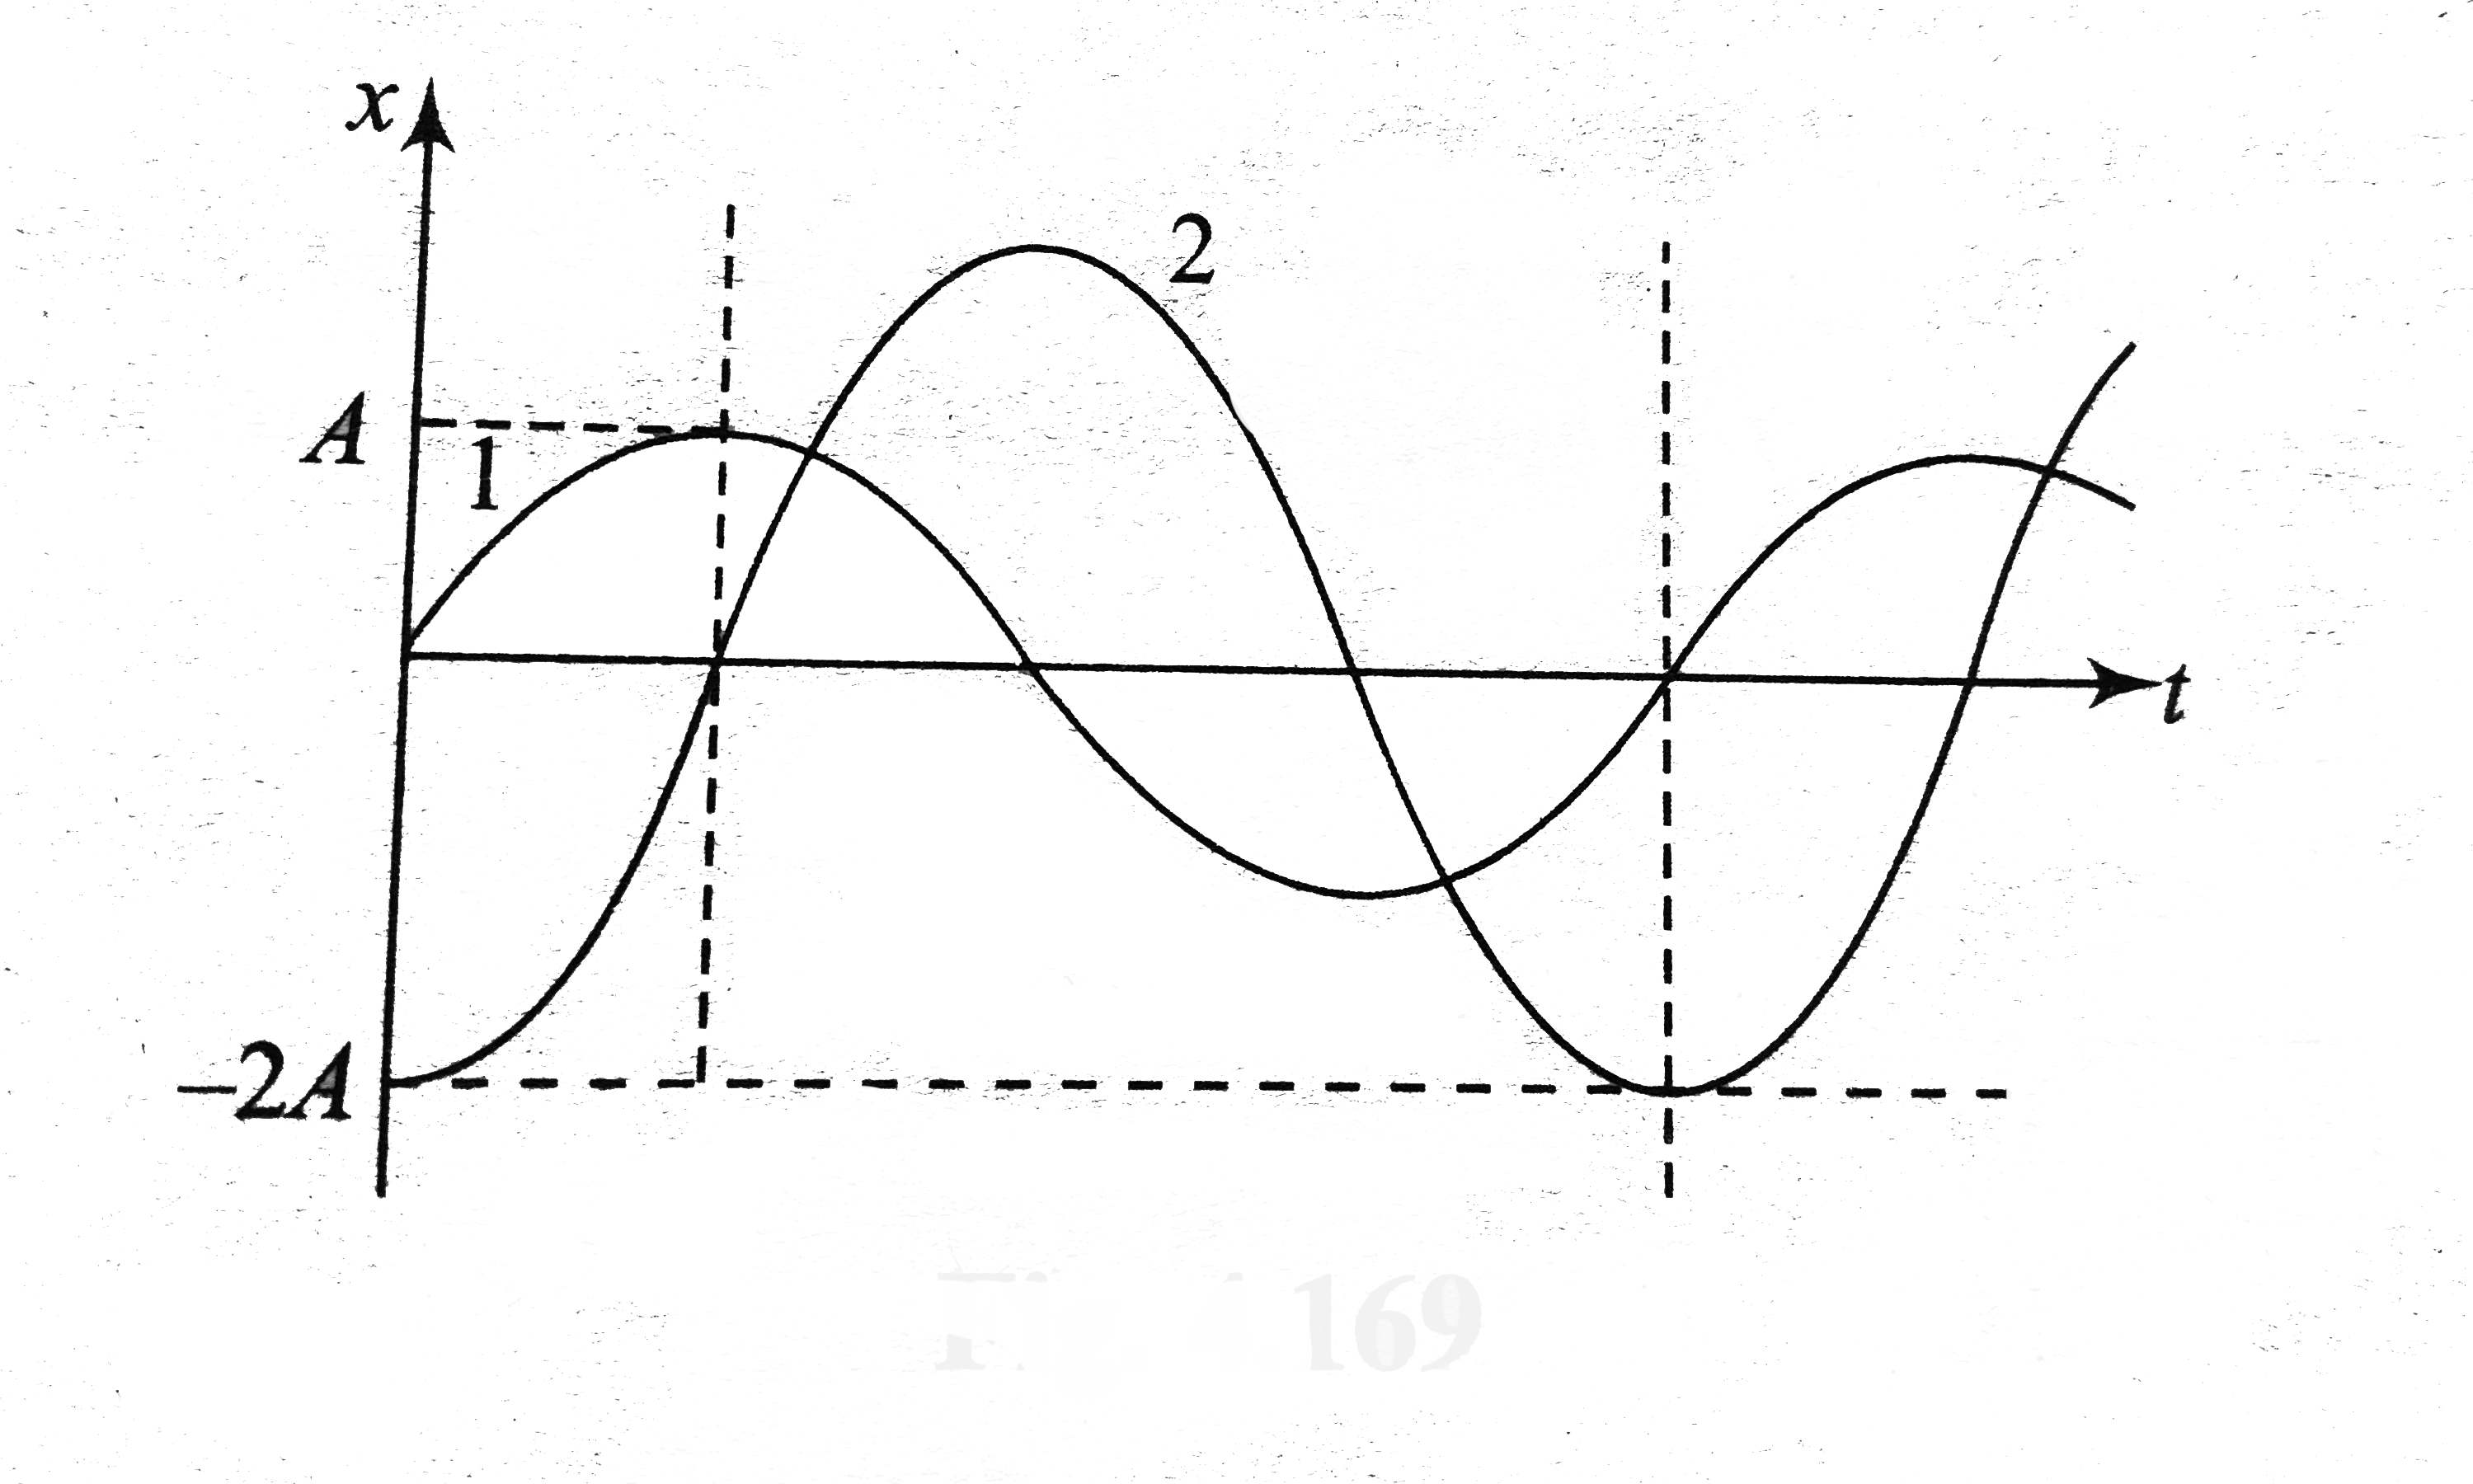
The oscillations represented by curve 1 in the graph are expressed by equationx=Asinωt. The equation for the oscillation represented by curve 2 is expressed as
A
x=2Asin(ωt−π2)
B
x=2Asin(ωt+π2)
C
x=−2Asin(ωt−π2)
D
x=Asin(ωt−π2)
Video Solution
Text Solution
The correct Answer is:A
Oscillation 1 has amplitude =A,2 has amplitude =2A
But (2) lags by phase π2. Also, putting t=0 in option A.X=−2A
|
Topper's Solved these Questions
Similar Questions
Knowledge Check
The osciallations represented by curve 1 in the graph are expressed by equation x=Asinεt. The equation for the oscillations represented by curve 2 is expressed as
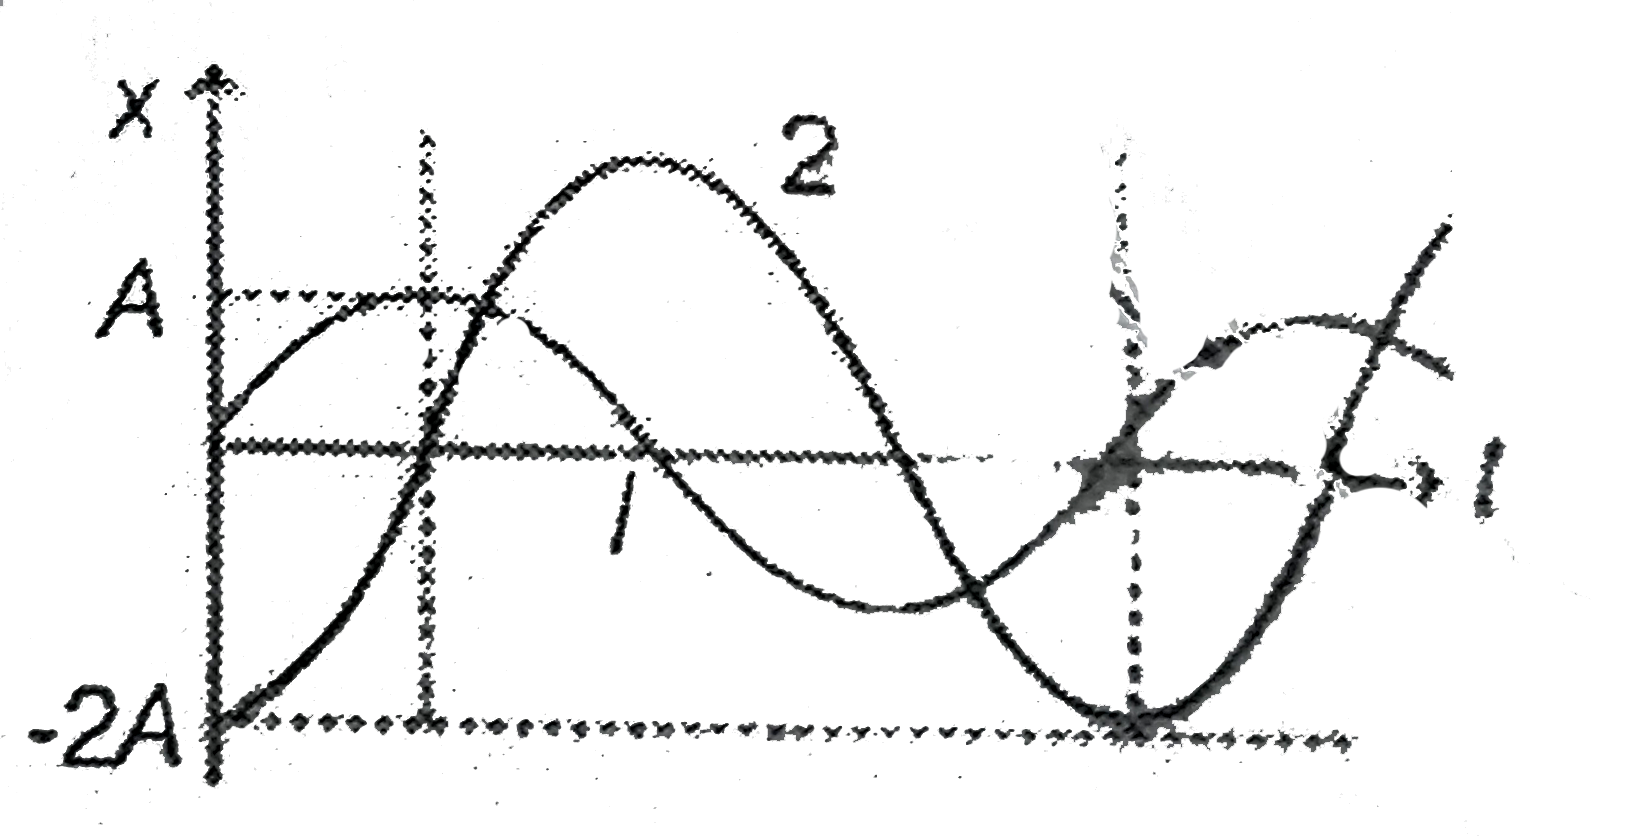 Ax=2Asin(ωt−π/2)Bx=2Asing(ωt+π/2)Cx=−2Asin(ωt−π/2)Dnone of these
The curve represented by the equations x=sin2θ,y=2cosθ is
AellipseBparabolaChyperbolaDnoneIn the given curve total area under the graph represents:
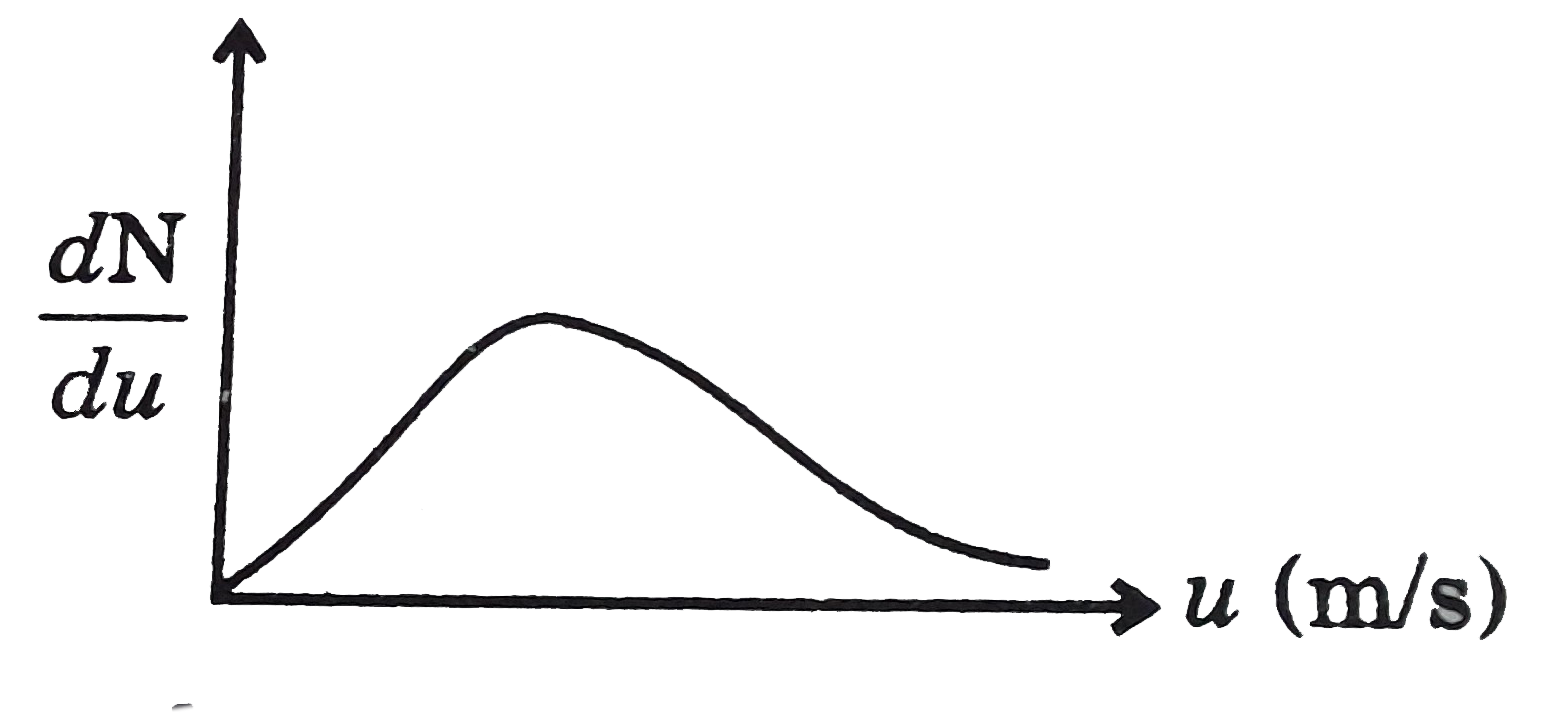 AGives number of molecules moving with certain range of velocitiesBGives fraction of moleculesCGives total number of moleculesDTotal frcation of molecules = unity
Two wave are represented by the equations y1=asinωt ad y2=acosωt the first wave
View SolutionThe differential equation of the family of curves represented by c(y+c)2=x3 is
View Solution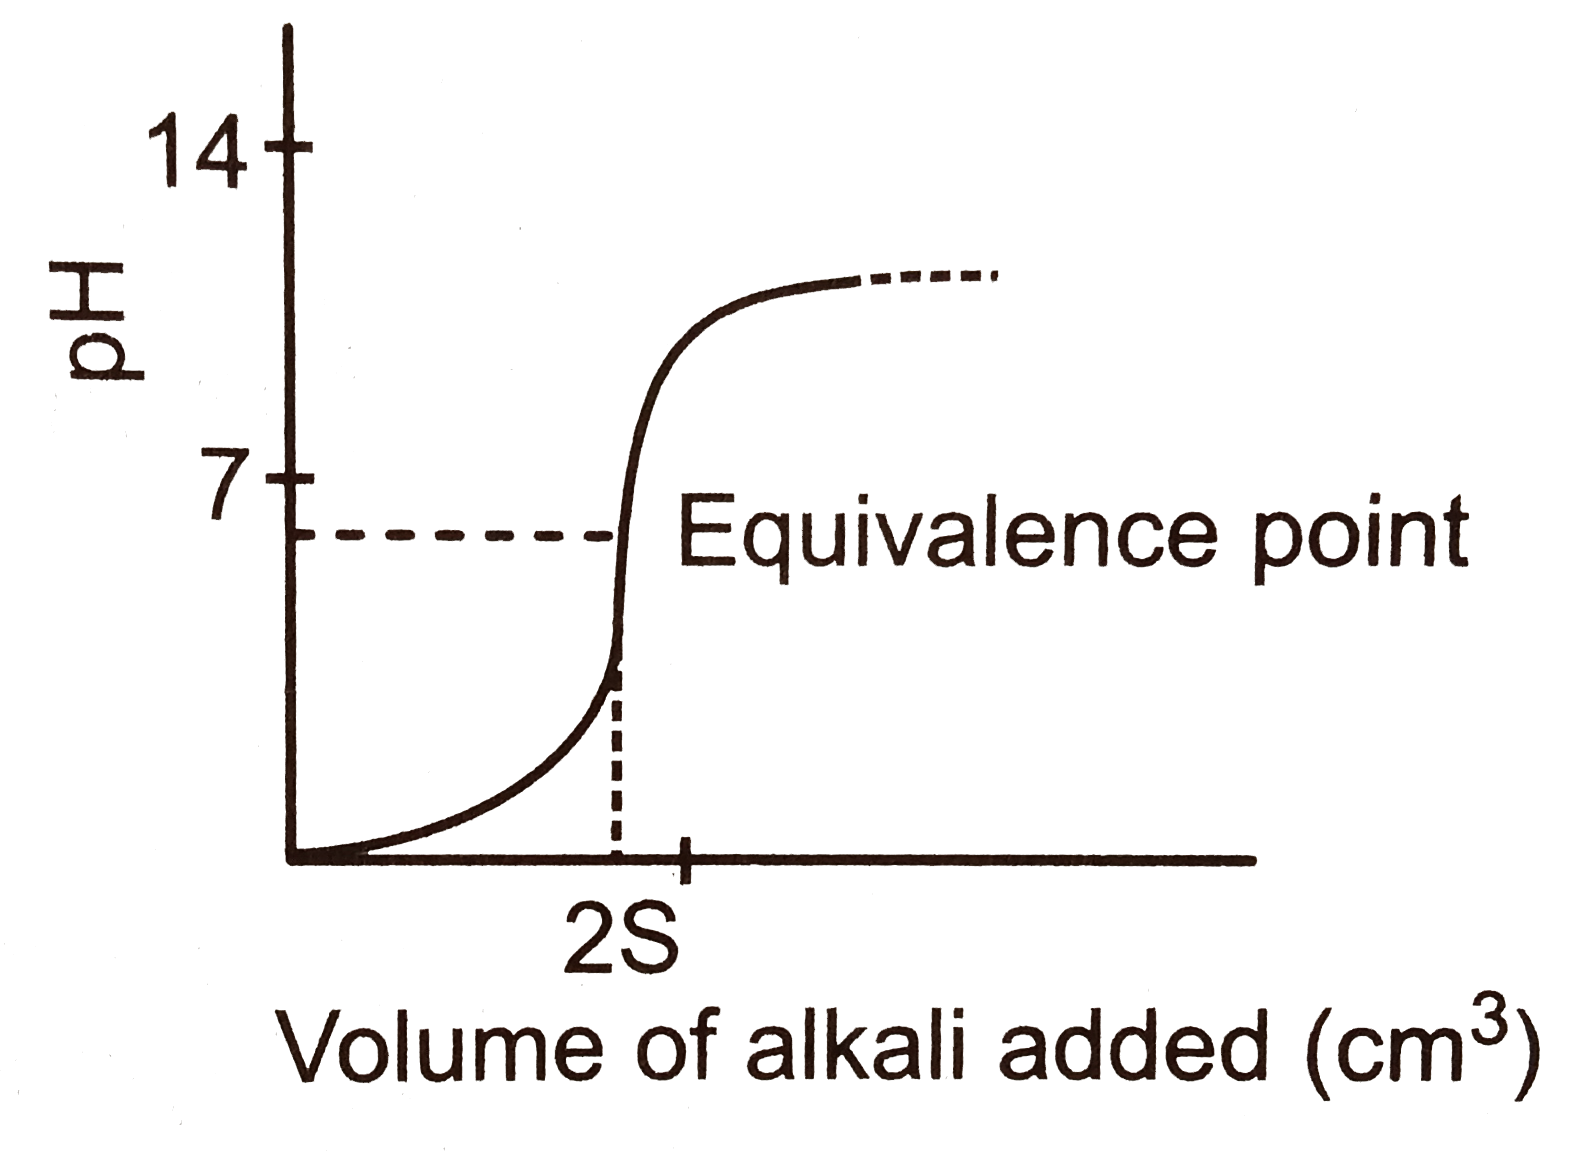
The graph represents the titration curve for :
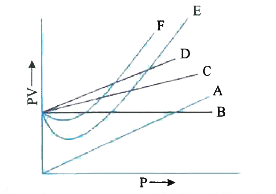
View SolutionWhich curve in the following graph represents the curve of ideal gas ?
View SolutionA graph of linear equation always represents a :
View Solution
