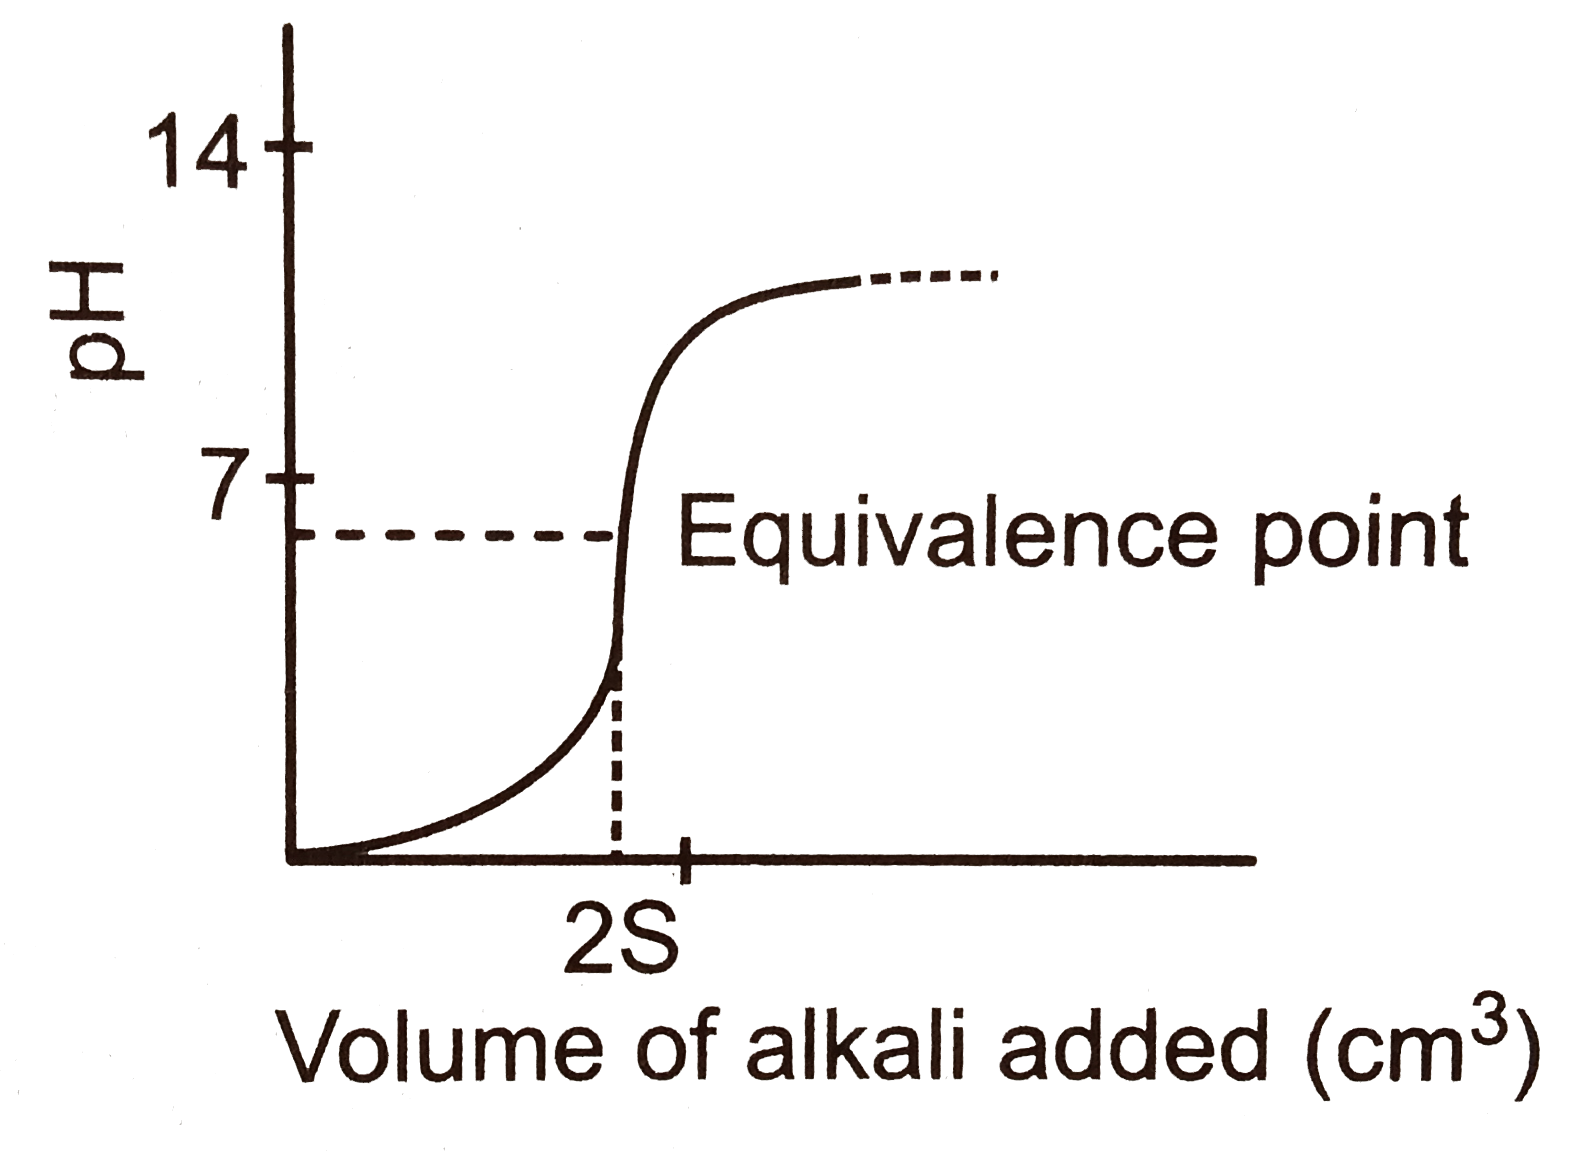
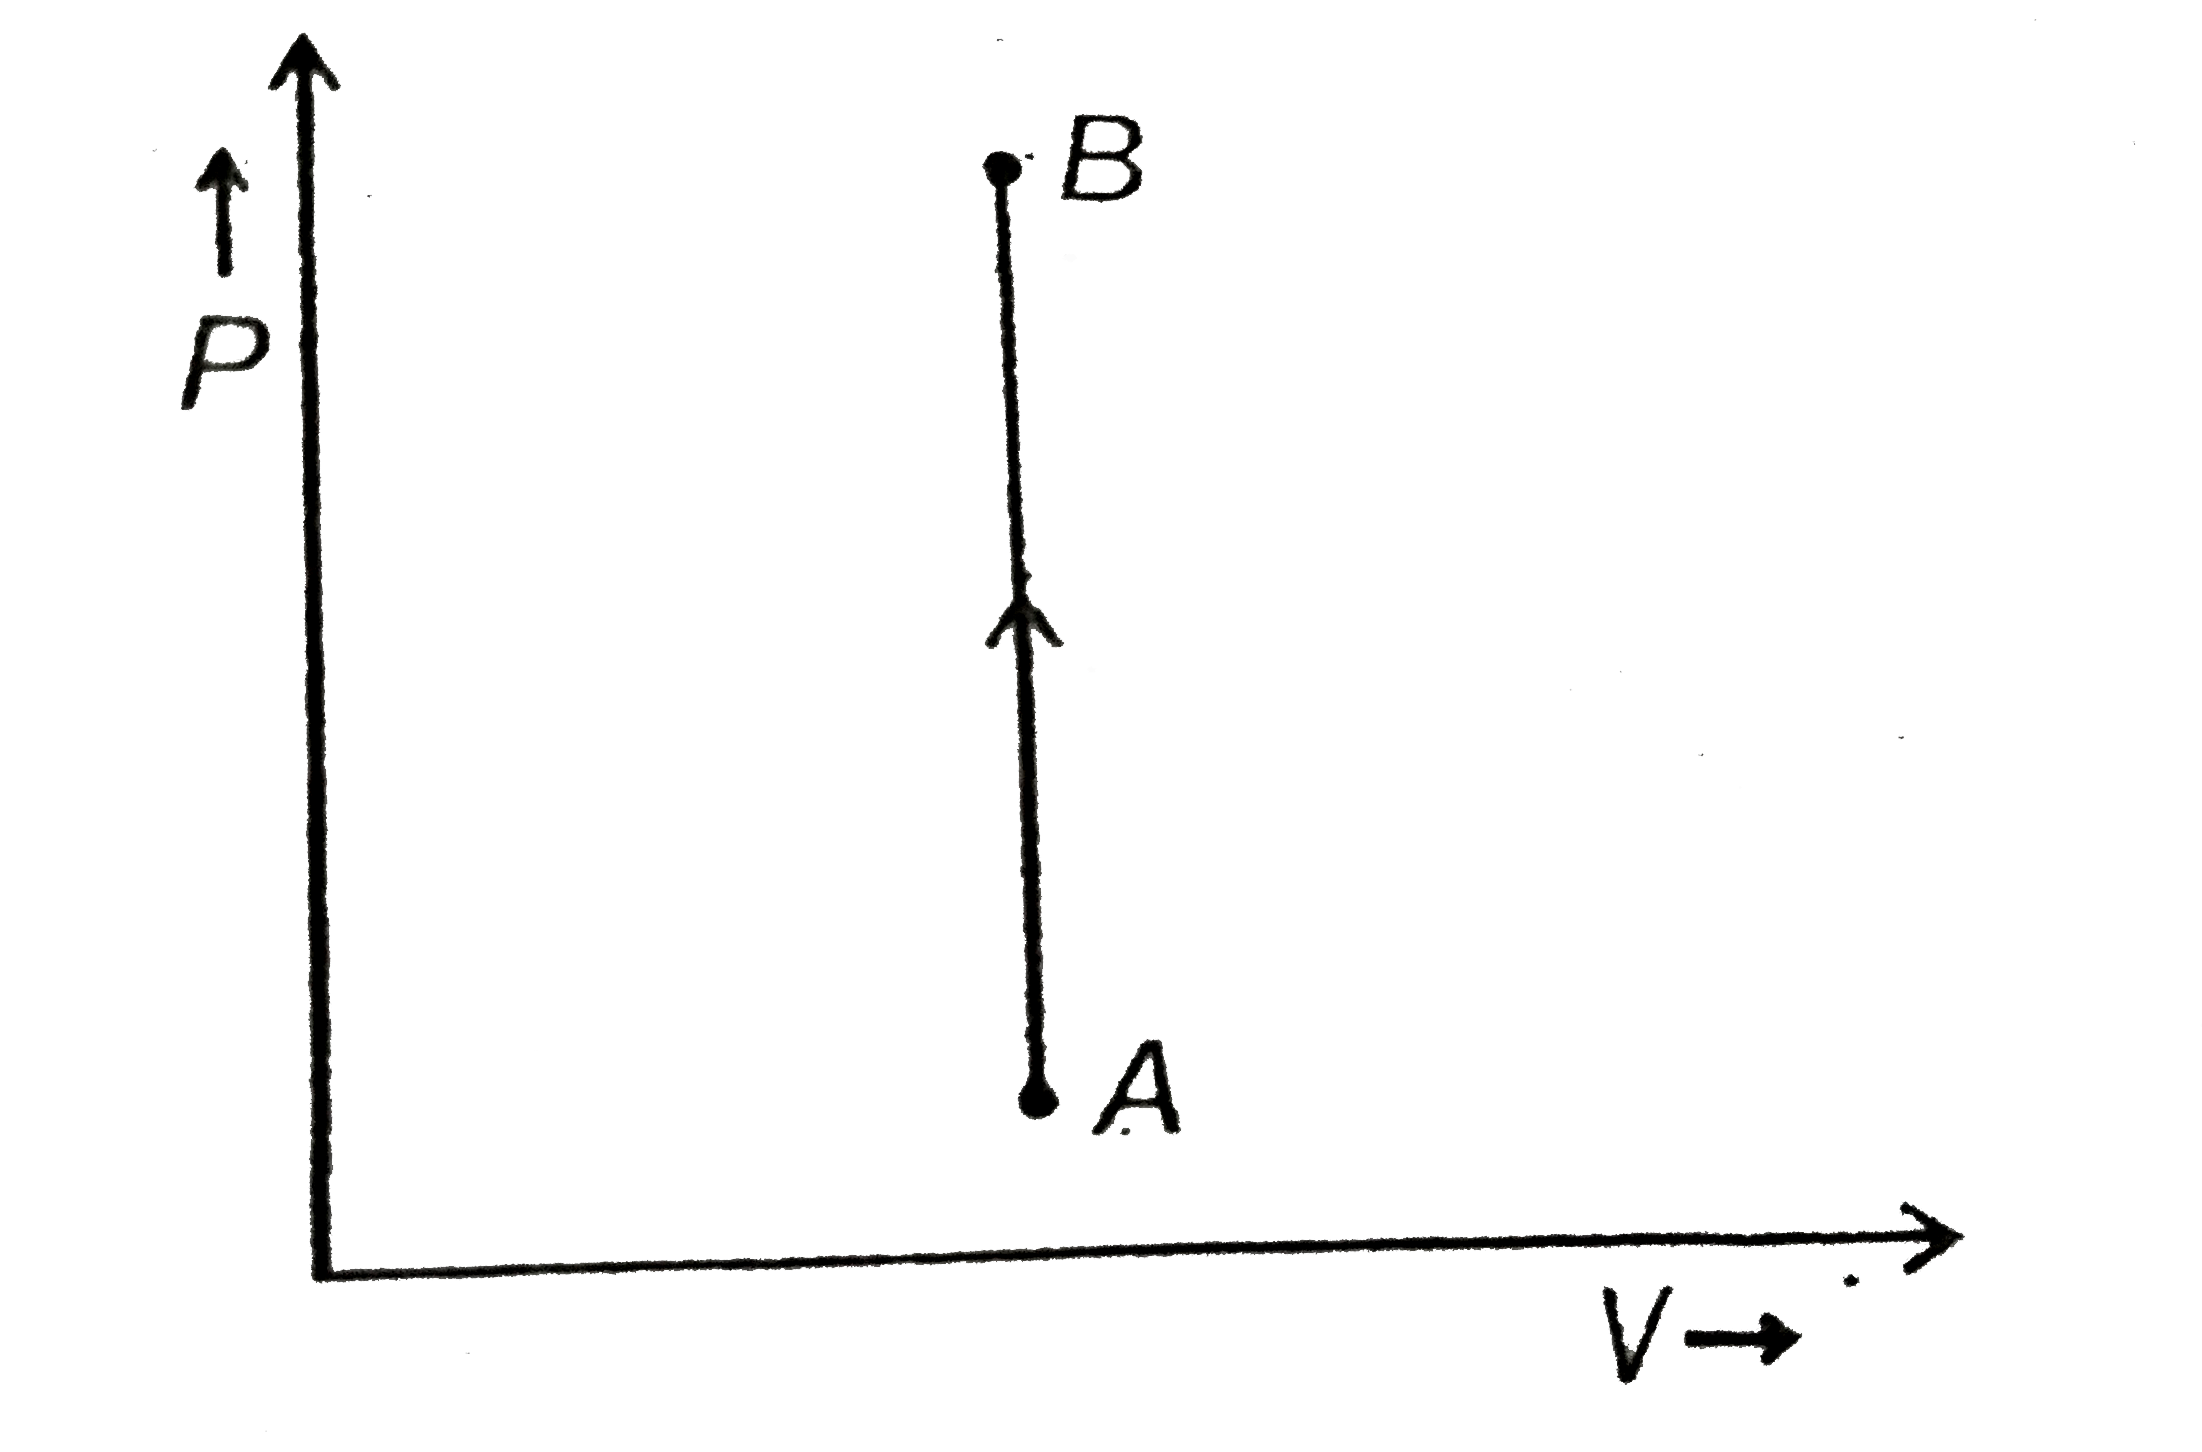
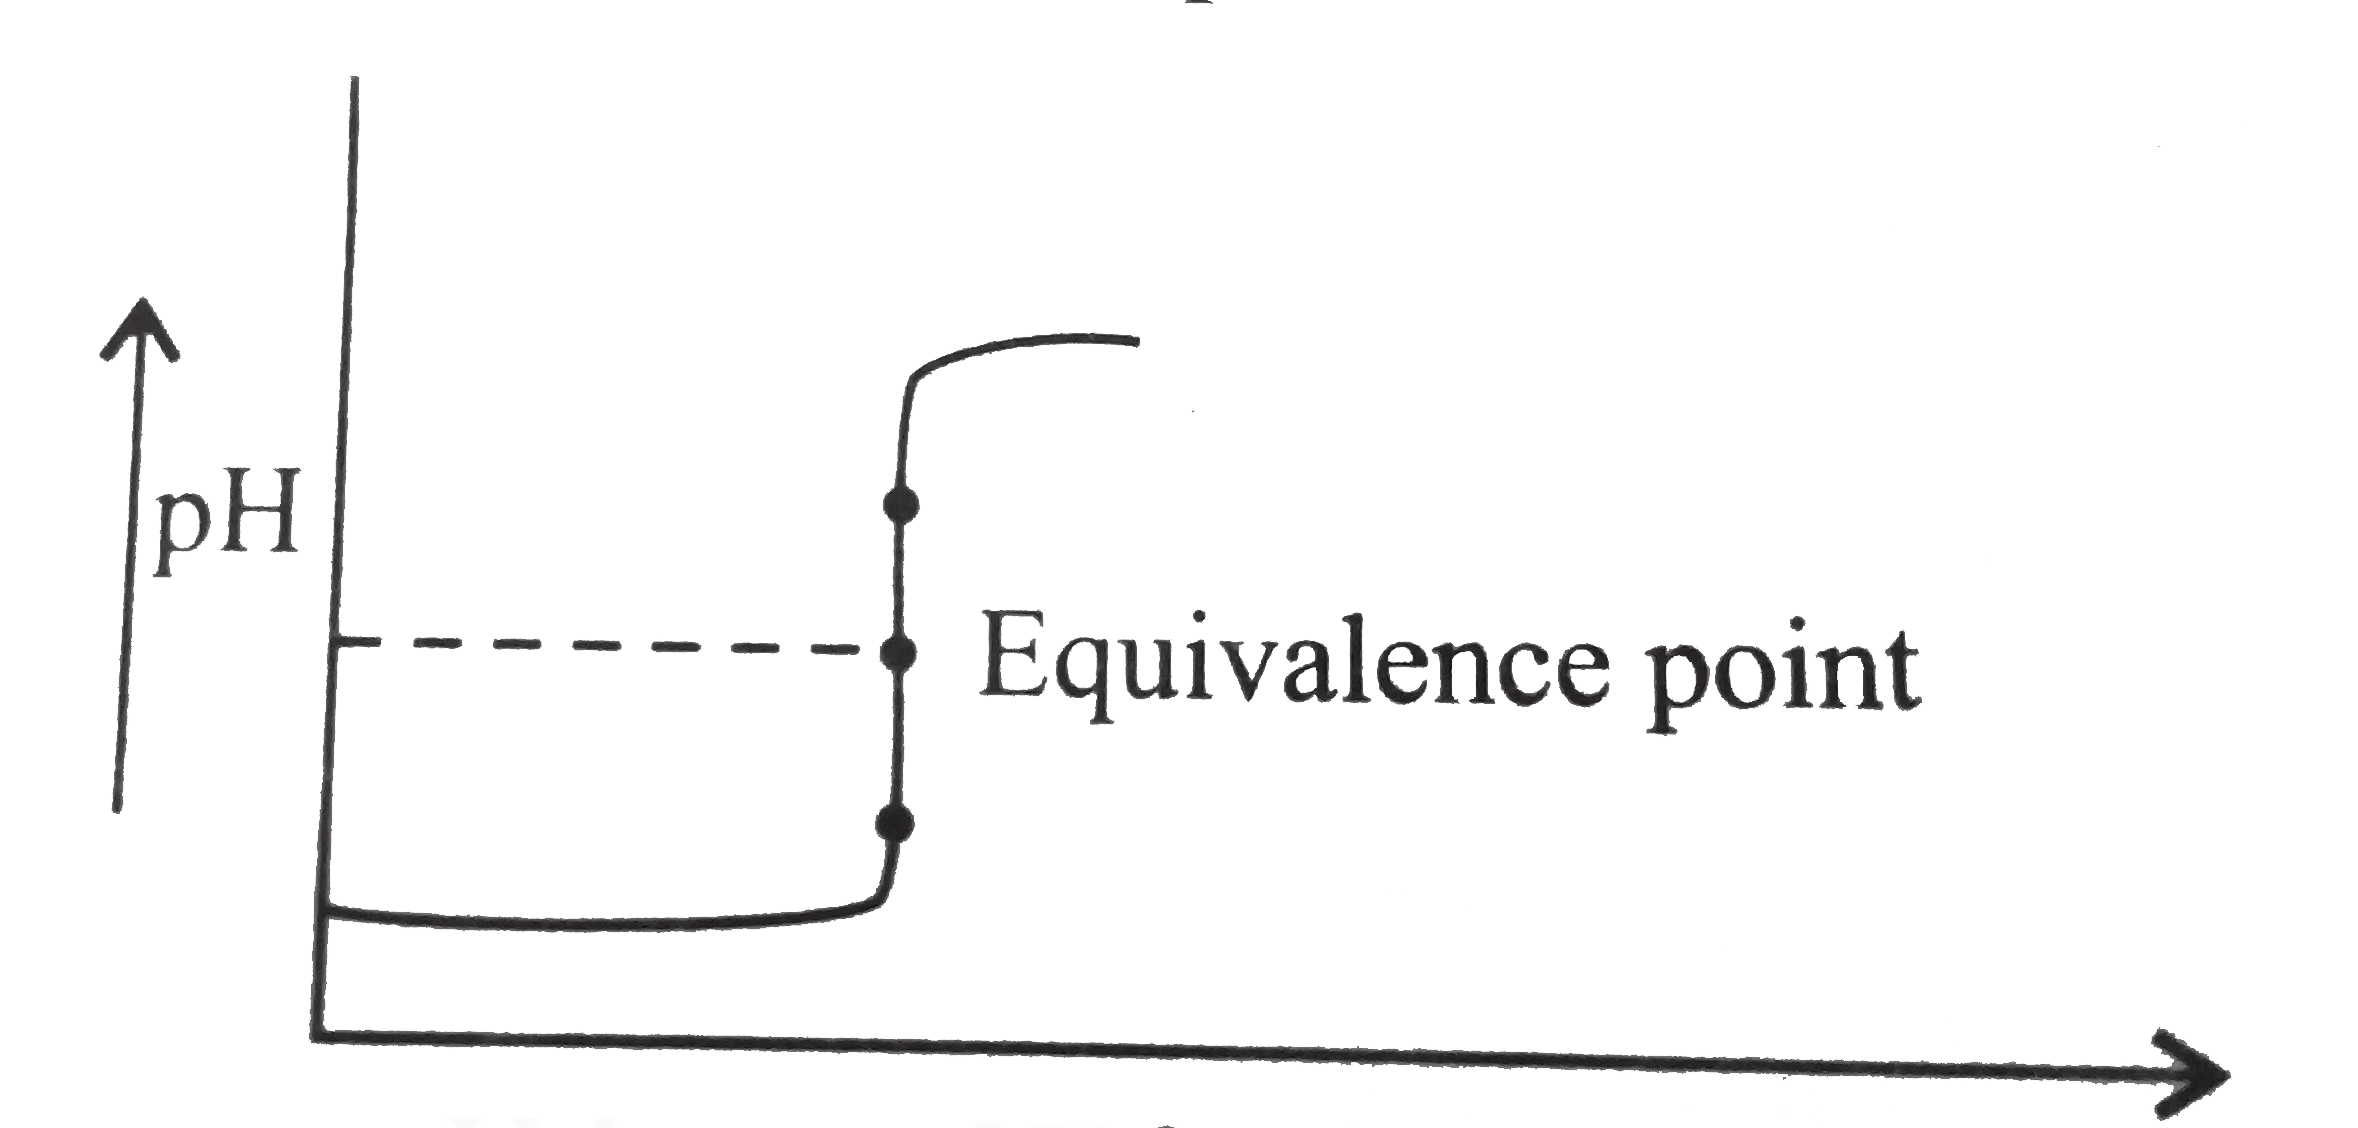
The graph represents the titration curve for :
strong acid and strong base
strong acid and weak base
weak acid and stong base
weak acid and weak base
The correct Answer is:b
∵ At equivalence point pH is less than 7.
Topper's Solved these Questions
Similar Questions
Knowledge Check
This graph represents:
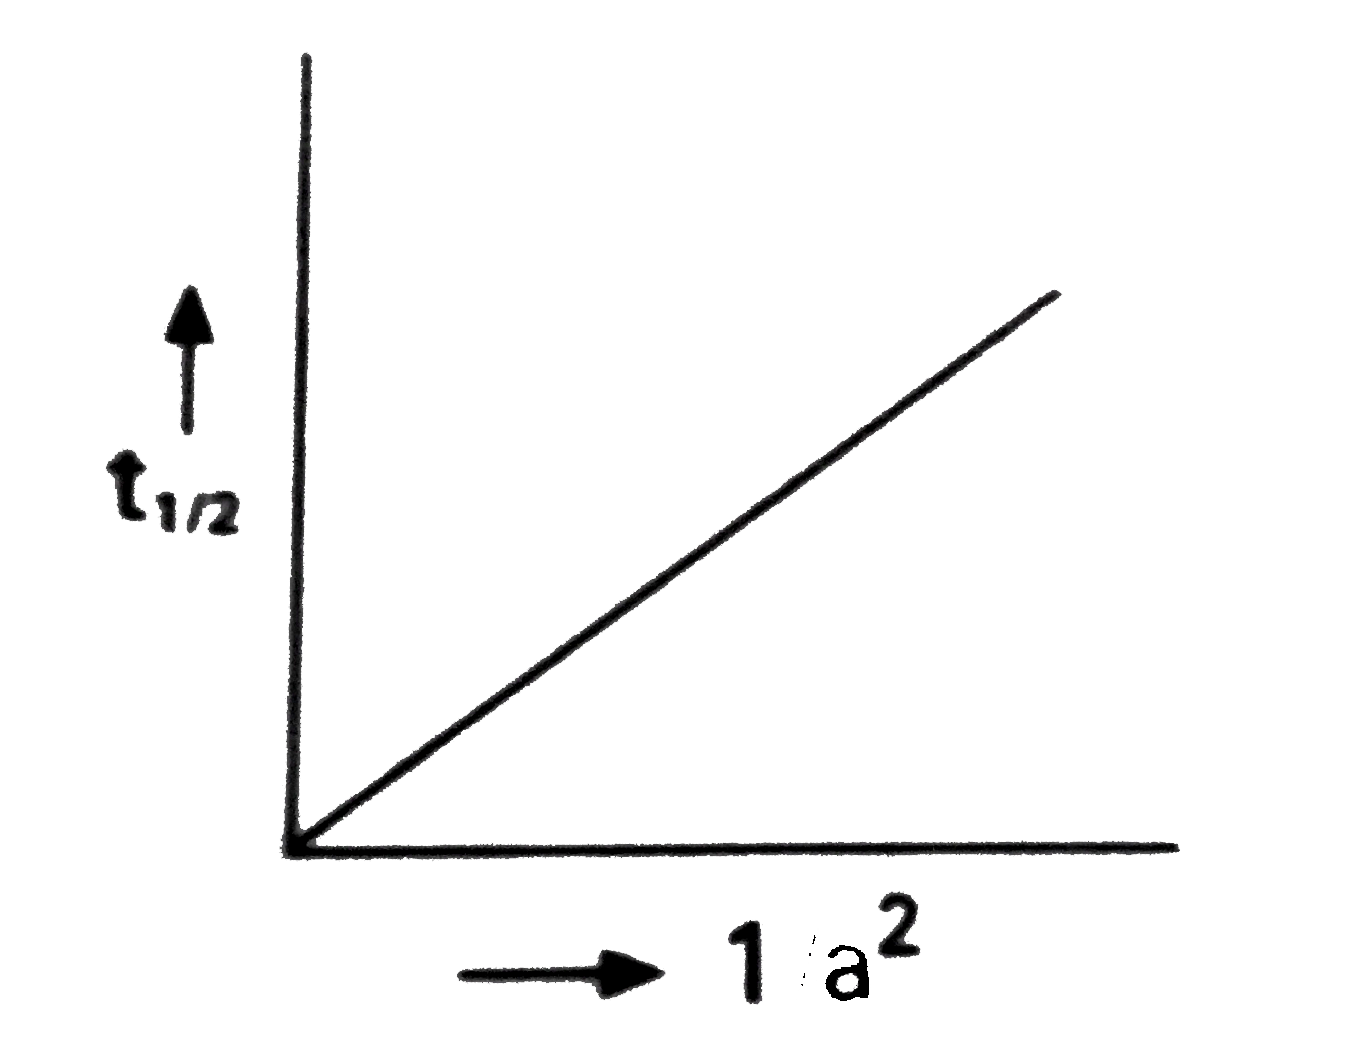 Afirst order reactionBzero order reactionCsecond order reactionDthird order reaction
The curve represents the titration of :
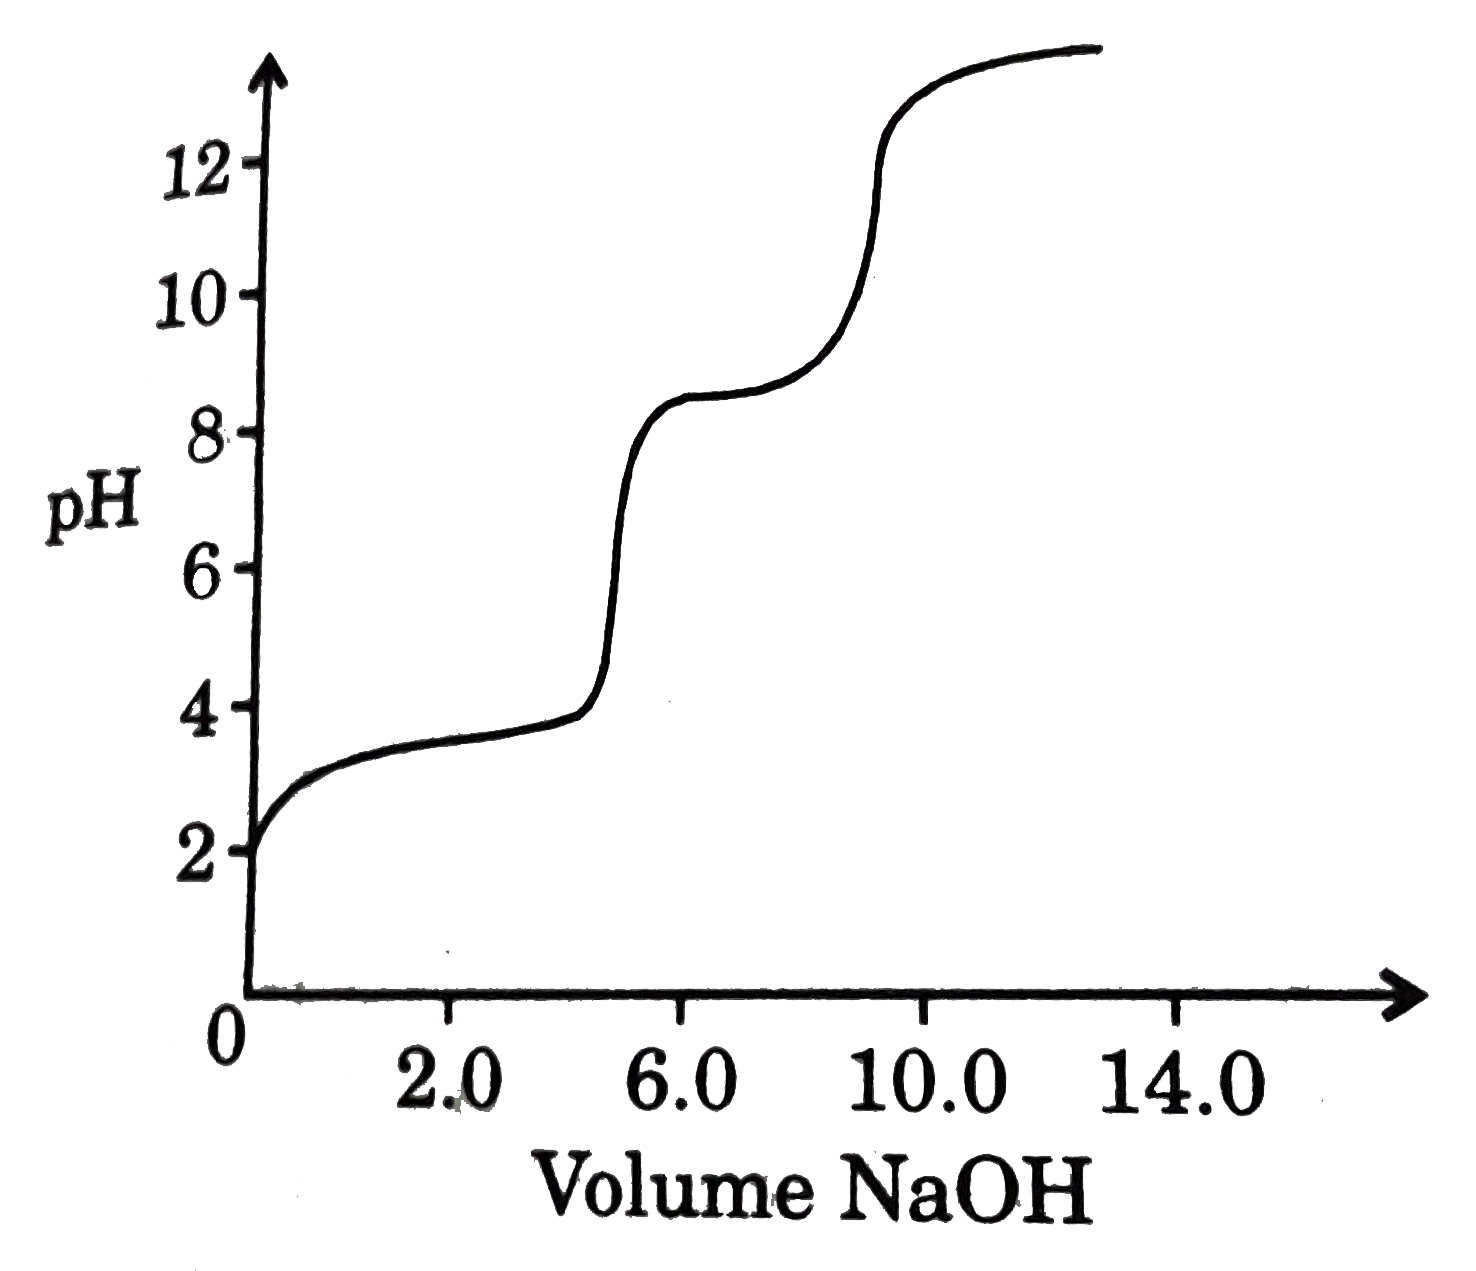 Aa diprotic acidBtwo monoprotic acids with the same Kas but different concentrations.Ctwo monoprotic acid with different Kas but the same concentrationsDtwo monoprotic acids with different Kas and different concentrations.
The following graph represents the titration of pH vs volume
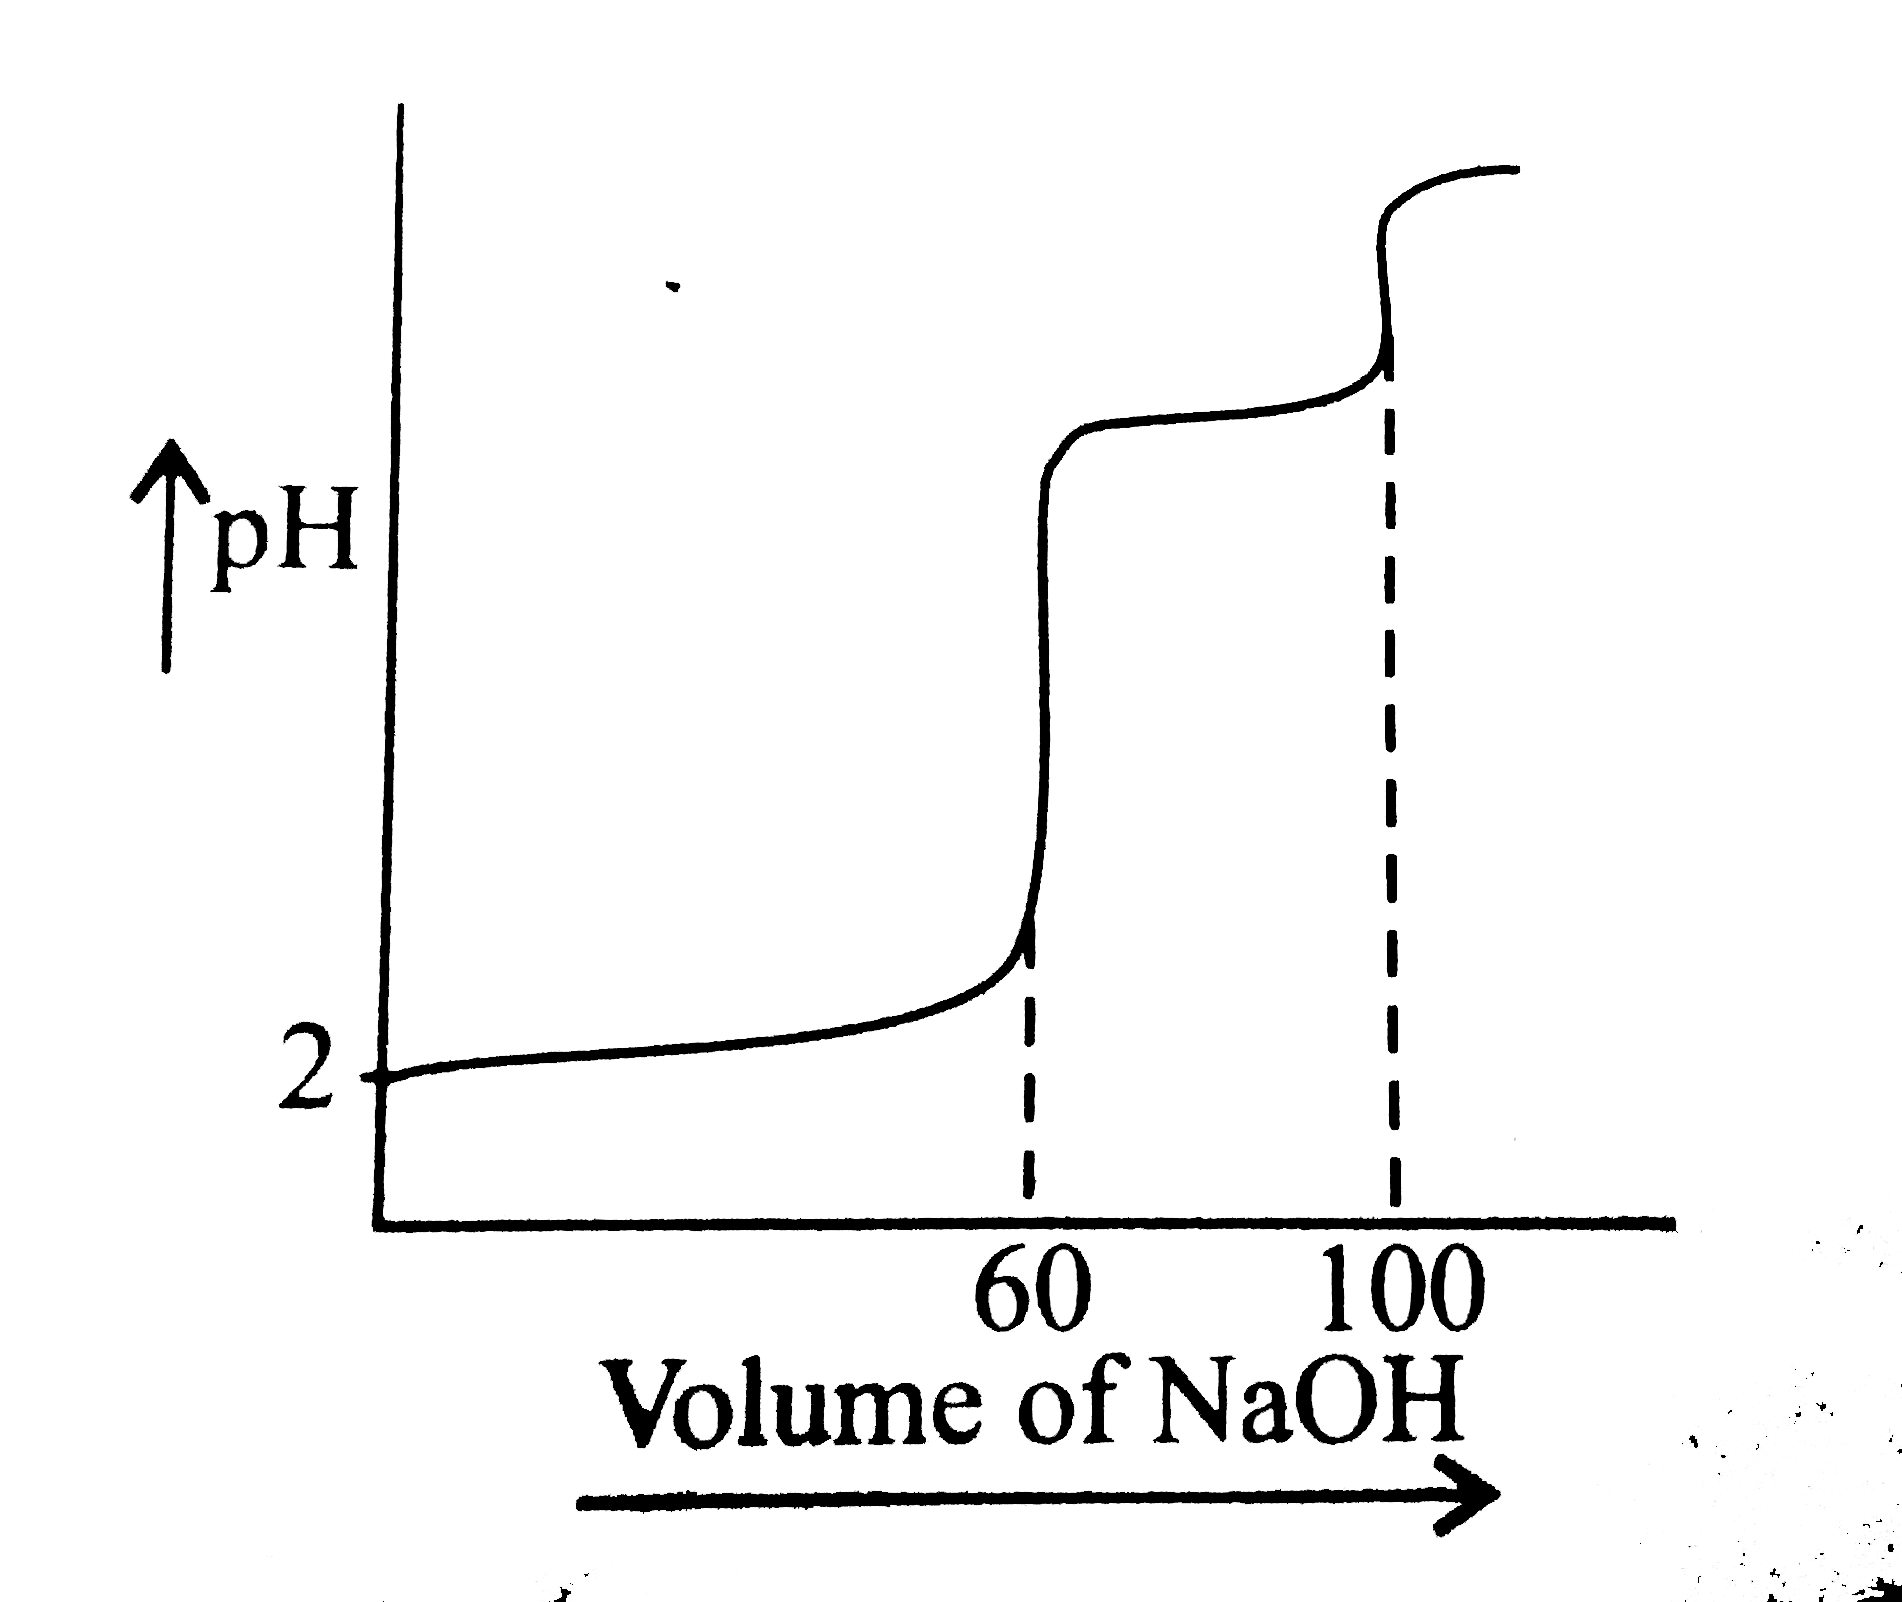 AA diprotic acid.BTwo monoprotic acids with the same Ka but different concentrations.CTwo monoprotic acids with different Ka but the same concentration.DTwo monoprotic acids with differnet Ka and different concentartions.
The following graph represents
View SolutionIn acid-base titration react rapidly to neutralise each other. Equivalence point is a point at which the acid and the base (or oxidising agent and reducing agent) have beem added in equivalent quantities. The end point in the point at which the titration stops. since the purpose of the indicator is to stop the titration close to the point at which the acid and base were added in equivalent quantities, it is important that the equivalent point and the end point be as close as must change colour at a pH close to that of a solution of the salt of the acid base. Singificantly, the pH changes most rapidly near the equivalent point. The exact shape of a titration curve depends on Ka and Kb of acid and base.
The curve represents the titration of
View SolutionThe curve represents the titration of a weak monoprotic acid. Ovar what pH range (s) will the acid being titrated, serve as a buffer when mixed with its salt ?
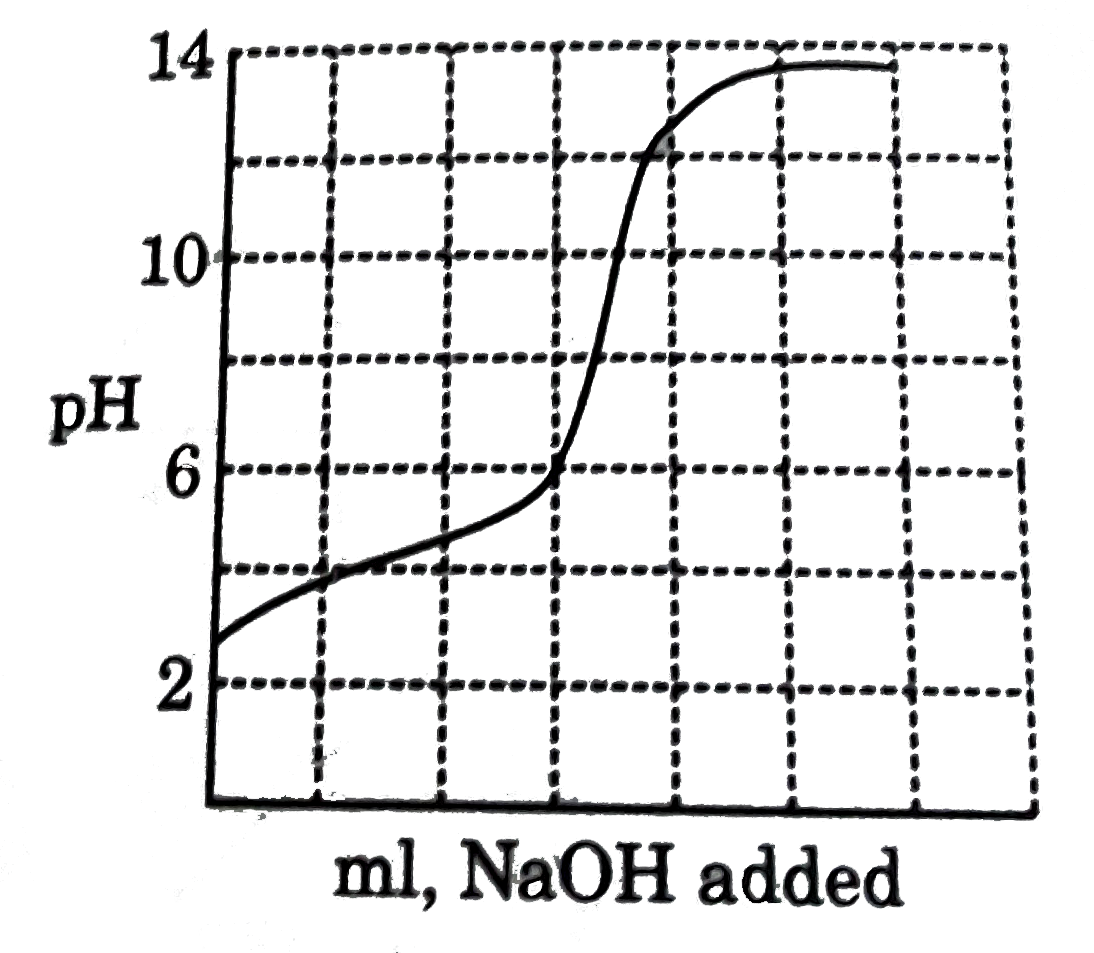
(P) pH4−6
(Q) pH9−9
(R) pH12−13
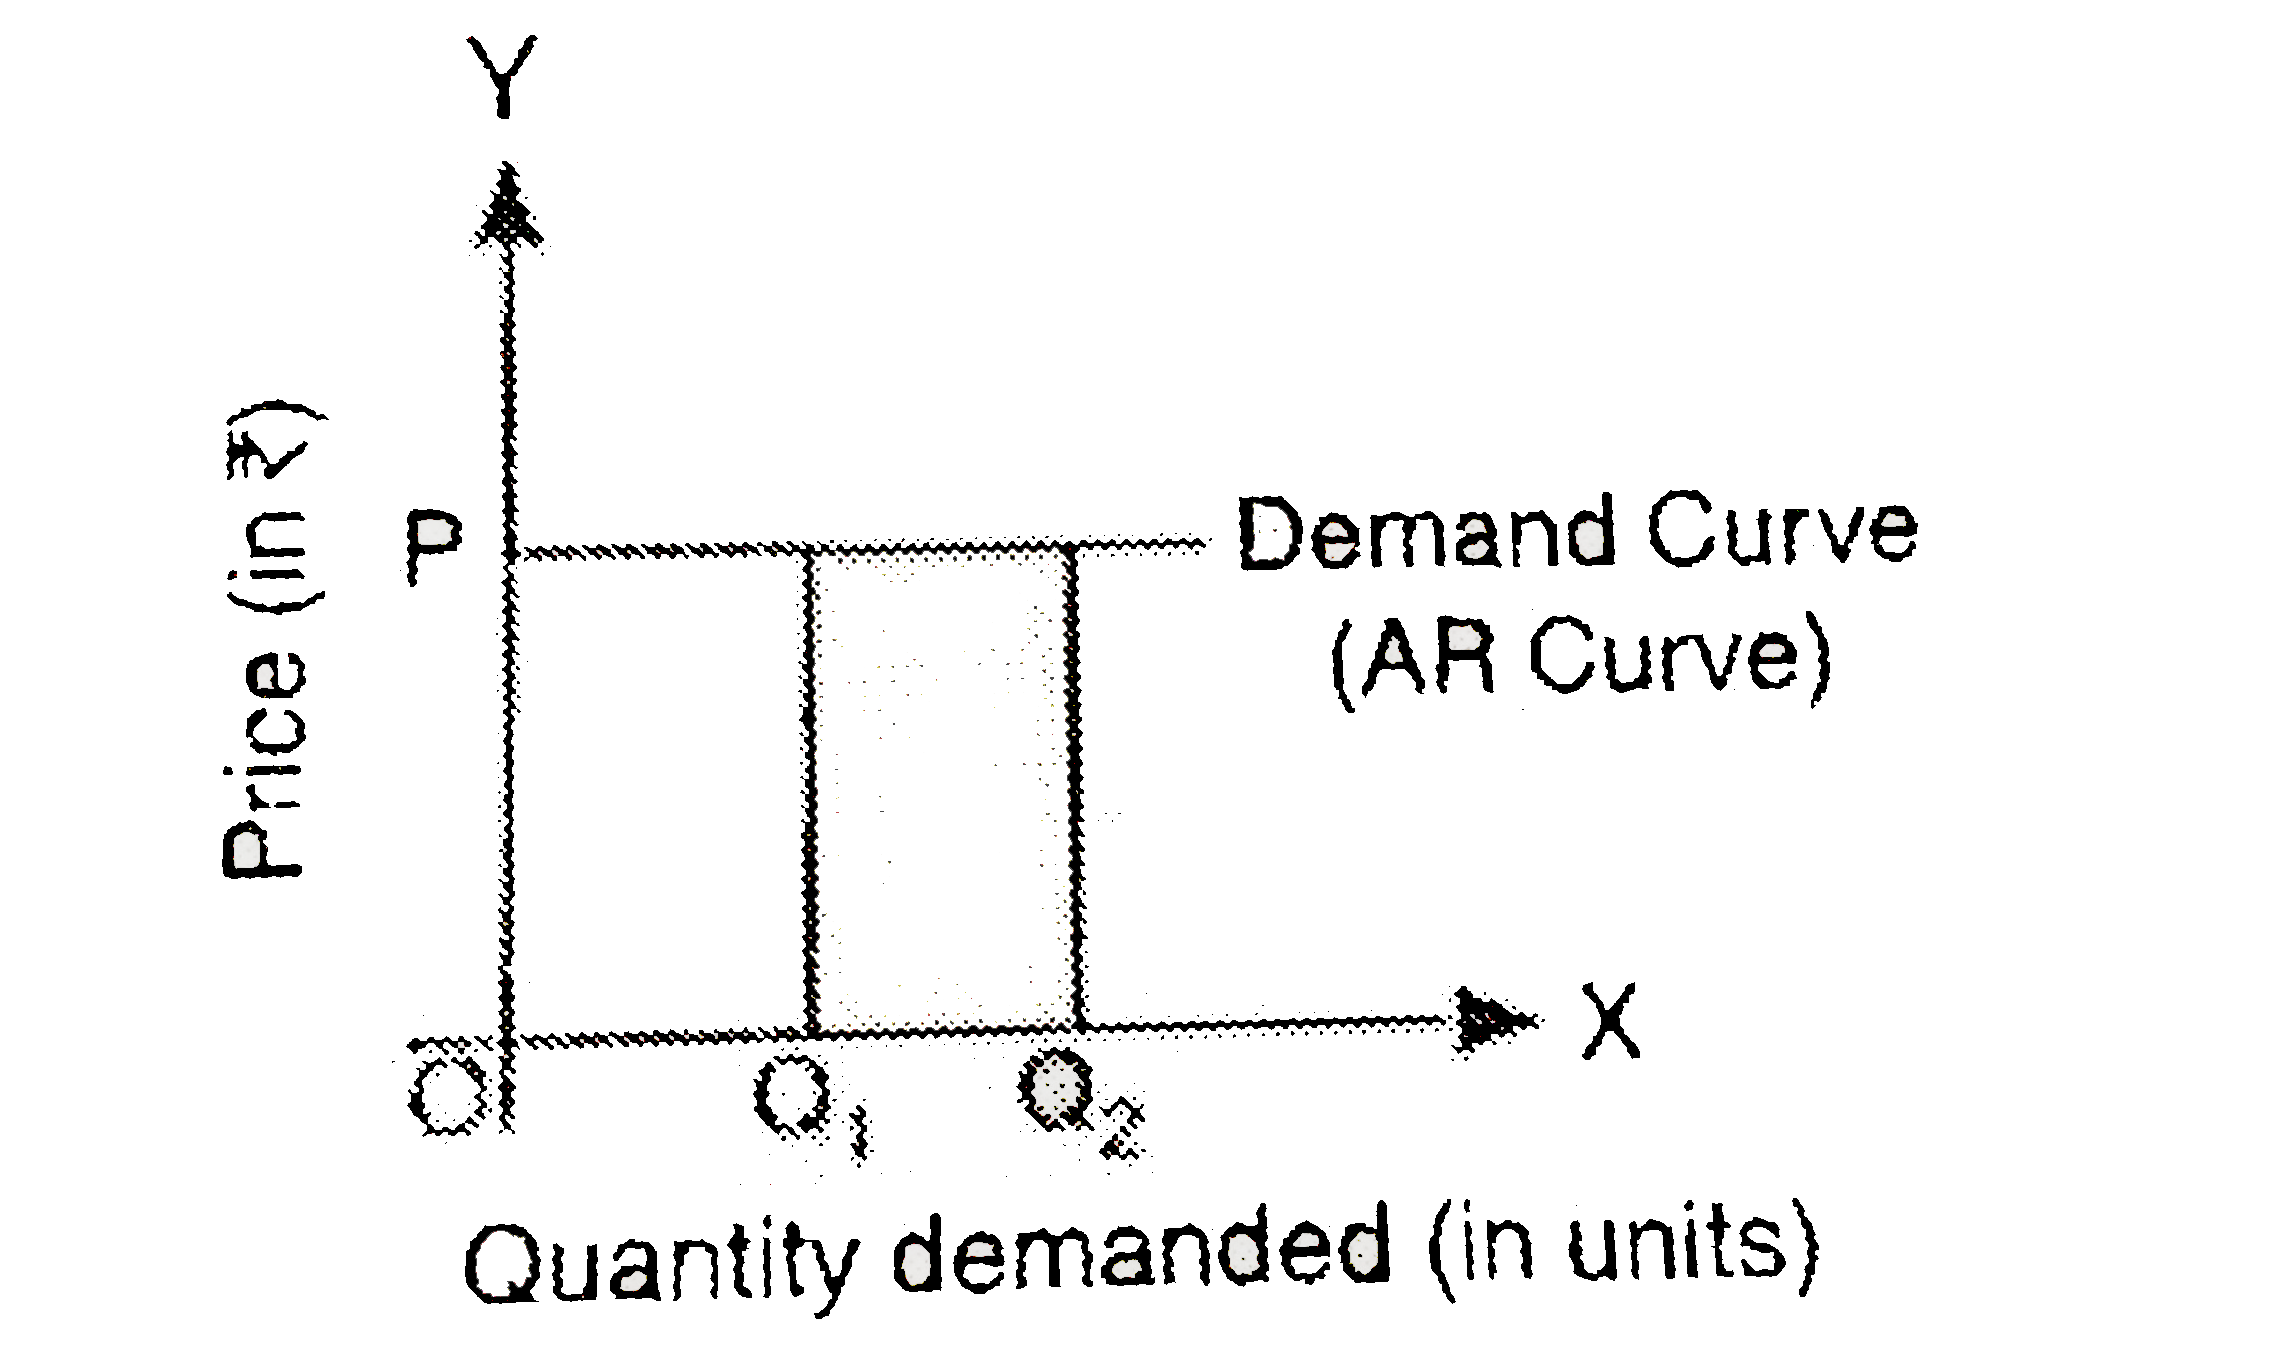
View SolutionThe following diagram represents the demand curve of:
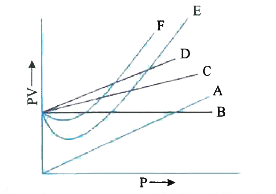
View SolutionWhich curve in the following graph represents the curve of ideal gas ?
View Solution


