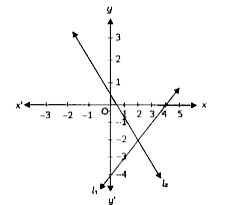
A graph of linear equation always represents a :
straight line
parabola
circle
None of these
The correct Answer is:A
Step by step video, text & image solution for A graph of linear equation always represents a : by Maths experts to help you in doubts & scoring excellent marks in Class 10 exams.
Updated on:21/07/2023Topper's Solved these Questions
- PAIR OF LINEAR EQUATIONS IN TWO VARIABLESBook:MBD -HARYANA BOARDChapter:PAIR OF LINEAR EQUATIONS IN TWO VARIABLESExercise:SHORT ANSWER TYPE QUESTIONS
Explore 20 Videos
- MBD NEW STYPE MODEL TEST PAPER - 2Book:MBD -HARYANA BOARDChapter:MBD NEW STYPE MODEL TEST PAPER - 2Exercise:SET - D (SECTION - D)
Explore 6 Videos
- POLYNOMIALSBook:MBD -HARYANA BOARDChapter:POLYNOMIALSExercise:SHORT ANSWER TYPE QUESTIONS
Explore 16 Videos
Similar Questions
A double bar graph is useful for the __________ of two sets of data.
Data represented in a circular form is called a _________ chart.
The graph of a linear equation is always a __________ line.
The cartesian system used two axes which are __________ to each other.
View SolutionThe solution of the pair of linear equations represented by lines l1andl2, in the given graph, is:

View Solution
Knowledge Check
The graph of linear equation y = x passes throgh the point
A(9,32)B(1,1)C(−12,12)D(32,−32)The graph of the linear equation y=x passes through the point
A(3/2,−3/2)B(0,3/2)C(1,1)D(−12,12)
Draw the graph of the linear equation whose solutions are represented by the points having the sum of the coordinates as 10 units.
View SolutionThe graph of linear equation 2y =5 is parallel to which axis
View SolutionDraw the graph of linear equation x+2y=6
View SolutionEvery point on the graph of a linear equation in two variables does not represent a solution of the linear equation.
View SolutionMethod to draw a graph of linear equation in two variables.
View SolutionThe graph of the linear equation x+2y=7 passes through the point (0,7).
View Solution

