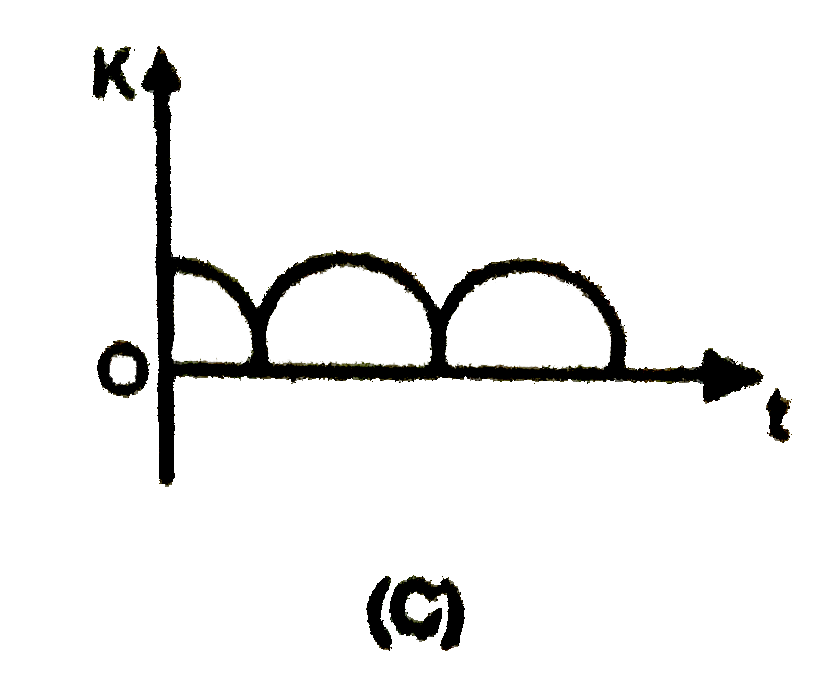
In S.H.M., the graph between kinetic energy K and time 't' is
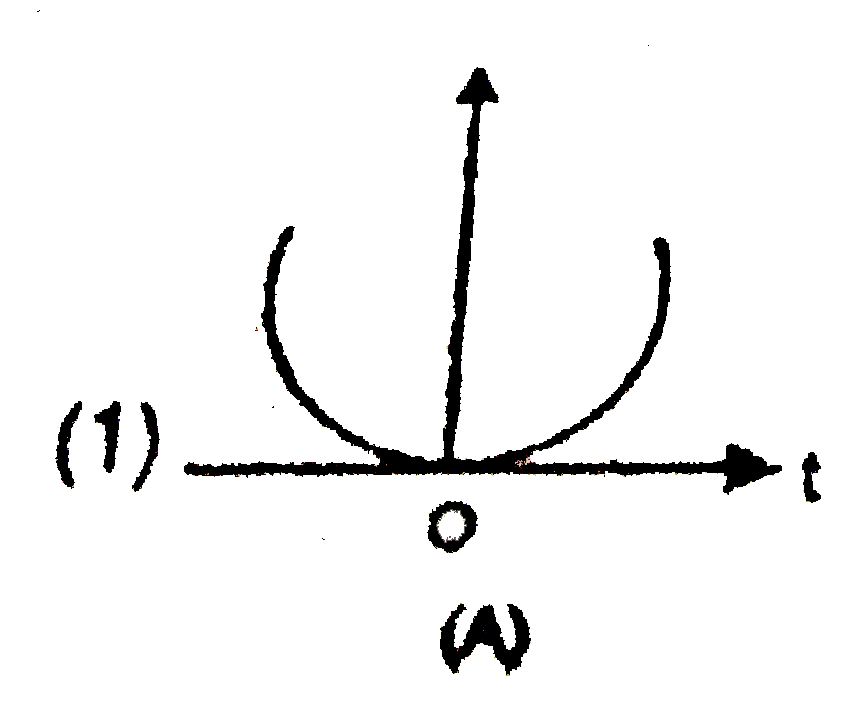
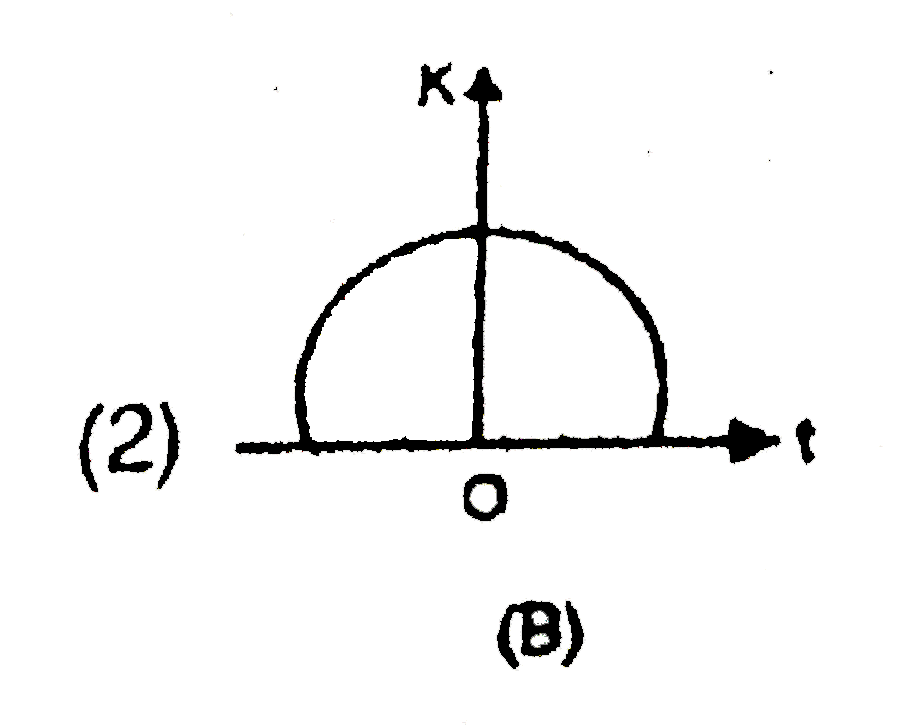
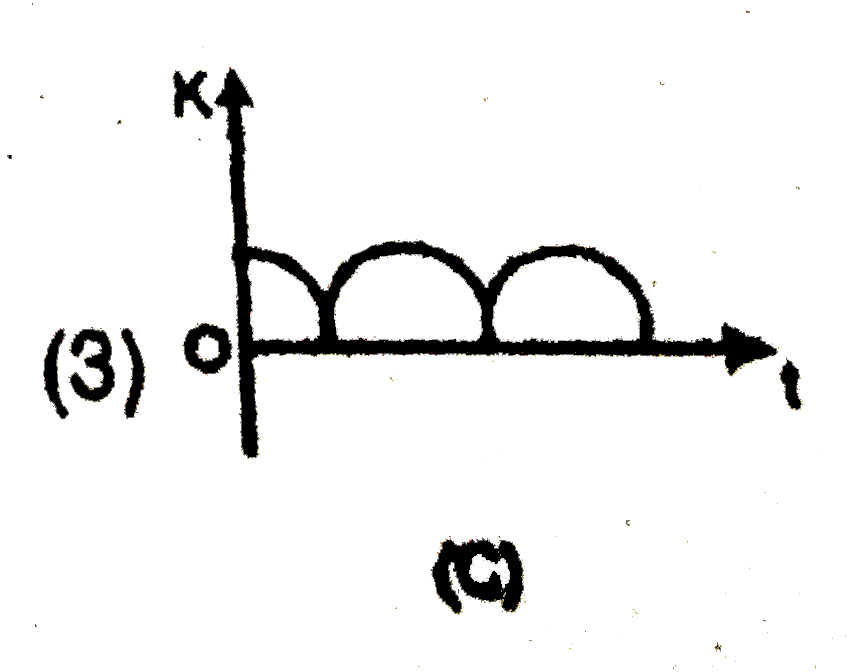
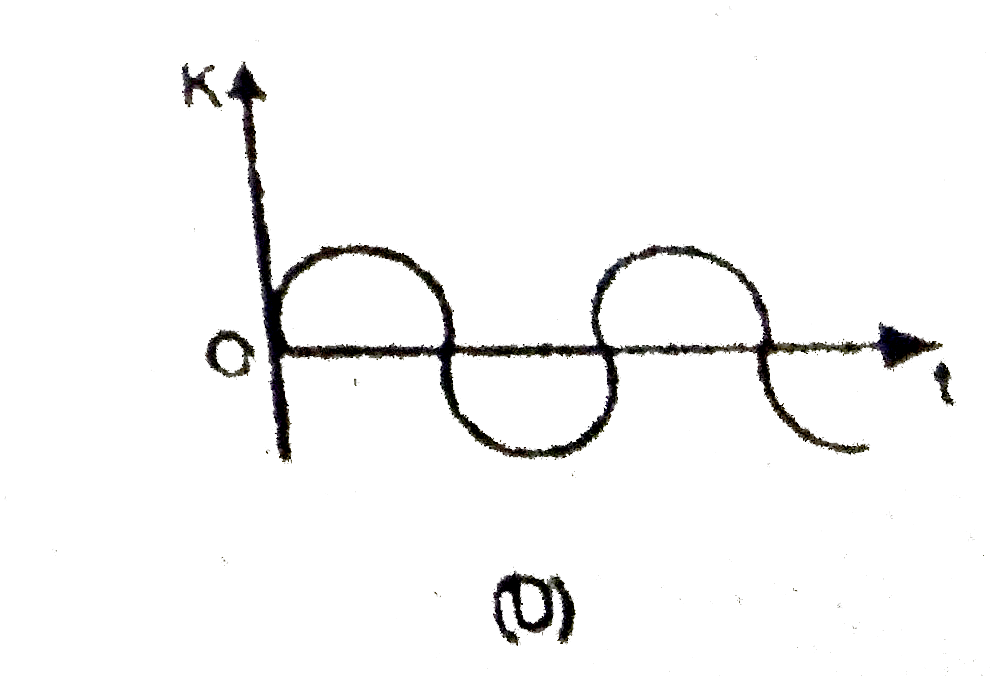
The correct Answer is:C
Topper's Solved these Questions
Similar Questions
Show that for a particle in linear S.H.M., the average kinetic energy over a period of oscillation equals the average potential energy over the same period.
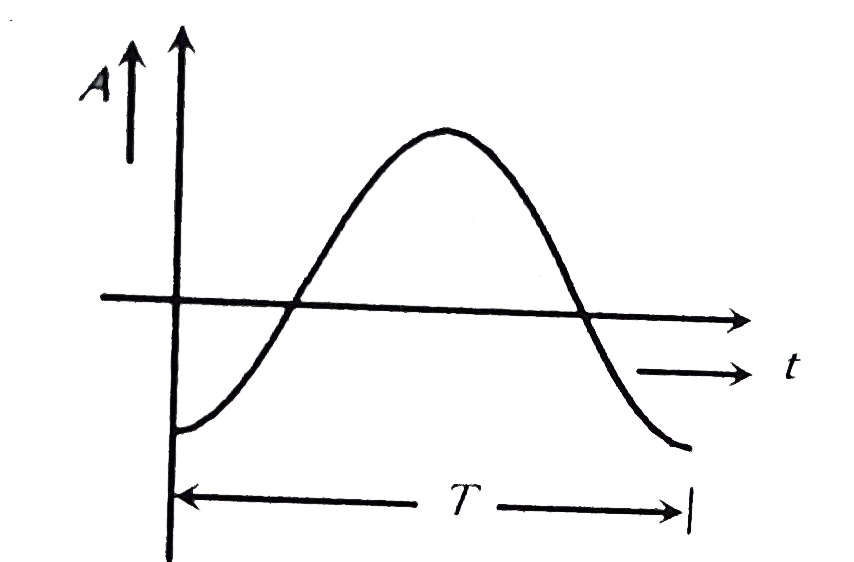
View SolutionAcceleration A and time period T of a body in S.H.M. is given by a curve shown below. Then corresponding graph, between kinetic energy (K.E.) and time t is correctly represented by
View Solution
Knowledge Check
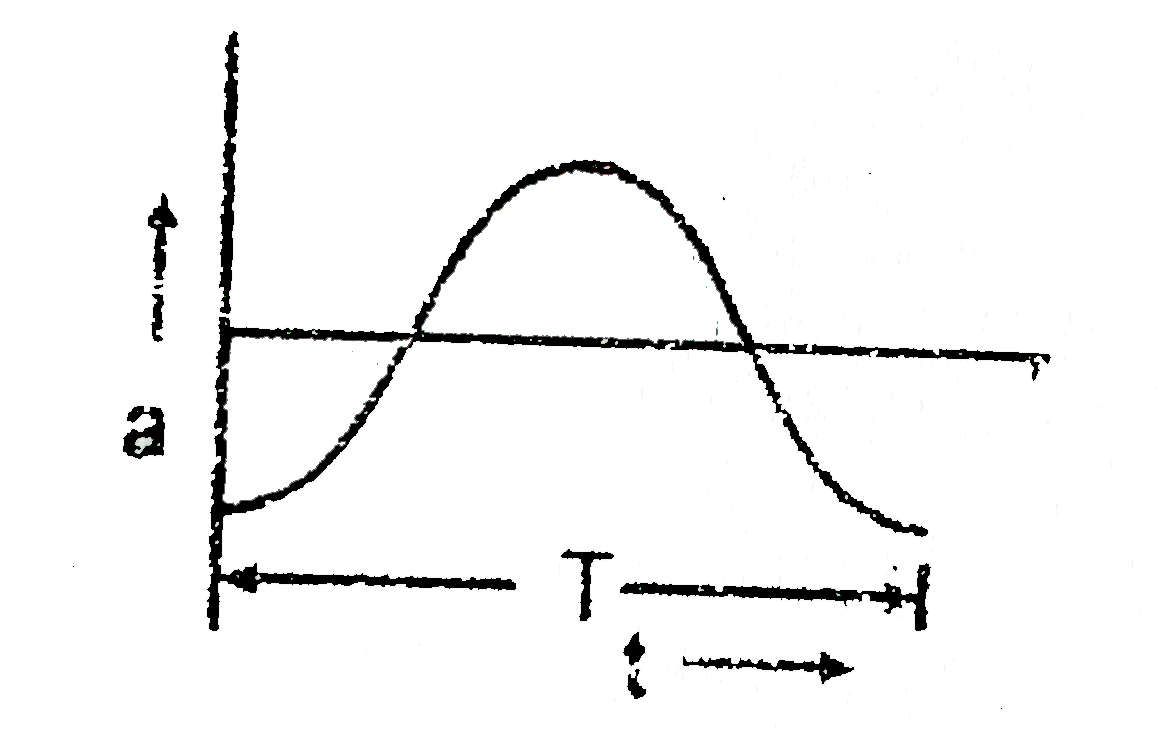
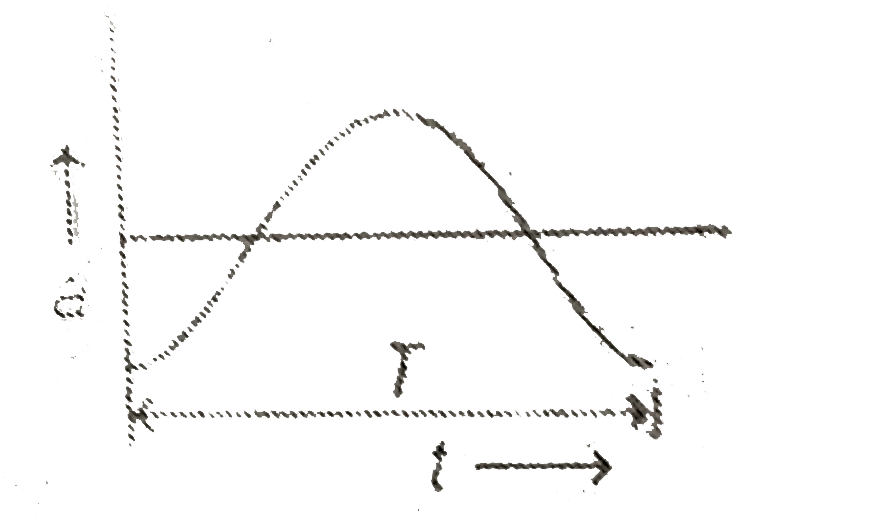
Acceleration a versus time t graph of a body in SHM is given by a curve shown below. T is the time period Then corresponding graph between kinetic energy KE and time t is correctly represented by
 A
A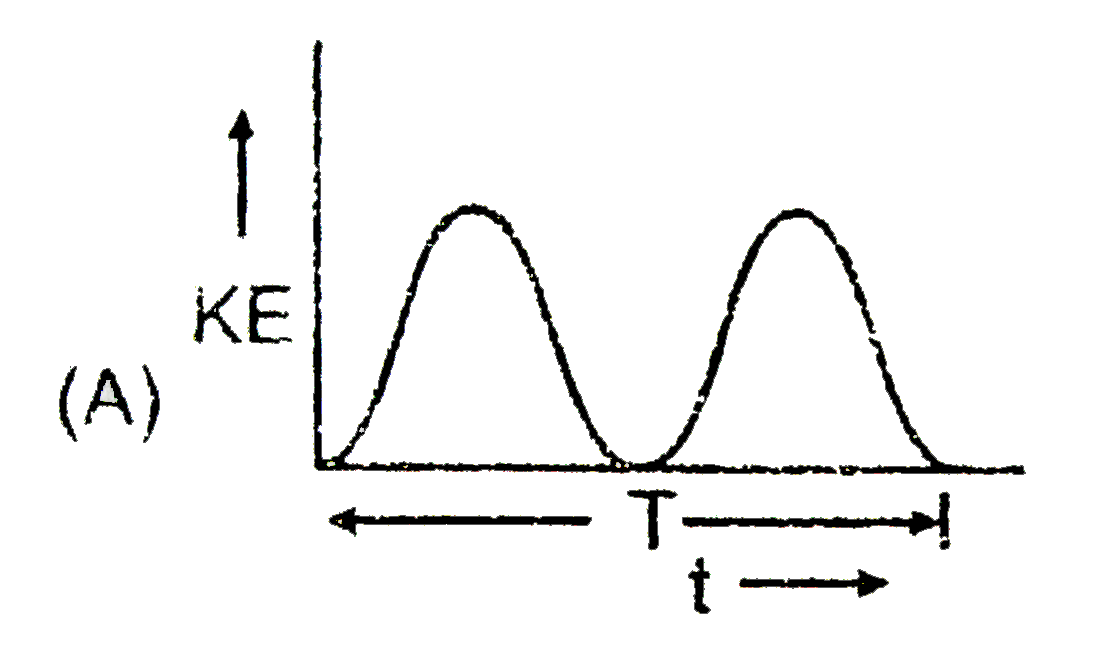 B
B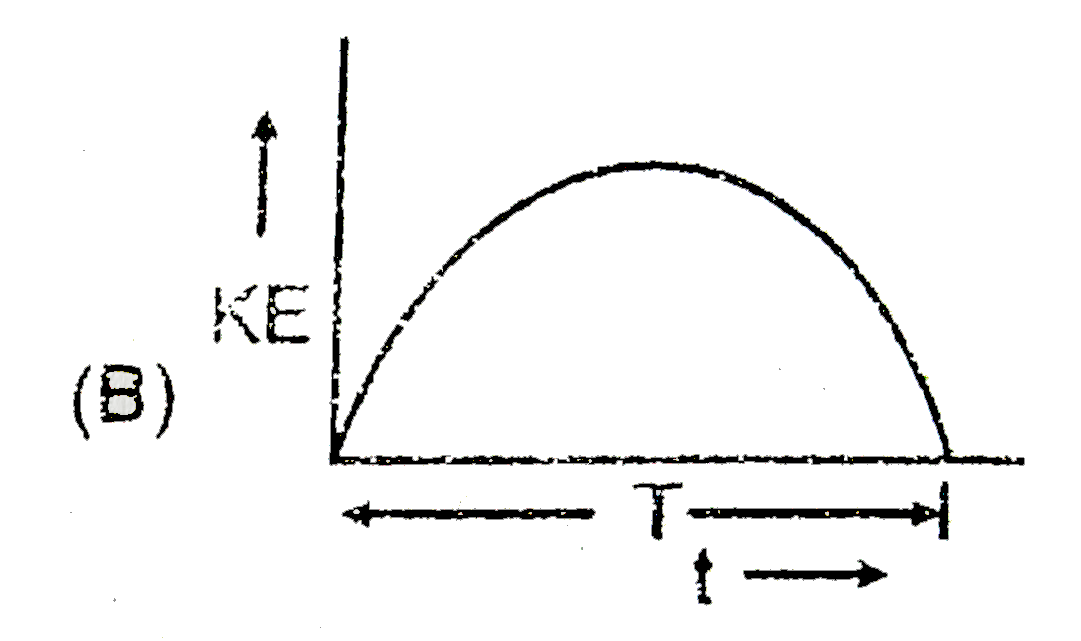 C
C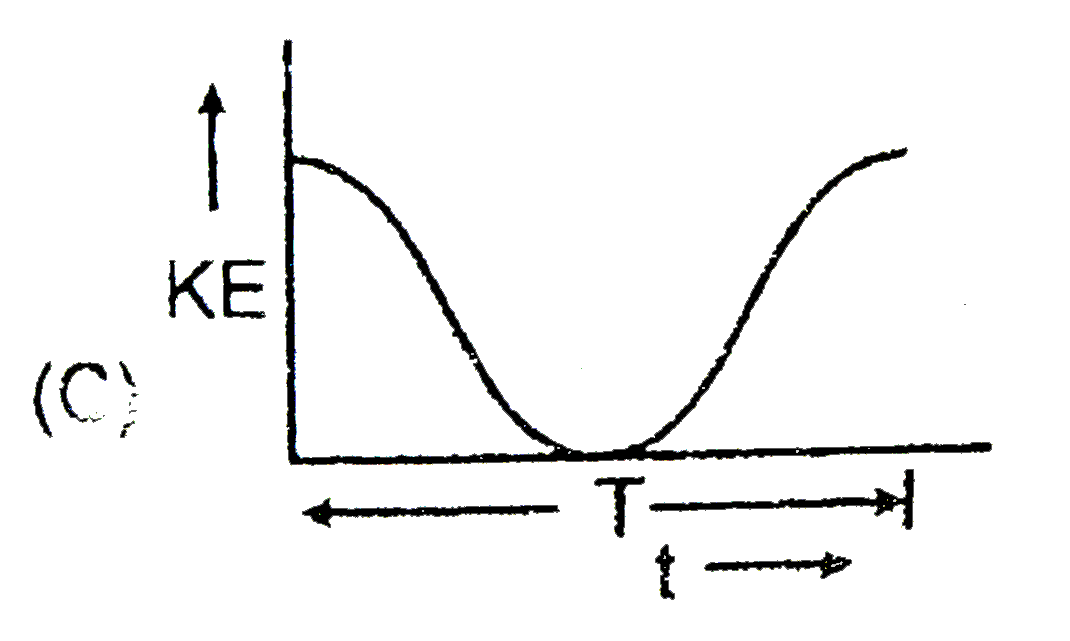 D
D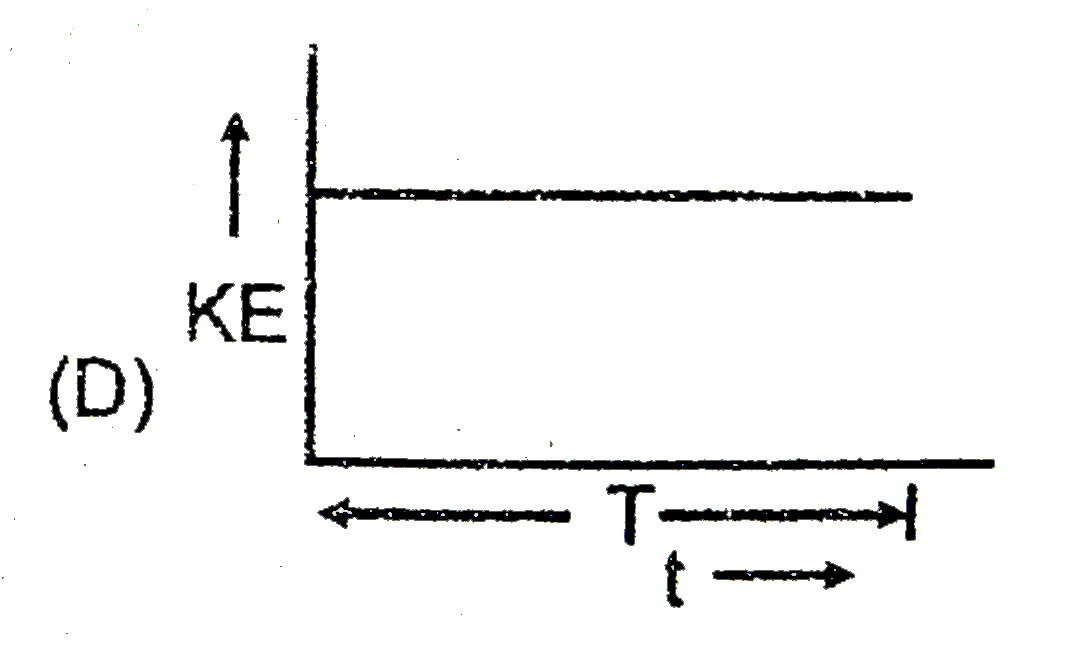
Acceleration versus time graph of a body in SHM is given by a curve shown below. T is the time period. Then corresponding graph between kinetic energy KE and time t is correctly represented by
 A
A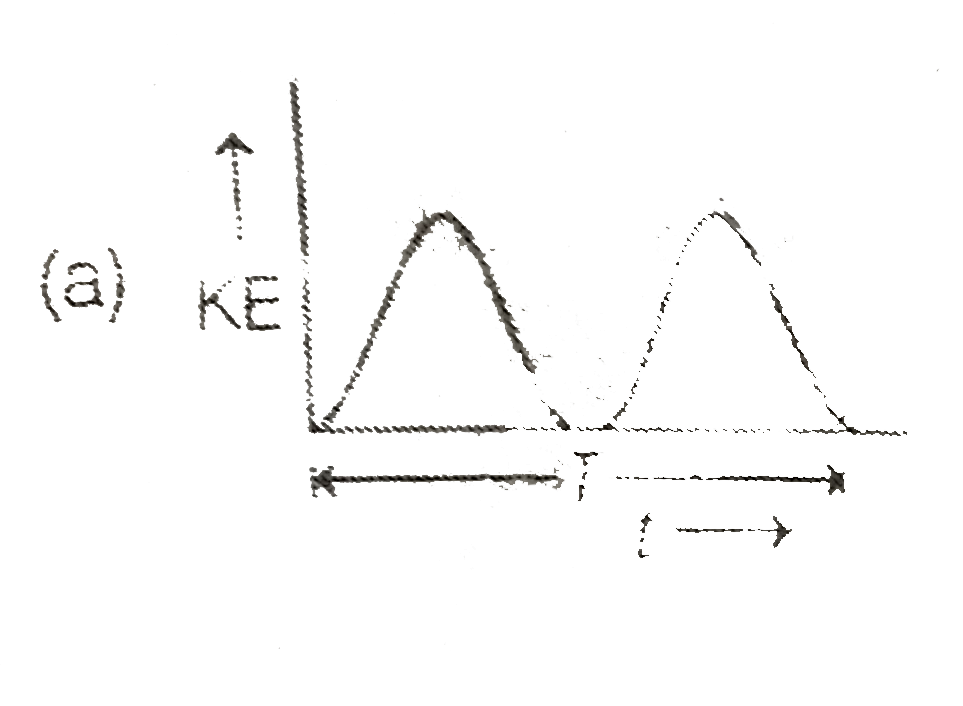 B
B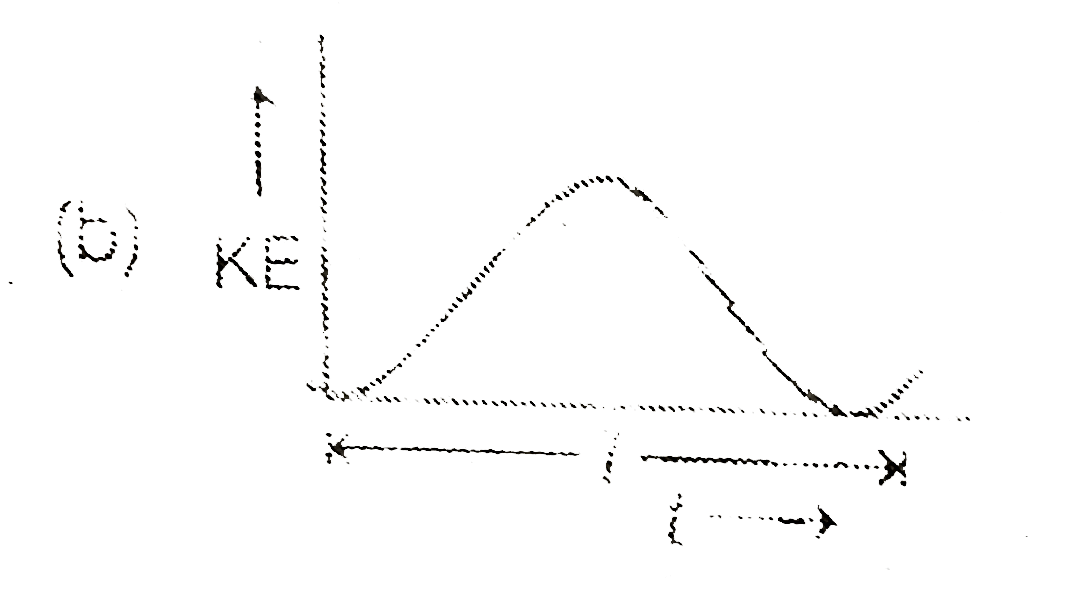 C
C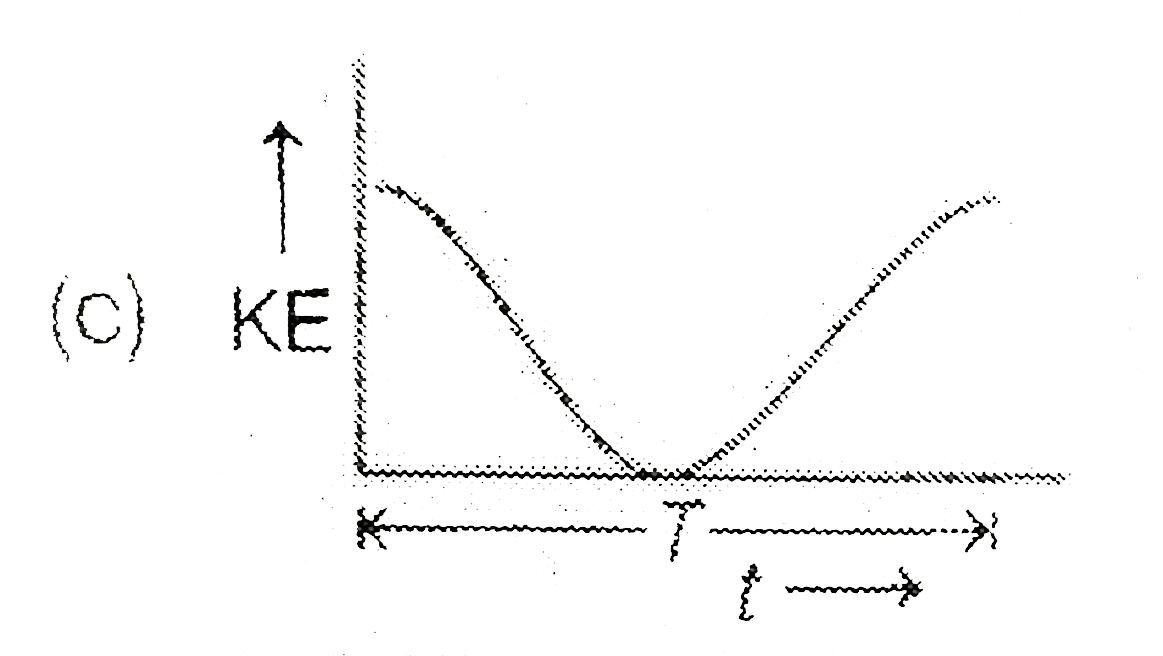 D
D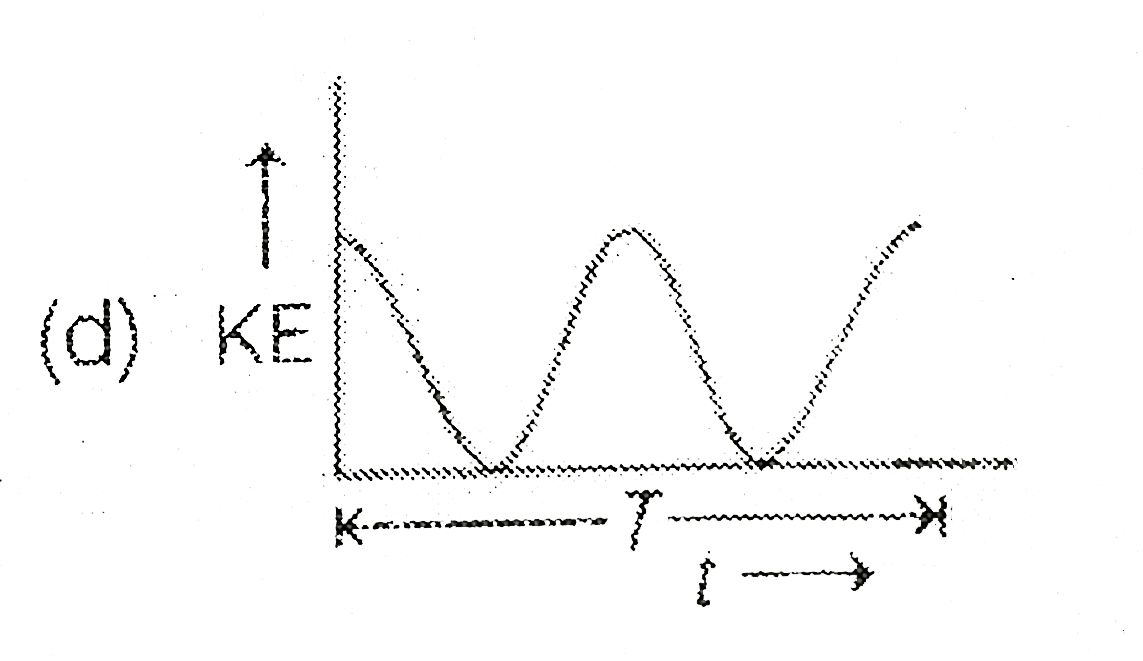
Statement -1 : The graph between - Kinetic energy and vertical displacement is a stright line for a projectile.
Statement -2 : The graph between kinetic energy and horizontal displacement is a straight is straight line for a projectile.
Statement -3 : the graph between kinetic energy and time is a parabola for a projectile.AF F FBT T FCT F TDF F T
Which of the graph between kinetic energy and time is correct ?
View SolutionIn S.H.M. the ratio of kinetic energy at mean position to the potential energy when the displacement is half of the amplitude is
View SolutionWhich of the graph between potential energy and time is correct ?
View SolutionThe graph between kinetic energy and displacement of a particle performing S.H.M. is
View SolutionWhat is the nature of the graph between the potential energy and total energy of a particle performing a linear S.H.M. ?
View Solution

