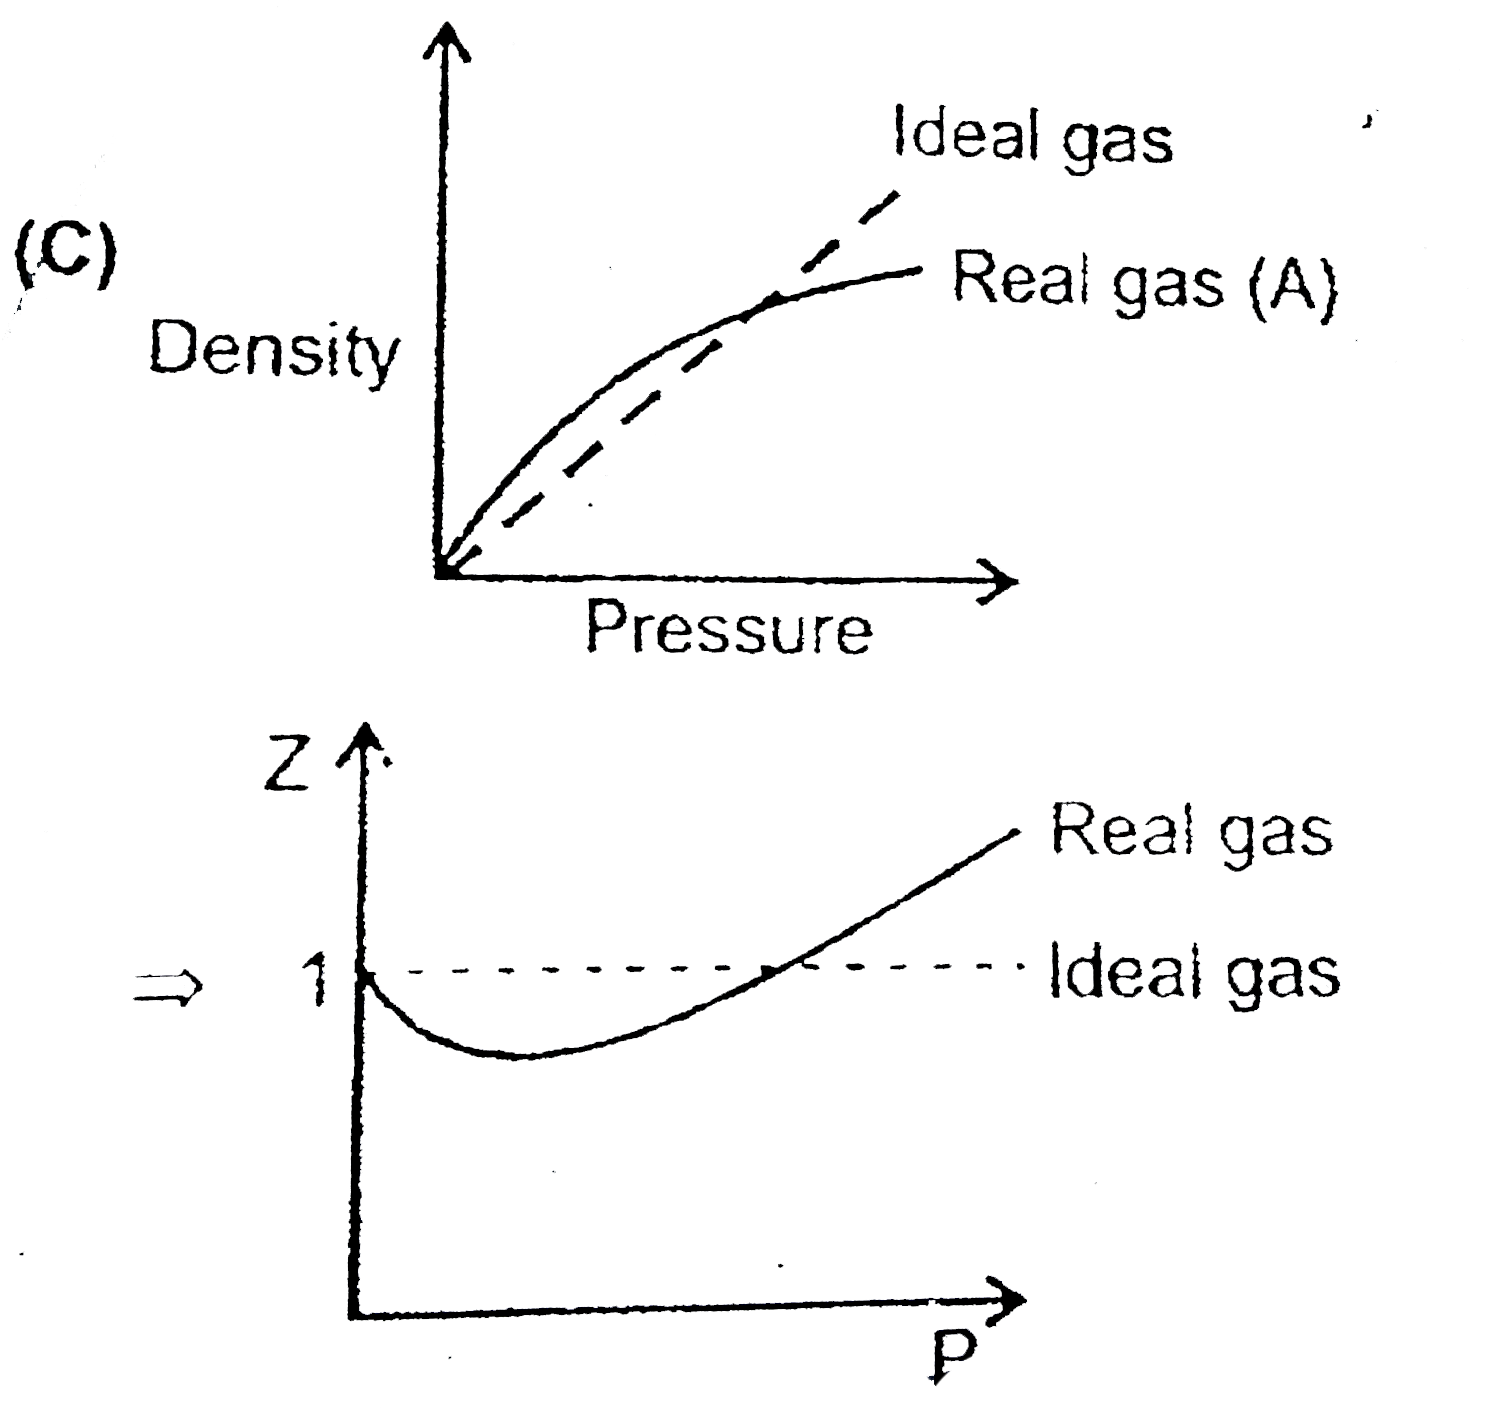
A gas shows following graphs at 25∘C
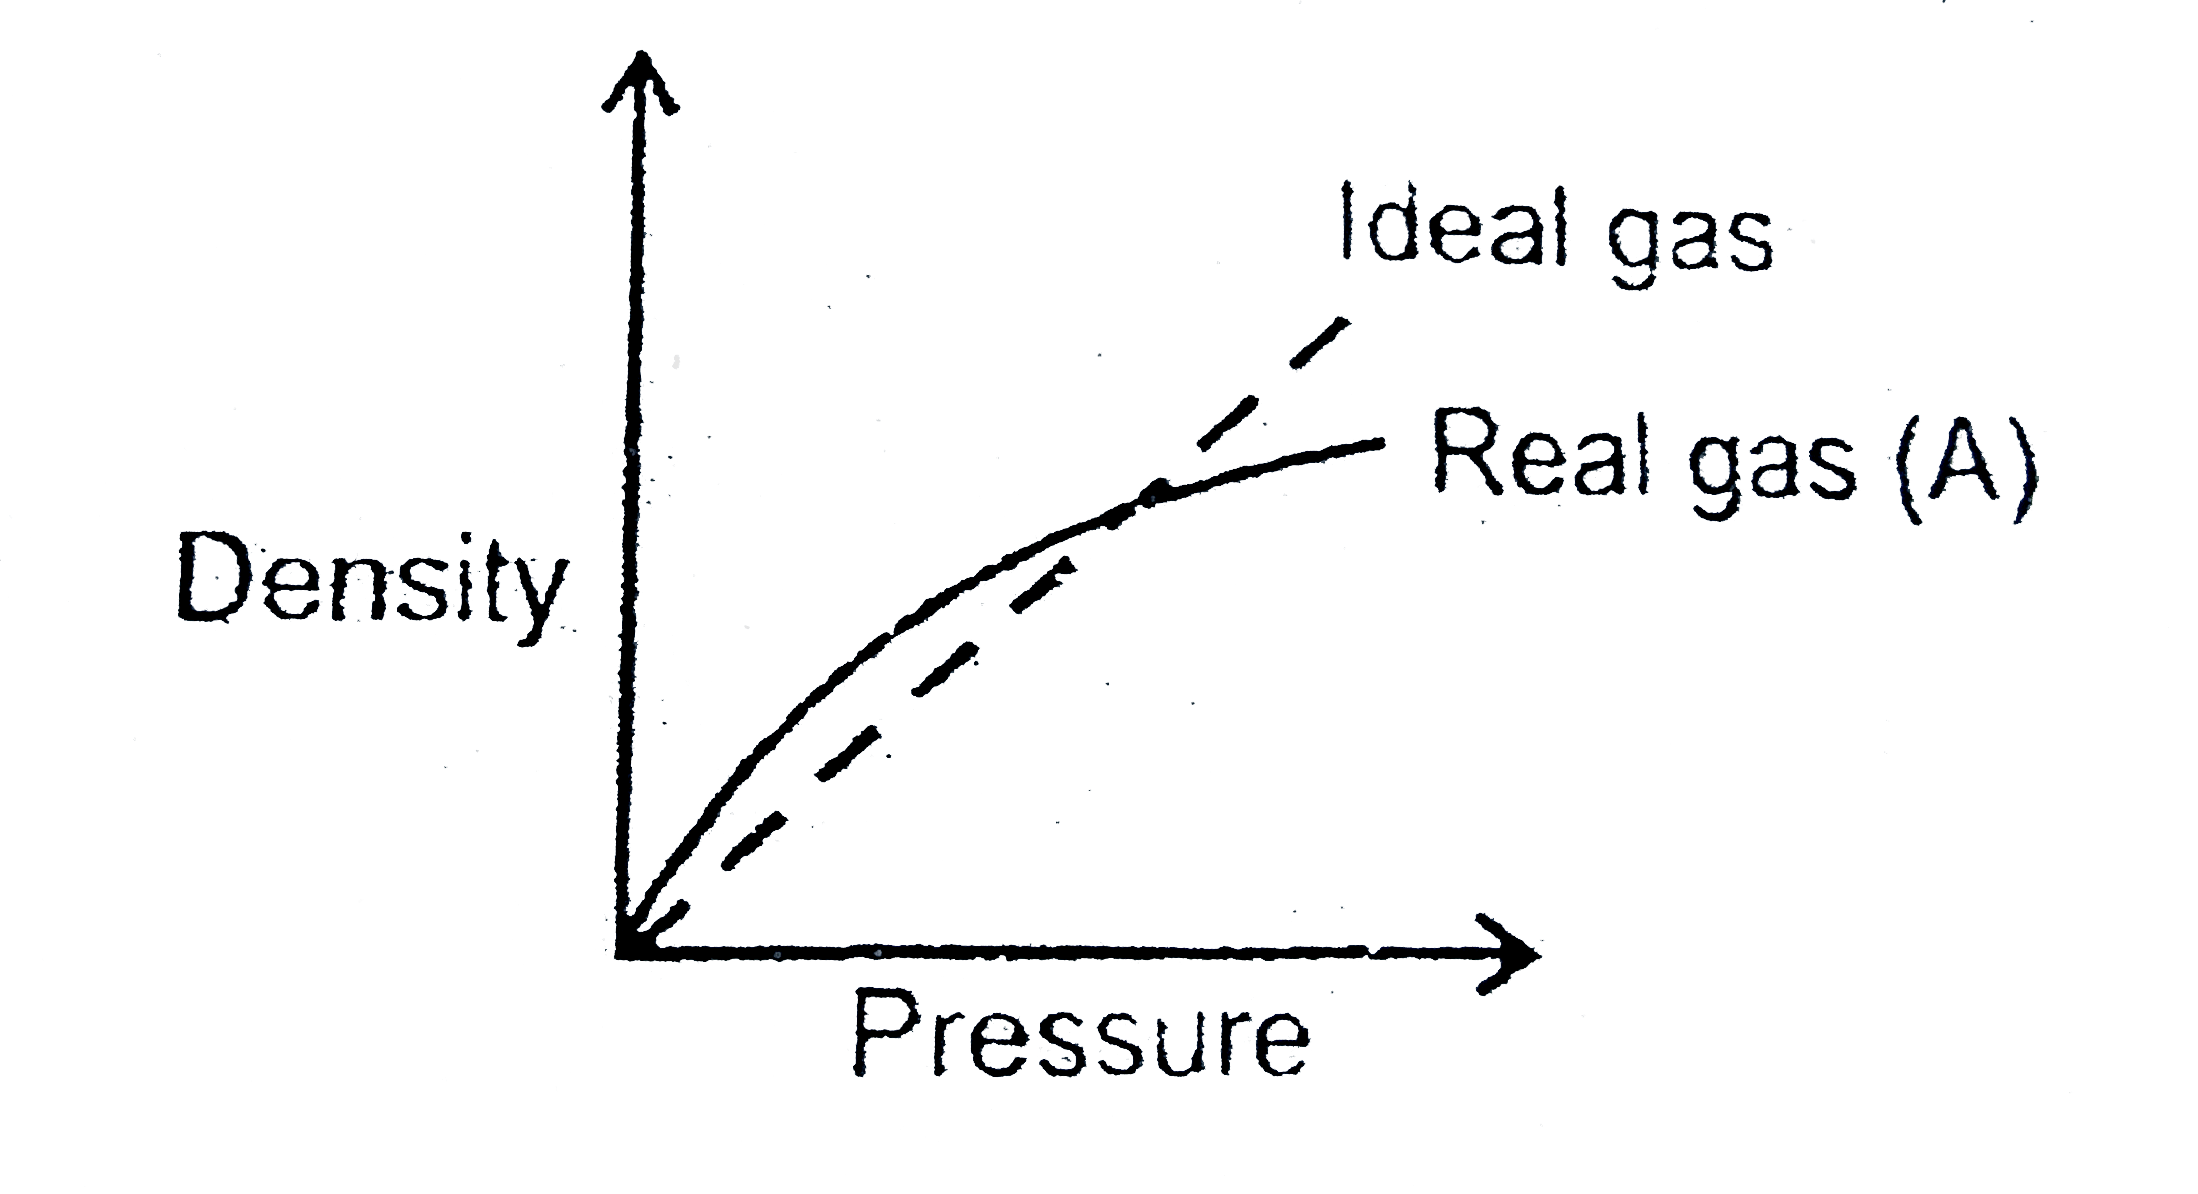
Which is/are correct for the gas?
A
Gas shows only negative deviation throughout the graph
B
Boyle temperature of gas must be more than 20∘C.
C
Motar volume of gas is less than that of ideal molar volune at 25∘C in low pressure region.
D
In the high pressure region, the gas is less compressible than ideal gas at 25∘C.
Video Solution
Text Solution
The correct Answer is:B, C, D
|
Updated on:21/07/2023
Topper's Solved these Questions
- BOOK - RESONANCECHAPTER - TEST PAPERSEXERCISE - PT-031videos
TEST PAPERS
- BOOK - RESONANCECHAPTER - TEST PAPERSEXERCISE - PART - III CHEMISTRY46videos
TEST PAPERS
- BOOK - RESONANCECHAPTER - SURFACE CHEMISTRYEXERCISE - Section - 51videos
SURFACE CHEMISTRY
- BOOK - RESONANCECHAPTER - TEST SERIESEXERCISE - CHEMISTRY50videos
TEST SERIES
Similar Questions
Knowledge Check
- Question 1 - Select One or More
Which is (are) correct for ideal gas ?
A(δUδT)P=0B(δTδP)H=0C(δEδV)T=0D(δUδP)T=0 - Question 2 - Select One or More
Which is (are) correct for ideal gas ?
A(δUδT)P=0B(δUδT)H=0C(δEδV)T=0D(δUδP)T=0 - Question 3 - Select One
Which of the following choice (s) is (are) correct for a gas?
APal>PrealBVal=VrealCPal<PrealDVal<Vreal
Which of the following graphs is not a straight line for an ideal gas ?
View SolutionIf the critical temperature of a gas is 500K, then which of the following is correct for the same gas ?
View SolutionWhich of the following plots are correct for an ideal gas ?
View SolutionWhich of the following expressions are correct for an ideal gas ?
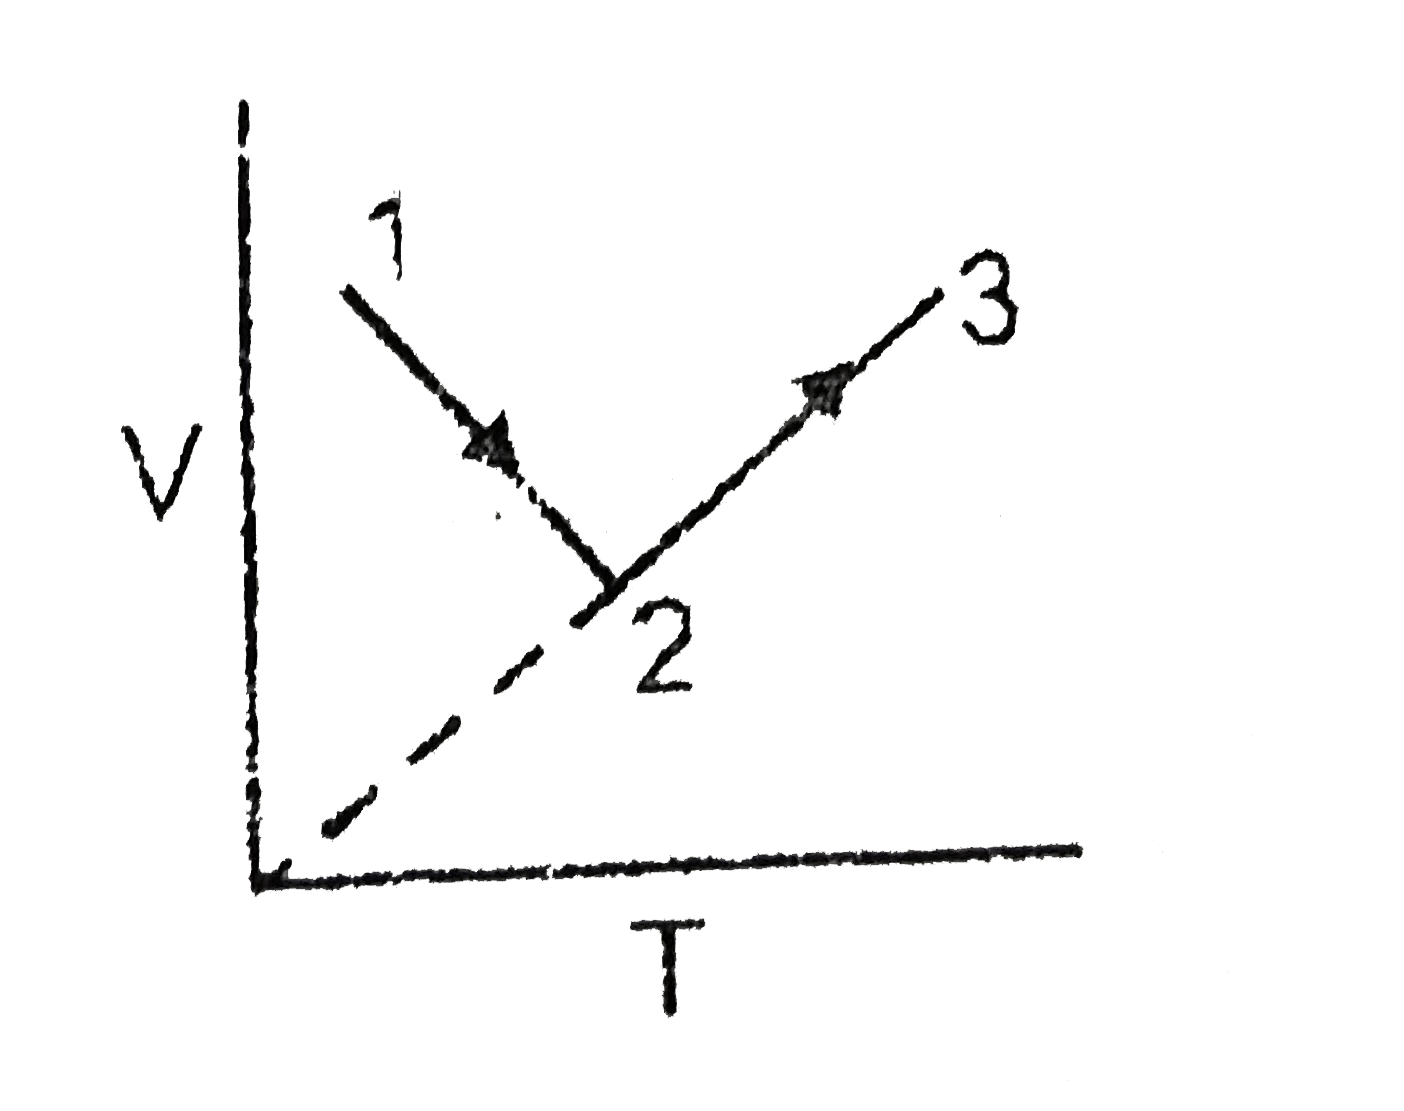
View SolutionFollowing graph is constucted for the fixed amount of the gas
 View Solution


