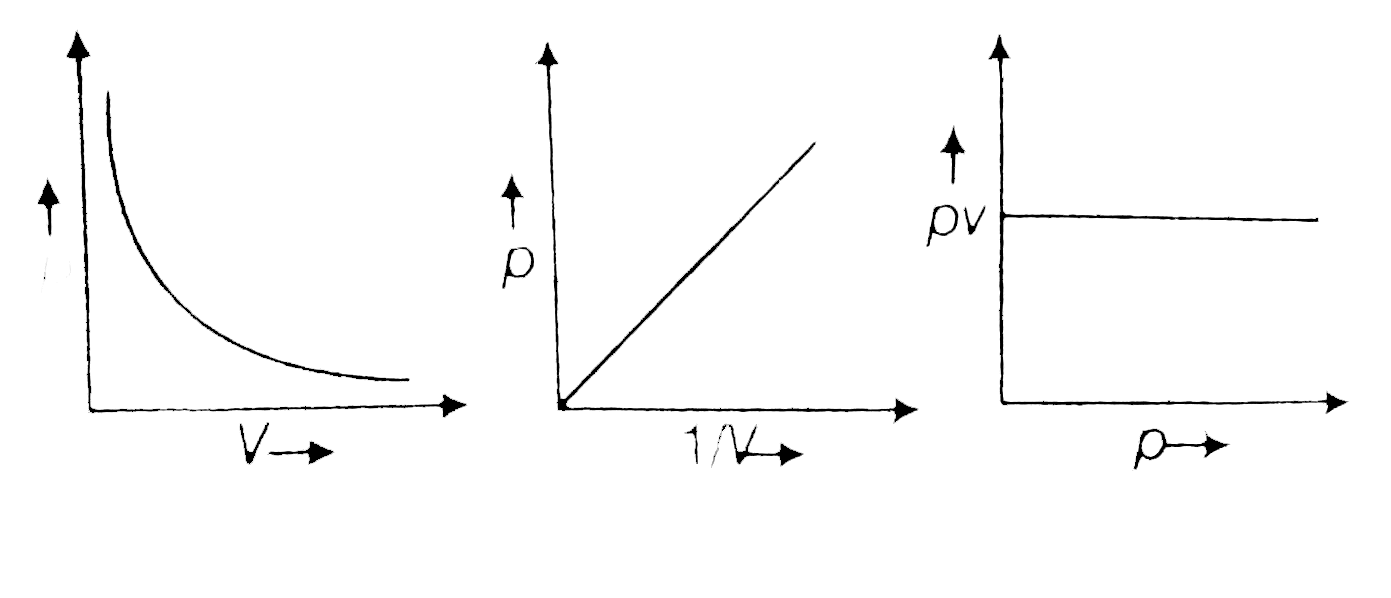
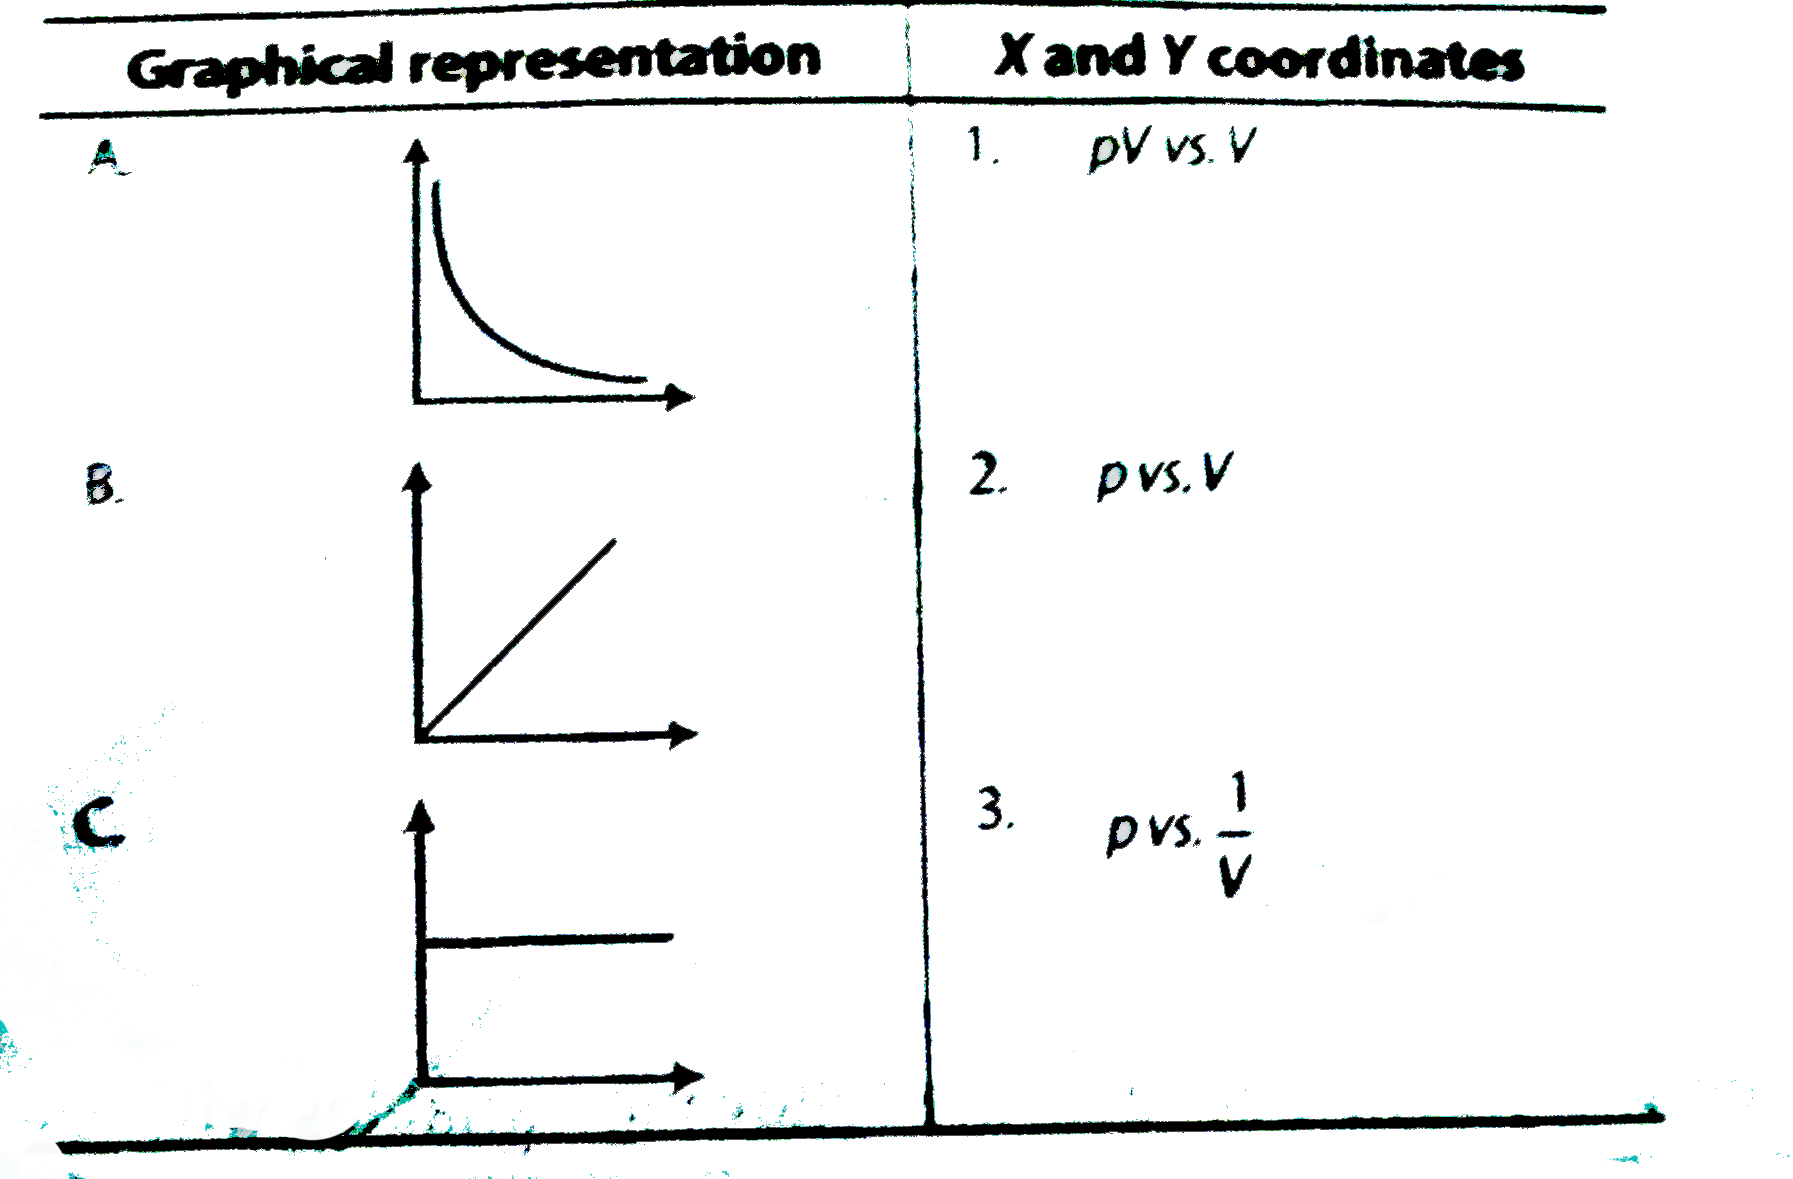
Match the following graphs of ideal gas with their coordinates.
Video Solution
Text Solution
The correct Answer is:A.→(2)B.→(3)C.→(1)
|
Topper's Solved these Questions
- STATES OF MATTERBOOK - NCERT EXEMPLARCHAPTER - STATES OF MATTEREXERCISE - Assertion and Reason
6 Videos
- STATES OF MATTERBOOK - NCERT EXEMPLARCHAPTER - STATES OF MATTEREXERCISE - Long Answer Type Question
6 Videos
- STATES OF MATTERBOOK - NCERT EXEMPLARCHAPTER - STATES OF MATTEREXERCISE - Short Answer Type Question
23 Videos
- SOME BASIC CONCEPTS OF CHEMISTRYBOOK - NCERT EXEMPLARCHAPTER - SOME BASIC CONCEPTS OF CHEMISTRYEXERCISE - All Questions
45 Videos
- STRUCTURE OF ATOMBOOK - NCERT EXEMPLARCHAPTER - STRUCTURE OF ATOMEXERCISE - All Questions
53 Videos
Similar Questions
Knowledge Check
Which of the following graphs correctly represents the variation of β=−(dV/dP)/V with P for an ideal gas at constant temperature?
A B
B C
C D
D
Which of the following graphs correctly represents the variation of β=−dV/dPV
with P for an ideal gas at constant temperature?A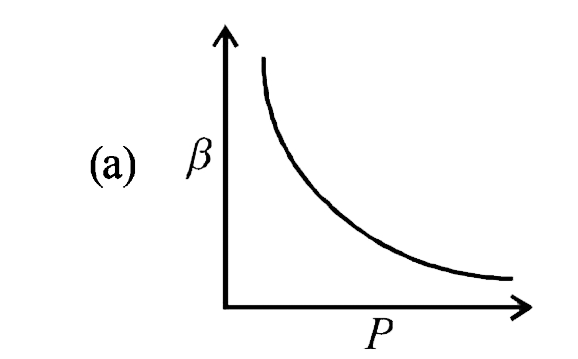 B
B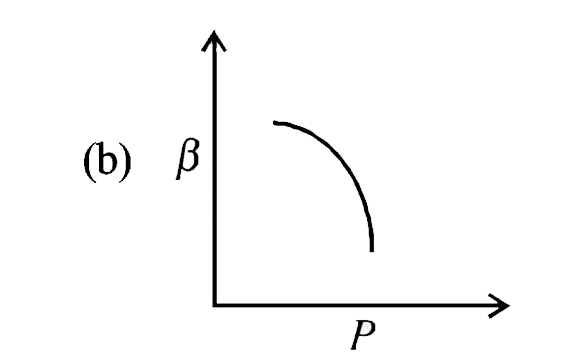 C
C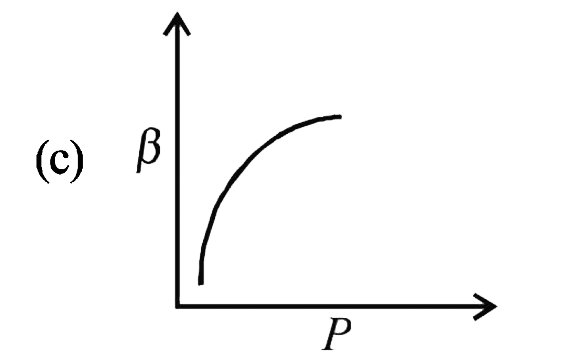 D
D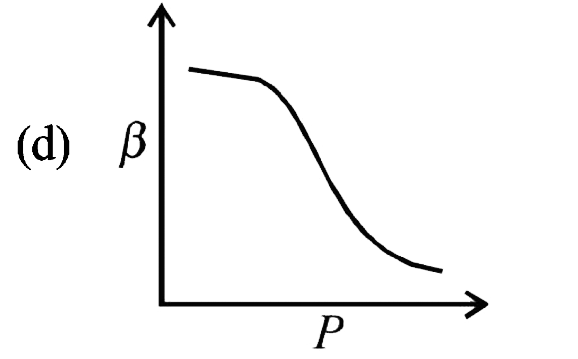
Which of the following graphs correctly represents the variation of β=−(dVdP)/V with P for an ideal gas at constant temperature
A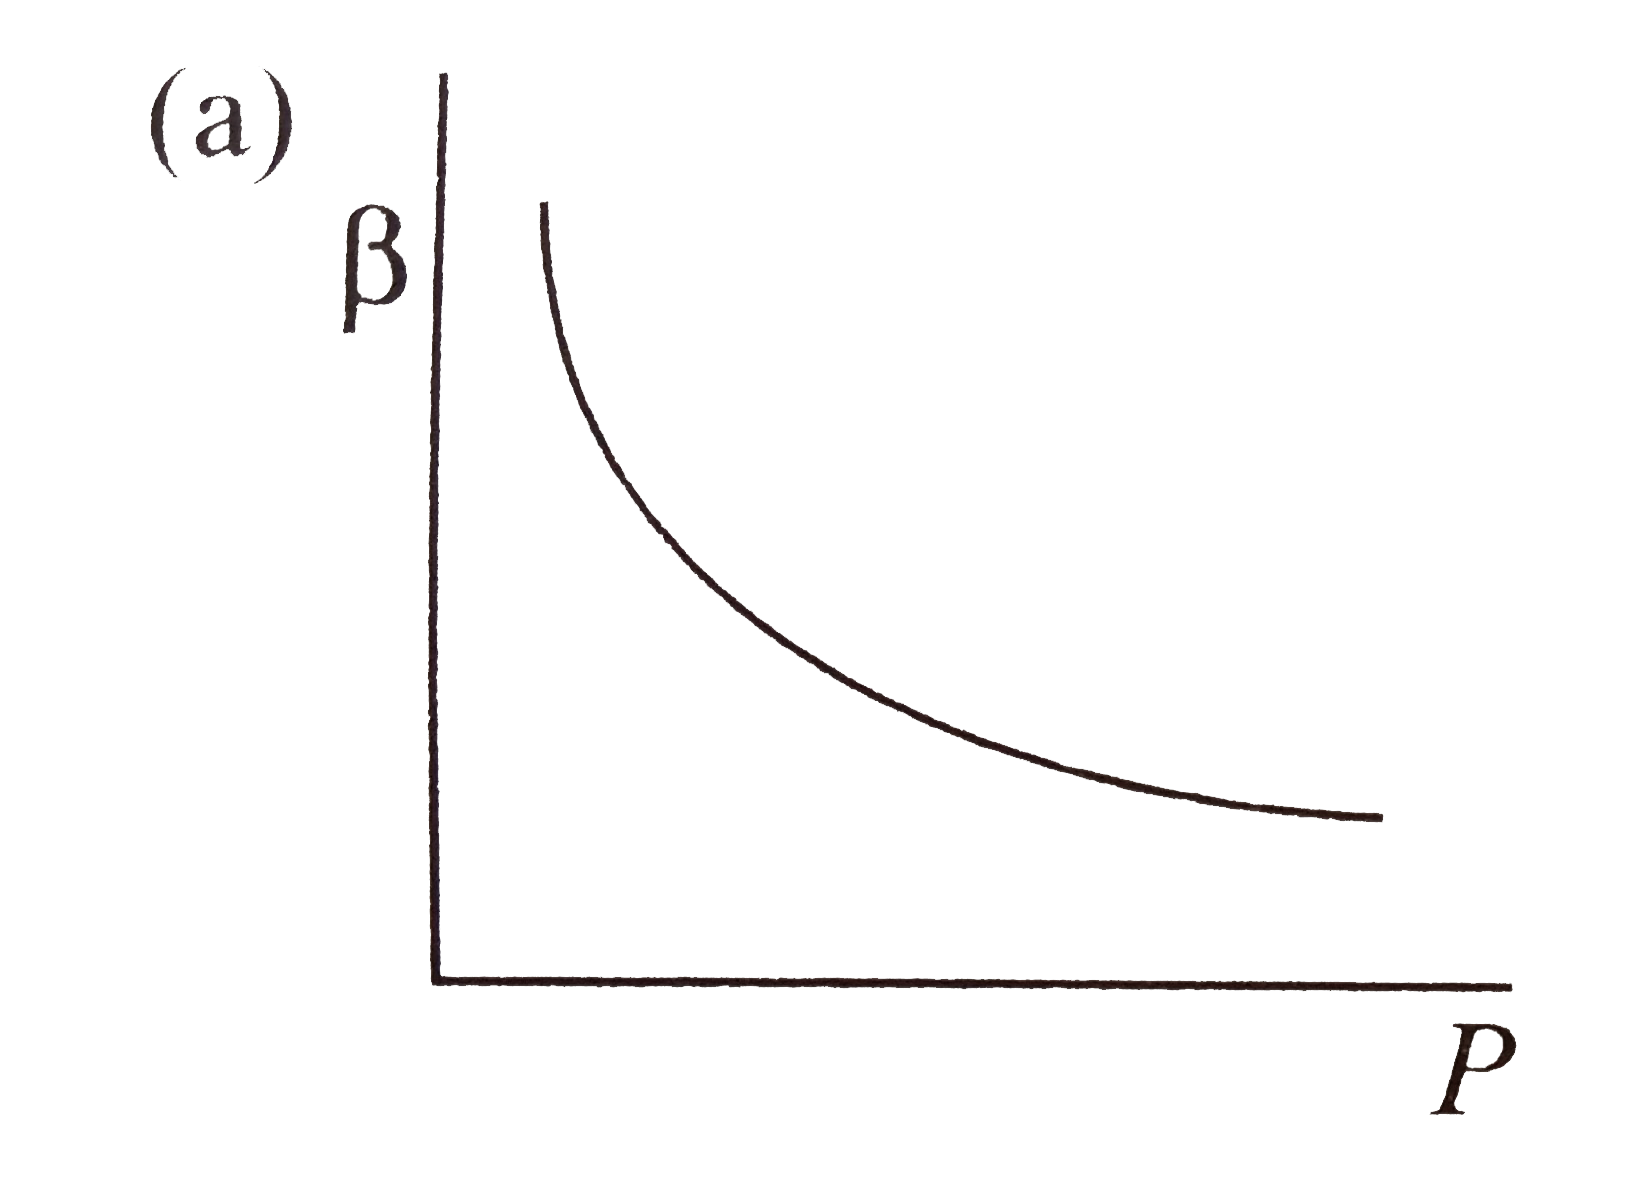 B
B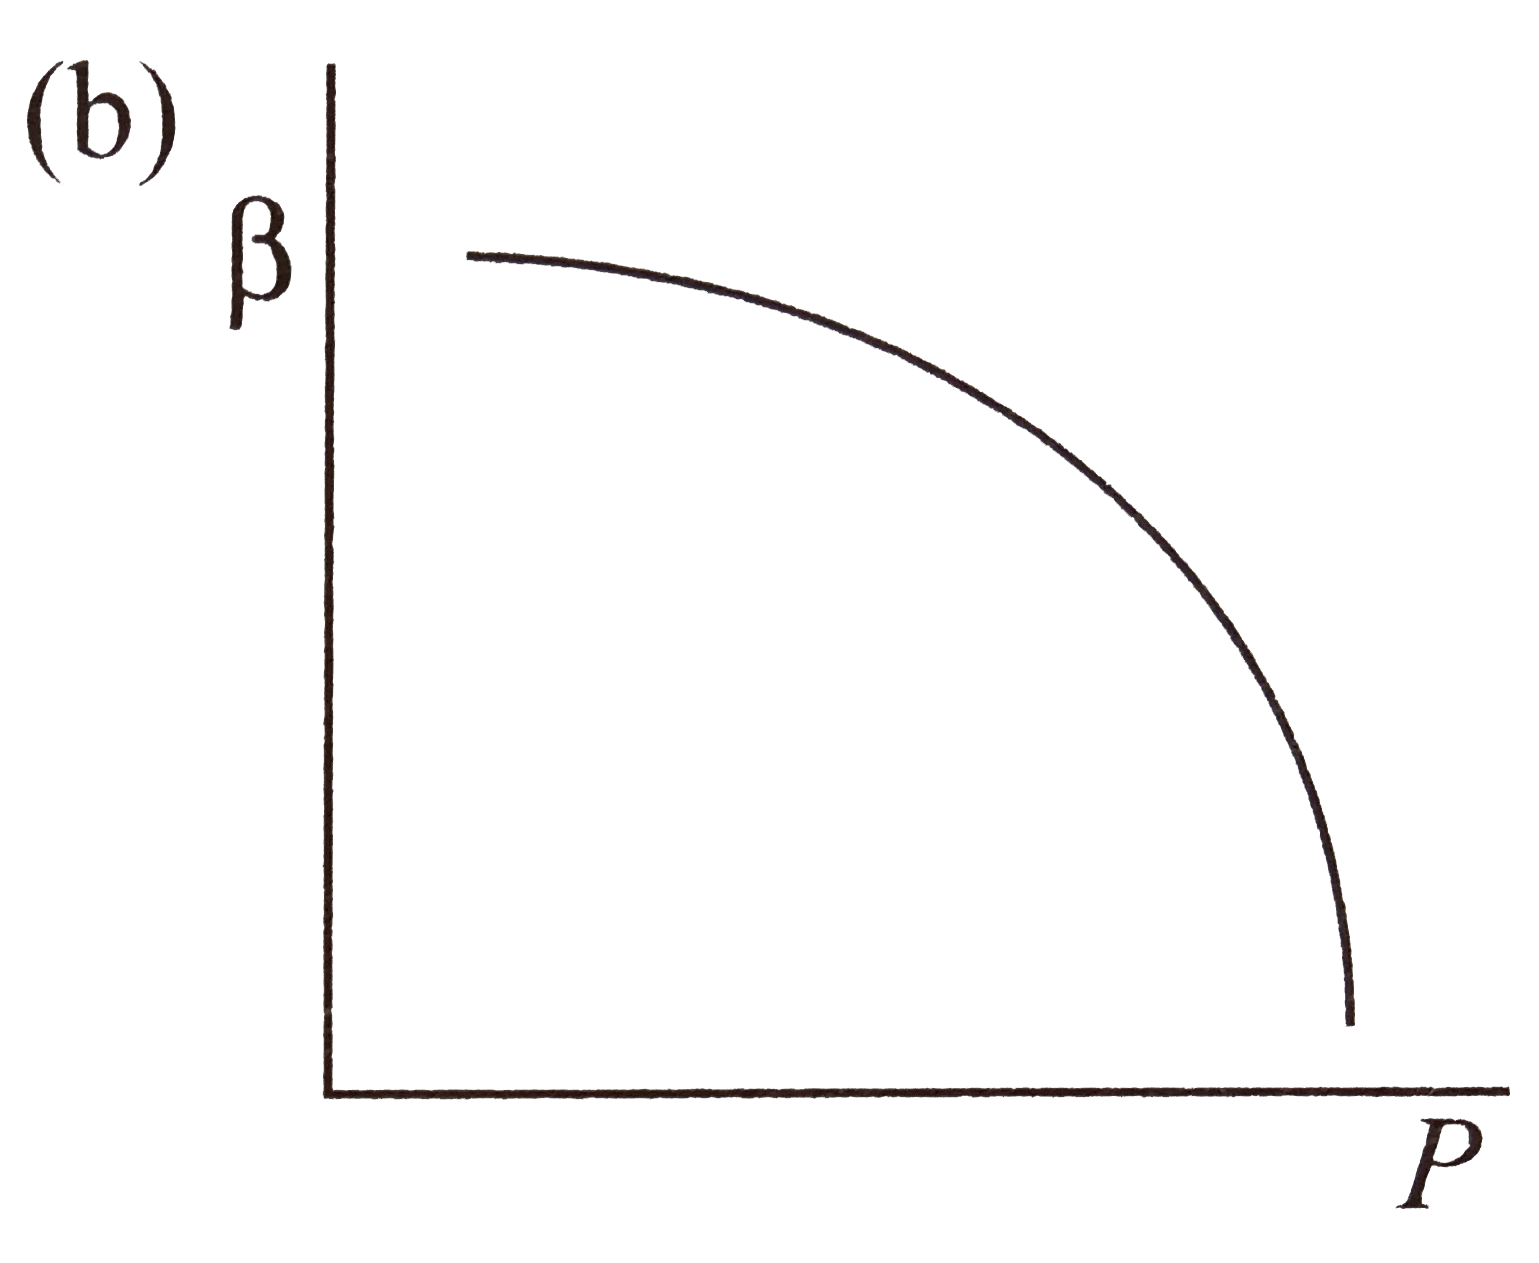 C
C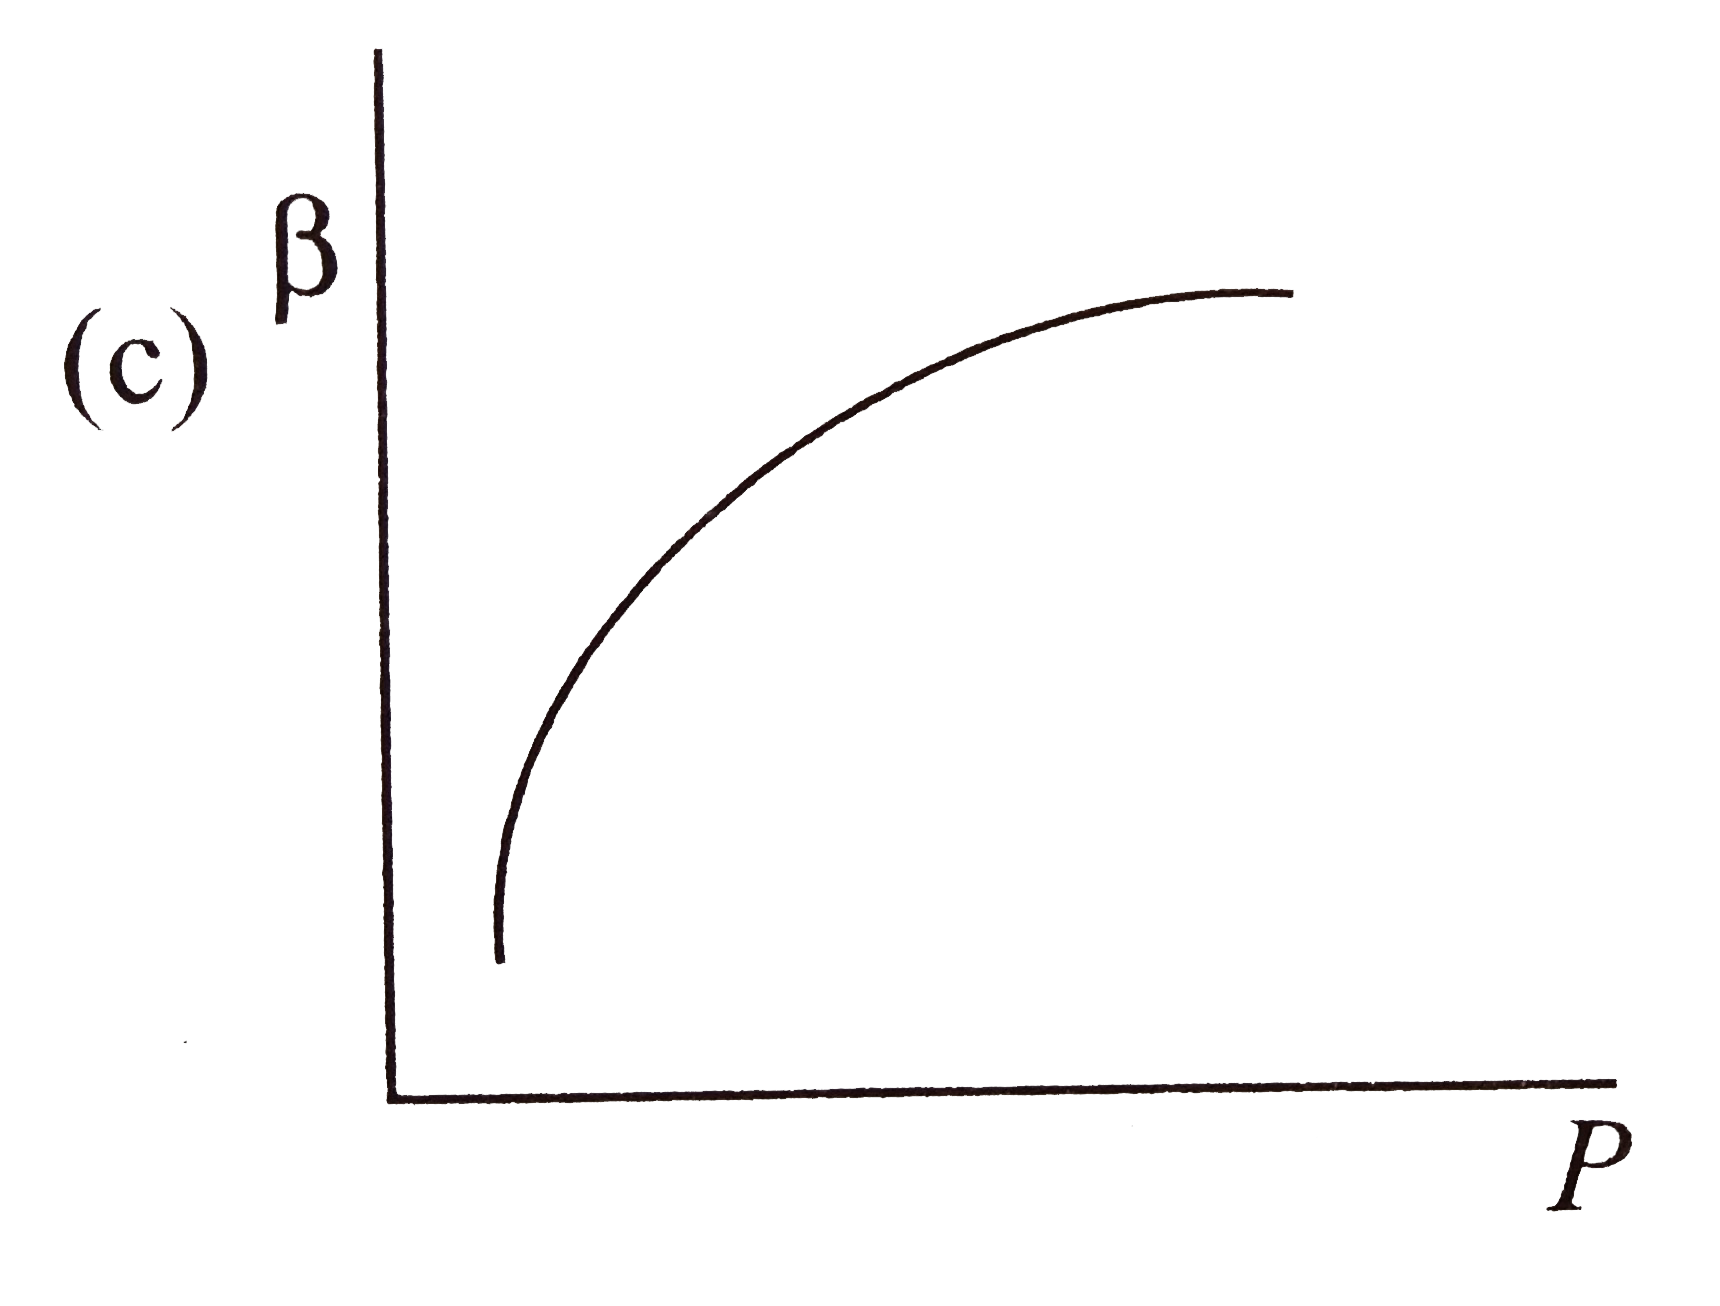 D
D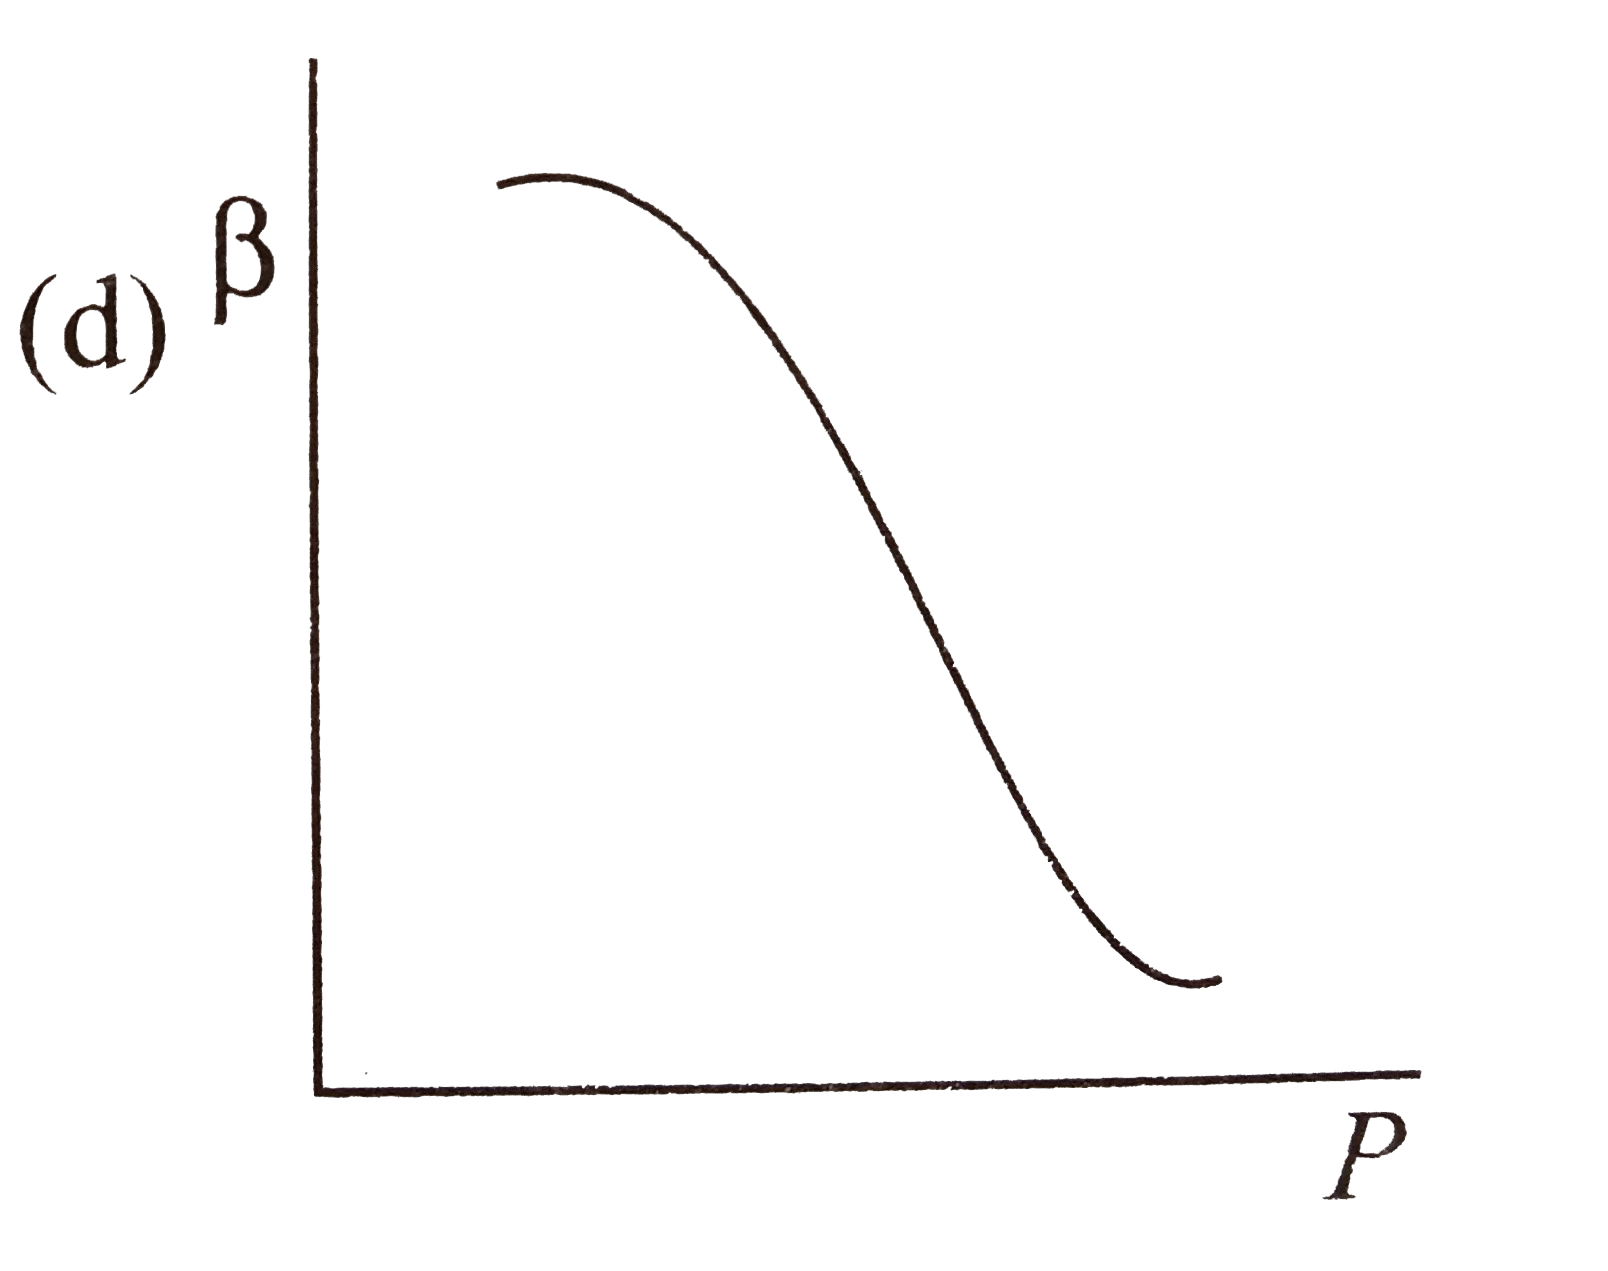
For a ideal monoatomic gas match the following graphs for constant mass in different processes (ρ = Density of gas)
_E01_156_Q01.png)
View SolutionWork done on a ideal gas in a cylinder when it is compressed by an external pressure in a single step is shown below :
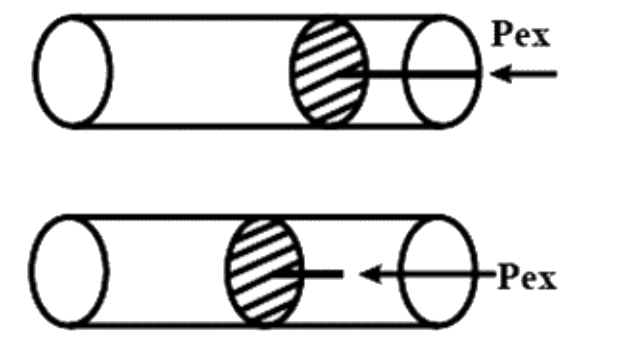
Which of the following graphs will show the work done on the gas?
View SolutionMatch the graphs between the following variables with their names :
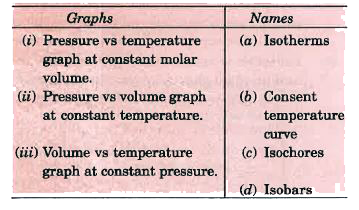
View SolutionWhich of the following graphs correctly represents the variation of β=−dV/dPV
with P for an ideal gas at constant temperature?
View SolutionWhich of the following graphs correctly represents the variation of β=−(dVdP)1V with P for an ideal gas at constant temperature ?
View Solution

