Which of the following plots are correct for an ideal gas ?
The correct Answer is:A, C
To determine which plots are correct for an ideal gas, we will analyze each graph based on the fundamental gas laws: Boyle's Law, Charles's Law, and Gay-Lussac's Law.
1. Understanding Boyle's Law:
- Boyle's Law states that at constant temperature, the pressure (P) of a gas is inversely proportional to its volume (V).
- Mathematically, this can be expressed as: P∝1V or PV=k (where k is a constant).
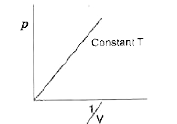
2. Analyzing the First Graph (P vs. 1/V):
- The first graph plots pressure (P) against the reciprocal of volume (1/V).
- According to Boyle's Law, if P∝1V, then this relationship will yield a straight line when plotted as P vs. 1/V.
- Conclusion: This graph is correct.
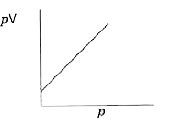
3. Analyzing the Second Graph (PV vs. P):
- The second graph plots the product of pressure and volume (PV) against pressure (P) at constant temperature.
- According to Boyle's Law, PV=k is a constant, which means that if we plot PV against P, it should yield a horizontal line (constant value) parallel to the pressure axis.
- Conclusion: This graph is incorrect as it does not represent a constant value.
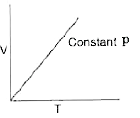
4. Analyzing the Third Graph (V vs. T):
- The third graph plots volume (V) against temperature (T) at constant pressure.
- According to Charles's Law, volume is directly proportional to temperature: V∝T.
- This relationship yields a straight line with a constant slope when plotted.
- Conclusion: This graph is correct.
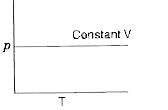
5. Analyzing the Fourth Graph (P vs. T):
- The fourth graph plots pressure (P) against temperature (T) at constant volume.
- According to Gay-Lussac's Law, pressure is directly proportional to temperature: P∝T.
- This relationship also yields a straight line with a constant slope when plotted.
- However, if the graph shown is parallel to the temperature axis, it suggests that pressure does not change with temperature, which is incorrect.
- Conclusion: This graph is incorrect.
Final Answer:
The correct plots for an ideal gas are Option A (P vs. 1/V) and Option C (V vs. T).
- Boyle's Law states that at constant temperature, the pressure (P) of a gas is inversely proportional to its volume (V).
- Mathematically, this can be expressed as: P∝1V or PV=k (where k is a constant).
- The first graph plots pressure (P) against the reciprocal of volume (1/V).
- According to Boyle's Law, if P∝1V, then this relationship will yield a straight line when plotted as P vs. 1/V.
- Conclusion: This graph is correct.
- The second graph plots the product of pressure and volume (PV) against pressure (P) at constant temperature.
- According to Boyle's Law, PV=k is a constant, which means that if we plot PV against P, it should yield a horizontal line (constant value) parallel to the pressure axis.
- Conclusion: This graph is incorrect as it does not represent a constant value.
- The third graph plots volume (V) against temperature (T) at constant pressure.
- According to Charles's Law, volume is directly proportional to temperature: V∝T.
- This relationship yields a straight line with a constant slope when plotted.
- Conclusion: This graph is correct.
- The fourth graph plots pressure (P) against temperature (T) at constant volume.
- According to Gay-Lussac's Law, pressure is directly proportional to temperature: P∝T.
- This relationship also yields a straight line with a constant slope when plotted.
- However, if the graph shown is parallel to the temperature axis, it suggests that pressure does not change with temperature, which is incorrect.
- Conclusion: This graph is incorrect.
The correct plots for an ideal gas are Option A (P vs. 1/V) and Option C (V vs. T).
Topper's Solved these Questions
- STATES OF MATTER : GASES AND LIQUIDSBOOK - MODERN PUBLICATIONCHAPTER - STATES OF MATTER : GASES AND LIQUIDSEXERCISE - COMPETITION FILE OBJECTIVE TYPE QUESTIONS (D. MULTIPLE CHOICE QUESTIONS)
7 Videos
- STATES OF MATTER : GASES AND LIQUIDSBOOK - MODERN PUBLICATIONCHAPTER - STATES OF MATTER : GASES AND LIQUIDSEXERCISE - COMPETITION FILE OBJECTIVE TYPE QUESTIONS (D. MULTIPLE CHOICE QUESTIONS)(Matrix Match Type Question)
2 Videos
- STATES OF MATTER : GASES AND LIQUIDSBOOK - MODERN PUBLICATIONCHAPTER - STATES OF MATTER : GASES AND LIQUIDSEXERCISE - COMPETITION FILE OBJECTIVE TYPE QUESTIONS (B. MULTIPLE CHOICE QUESTIONS)(JEE (ADVANCED) FOR IIT ENTRANCE)
8 Videos
- SOME BASIC CONCEPTS OF CHEMISTRY BOOK - MODERN PUBLICATIONCHAPTER - SOME BASIC CONCEPTS OF CHEMISTRY EXERCISE - COMPETITION FILE (INTEGER TYPE AND NUMERICAL VALUE TYPE QUESTIONS)
10 Videos
- STRUCTURE OF ATOMBOOK - MODERN PUBLICATIONCHAPTER - STRUCTURE OF ATOMEXERCISE - Unit Practice Test
13 Videos
Similar Questions
Knowledge Check
Which of the following curve is correct for an ideal gas ?
A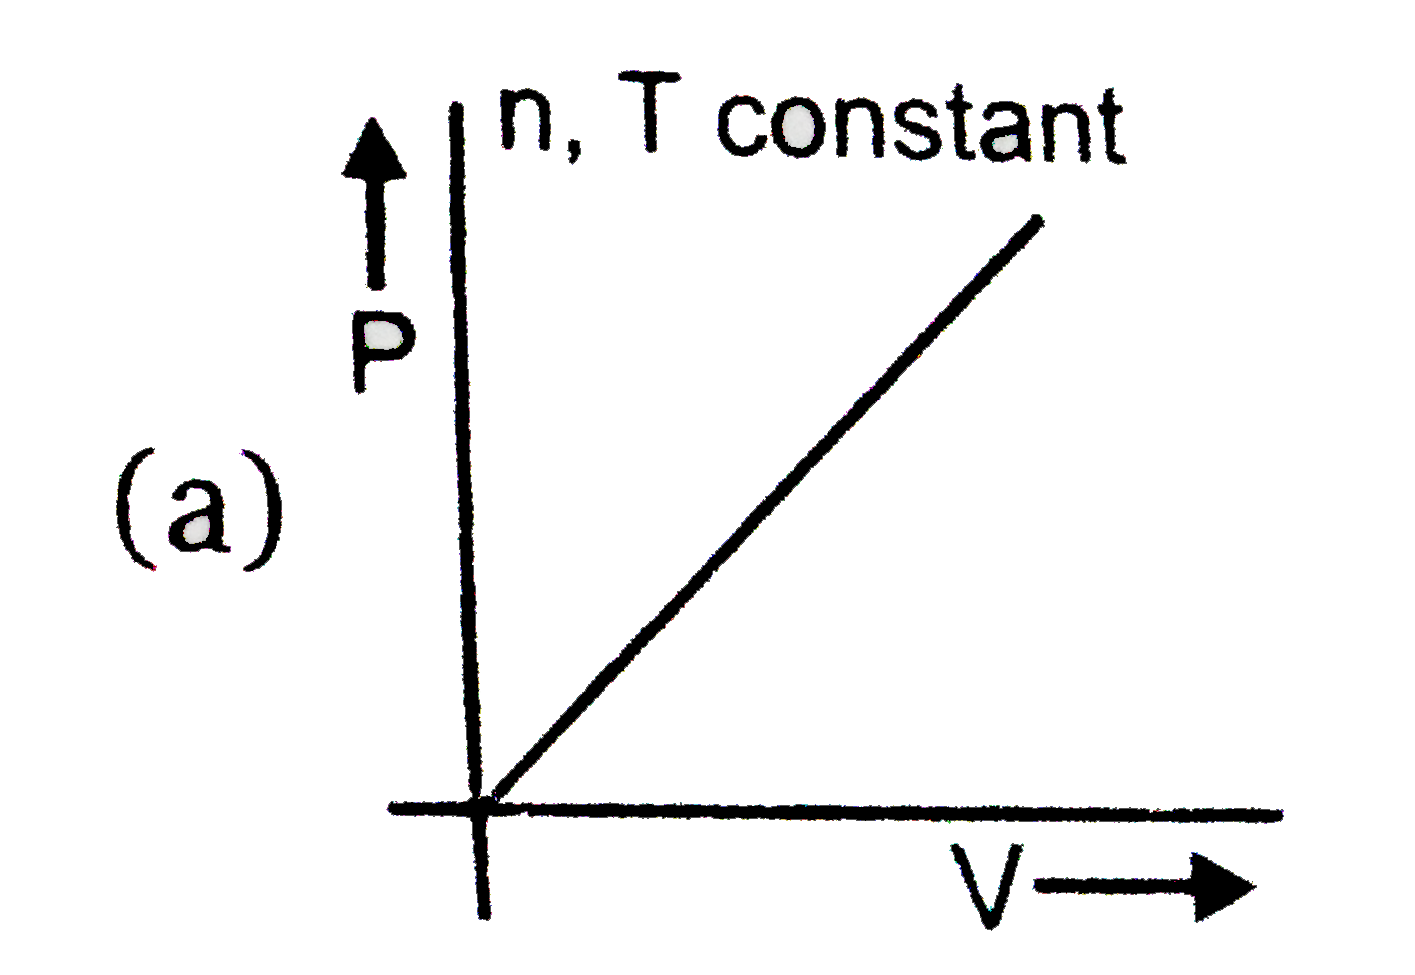 B
B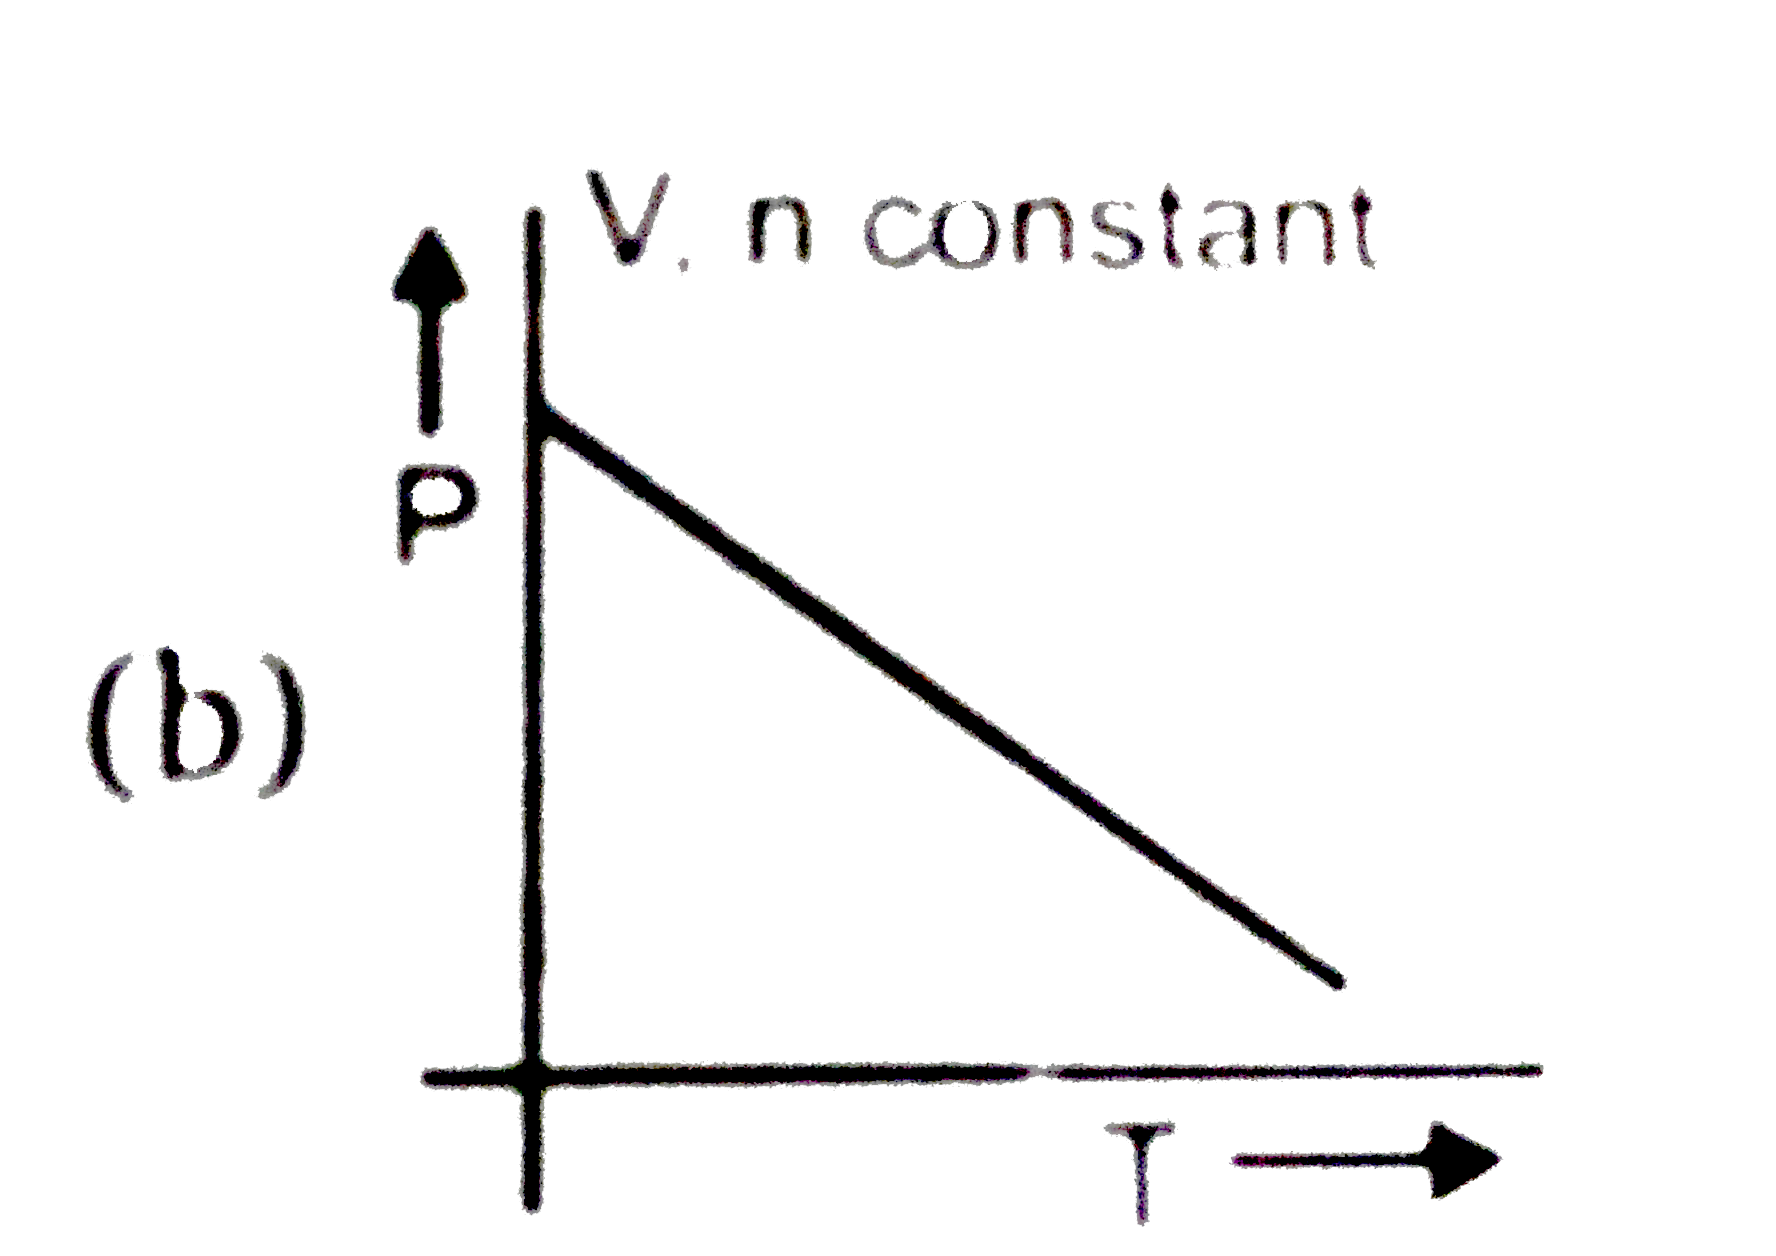 C
C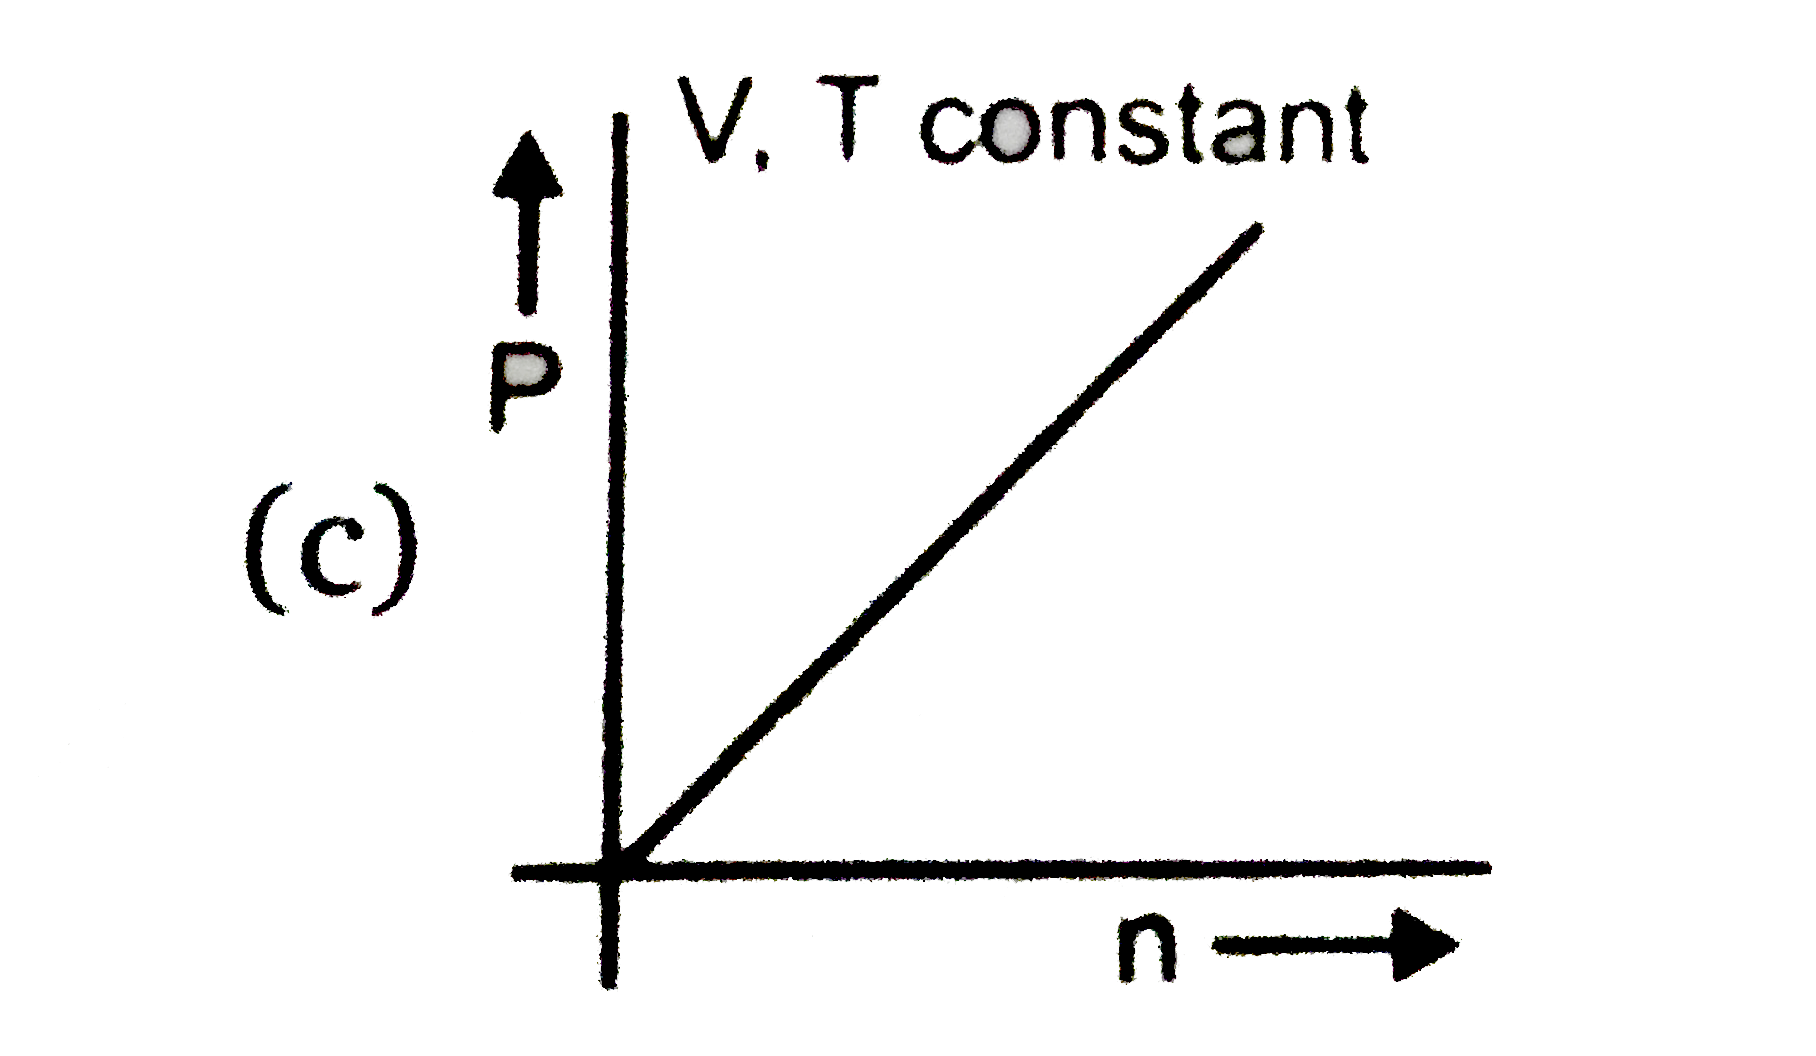 D
D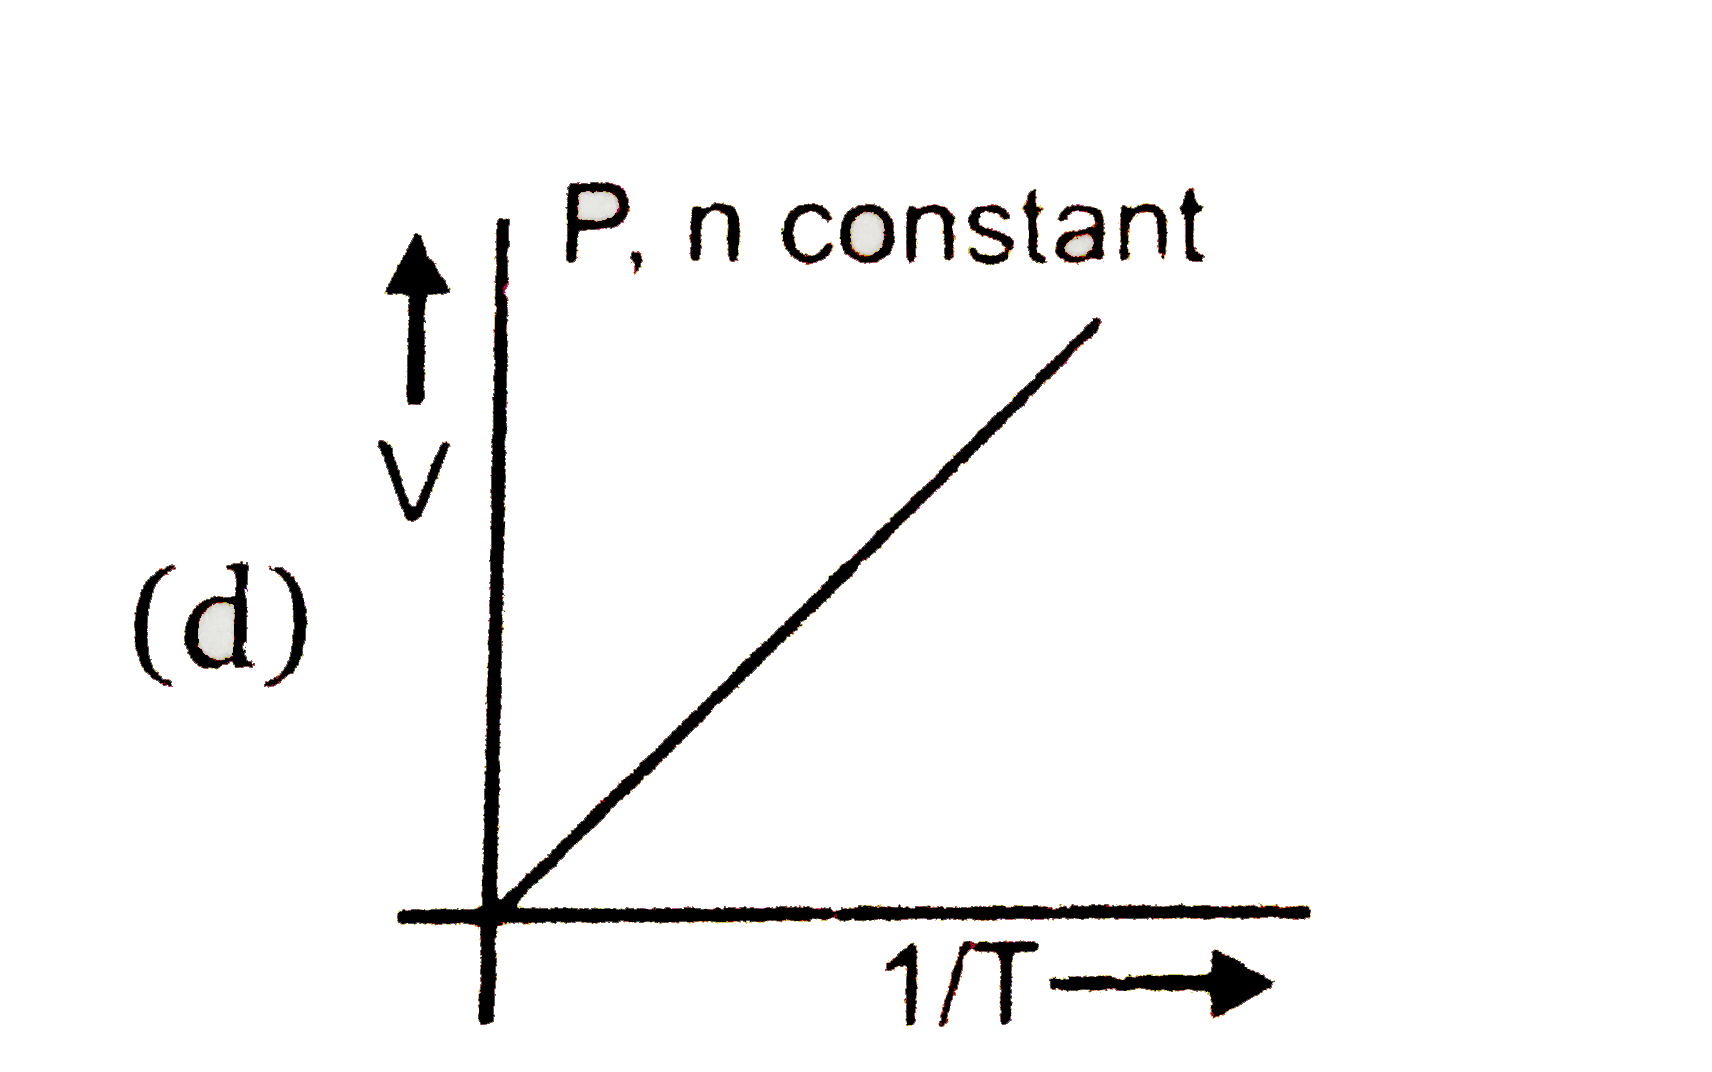
Which of the following expressions are correct for an ideal gas ?
A(∂U∂V)T=0B(∂U∂P)T=0C(∂Cv∂V)T=0D(∂Cv∂P)T=0Which of the following expressions is correct for an ideal gas?
AP=23VNA¯¯¯EBP=32vNA¯¯¯ECP=23NAV¯¯¯EDP=32NAV¯¯¯E
Which of the following relation is correct for an ideal gas ?
View SolutionWhich of the following is not correct for an ideal gas as per first low of thermodynamics
View SolutionWhich of the following graph is incorrect for an ideal gas?

View SolutionWhich of the following expressions is correct for an ideal gas?
View SolutionGases deviate from ideal gas behaviour at high pressure. Which of the following is correct for non ideality?
View Solution
