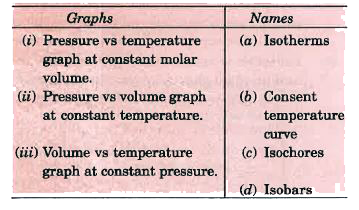
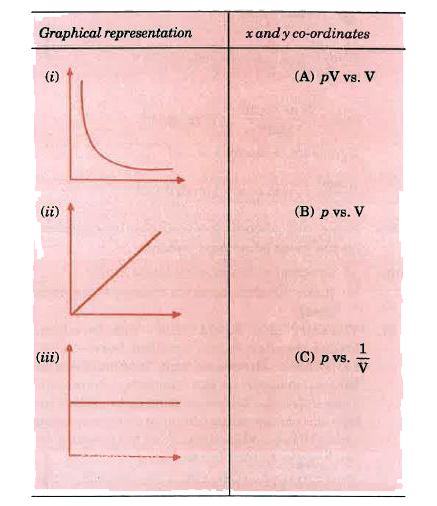
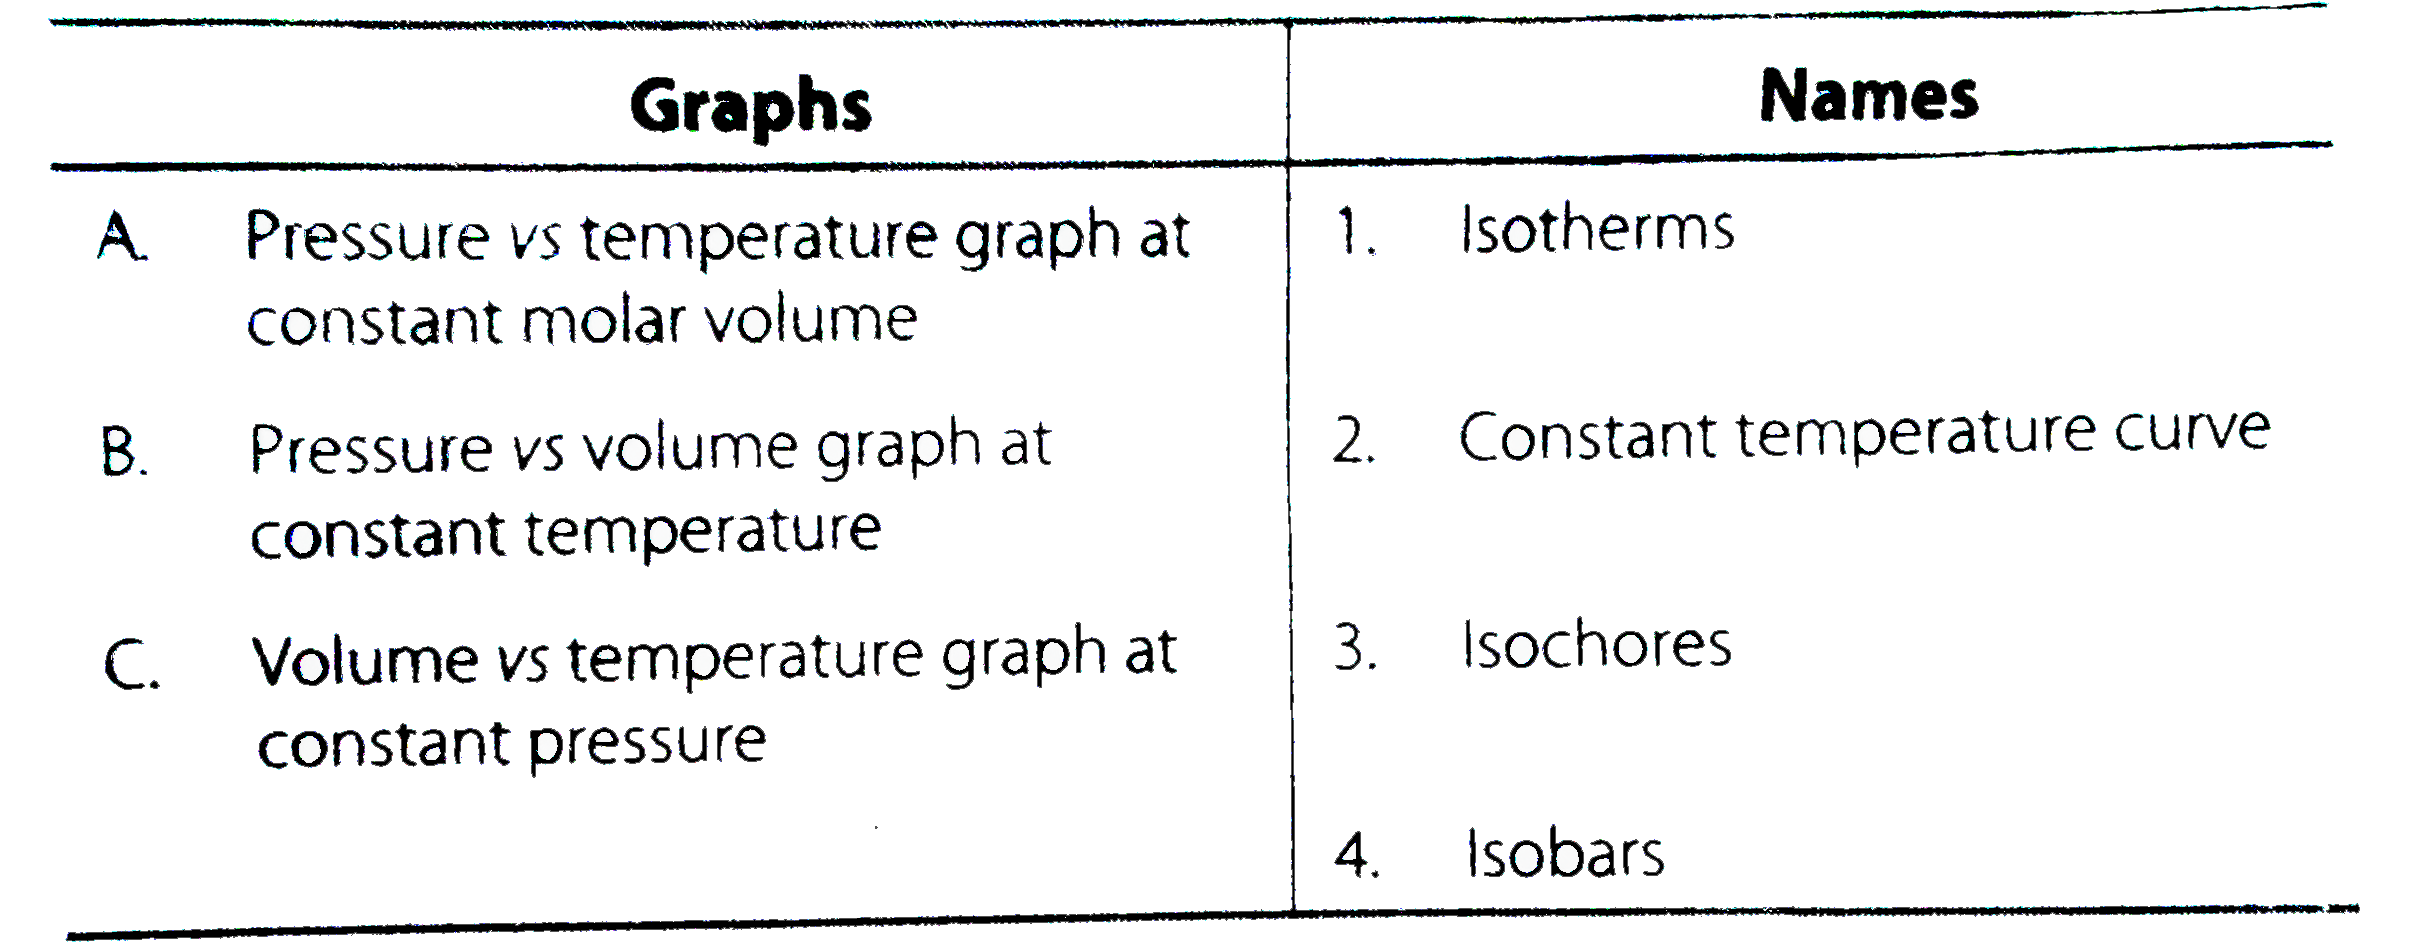
Match the following graphs of ideal gas with their coordinates :
Video Solution
Text Solution
(i)−(b),(ii)−(c),(iii)−(a)
|
Topper's Solved these Questions
- STATES OF MATTER : GASES AND LIQUIDSBOOK - MODERN PUBLICATIONCHAPTER - STATES OF MATTER : GASES AND LIQUIDSEXERCISE - NCERT FILE NCERT (EXemplar Problems) (Assertion and Reason Type Questions)
6 Videos
- STATES OF MATTER : GASES AND LIQUIDSBOOK - MODERN PUBLICATIONCHAPTER - STATES OF MATTER : GASES AND LIQUIDSEXERCISE - NCERT FILE NCERT (EXemplar Problems) (Long Answer Questions)
6 Videos
- STATES OF MATTER : GASES AND LIQUIDSBOOK - MODERN PUBLICATIONCHAPTER - STATES OF MATTER : GASES AND LIQUIDSEXERCISE - NCERT FILE NCERT (EXemplar Problems) (Multiple Choice Questions (Type-I))
24 Videos
- SOME BASIC CONCEPTS OF CHEMISTRY BOOK - MODERN PUBLICATIONCHAPTER - SOME BASIC CONCEPTS OF CHEMISTRY EXERCISE - COMPETITION FILE (INTEGER TYPE AND NUMERICAL VALUE TYPE QUESTIONS)
10 Videos
- STRUCTURE OF ATOMBOOK - MODERN PUBLICATIONCHAPTER - STRUCTURE OF ATOMEXERCISE - Unit Practice Test
13 Videos
Similar Questions
Knowledge Check
Which of the following graphs correctly represents the variation of β=−(dV/dP)/V with P for an ideal gas at constant temperature?
A B
B C
C D
D
Which of the following graphs correctly represents the variation of β=−(dVdP)/V with P for an ideal gas at constant temperature
A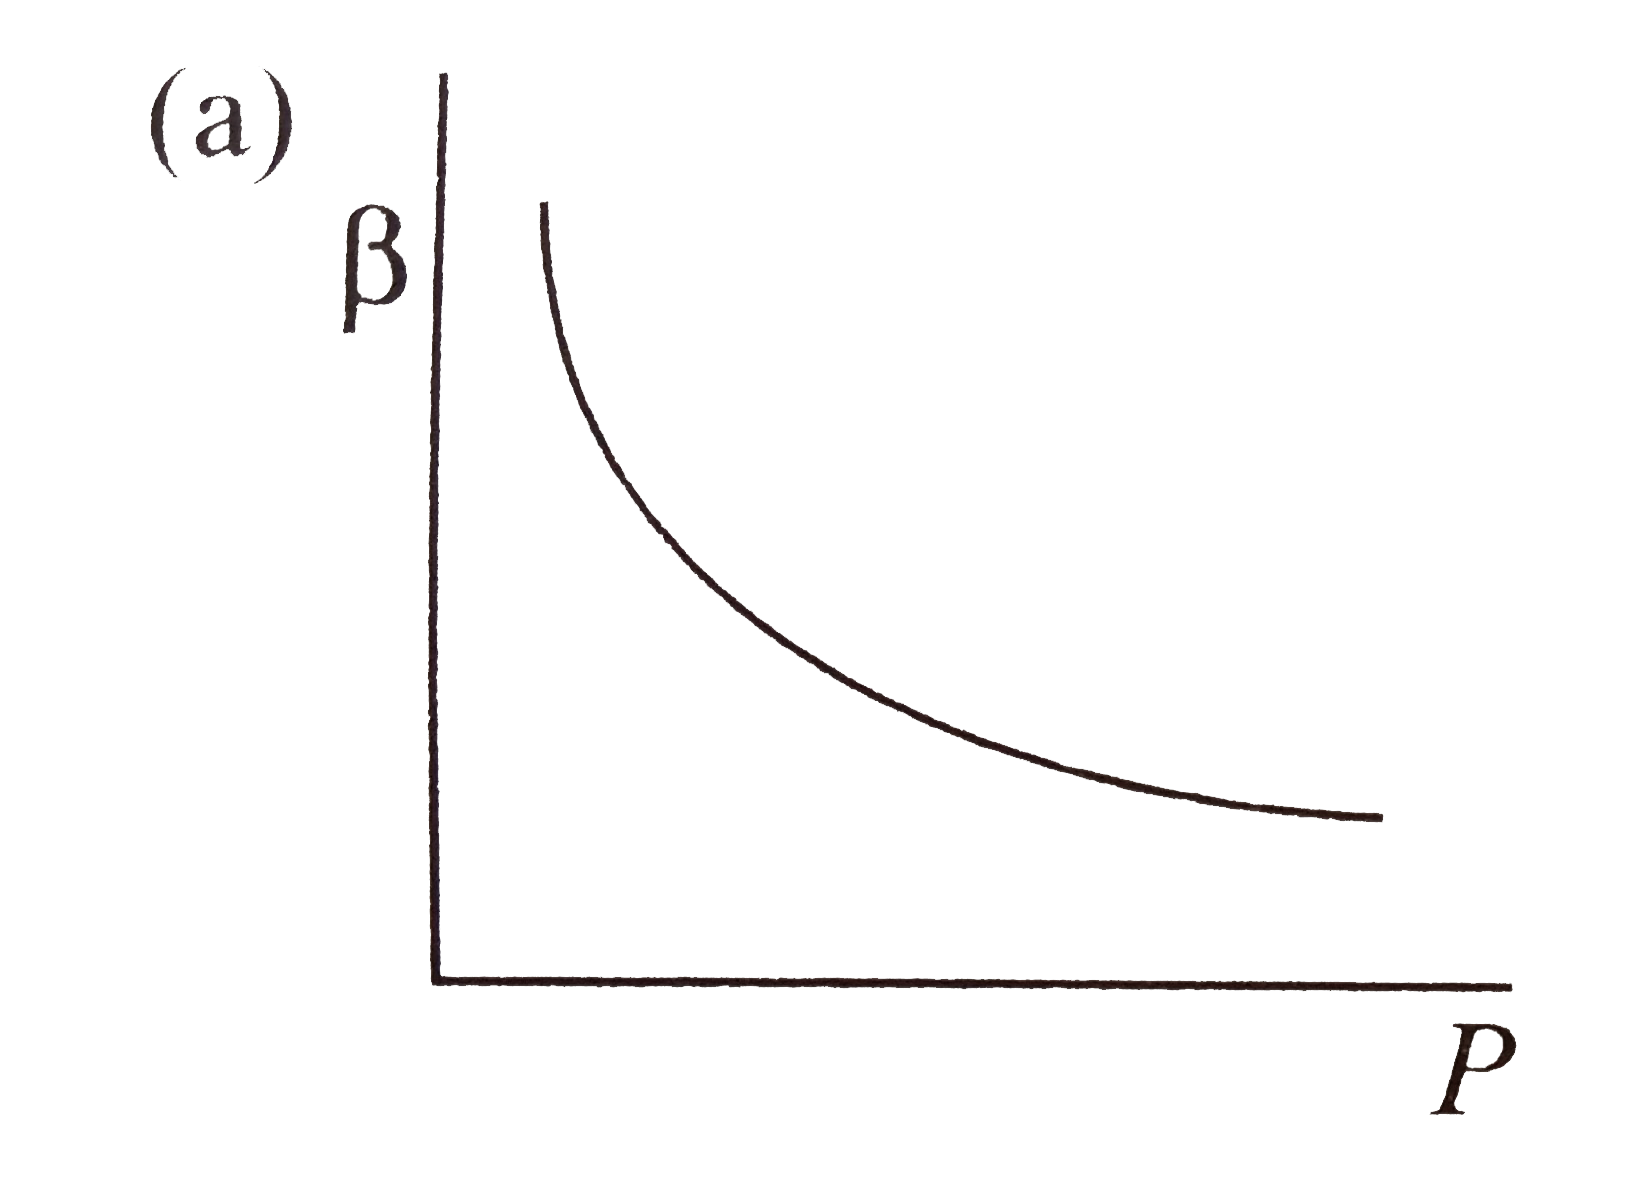 B
B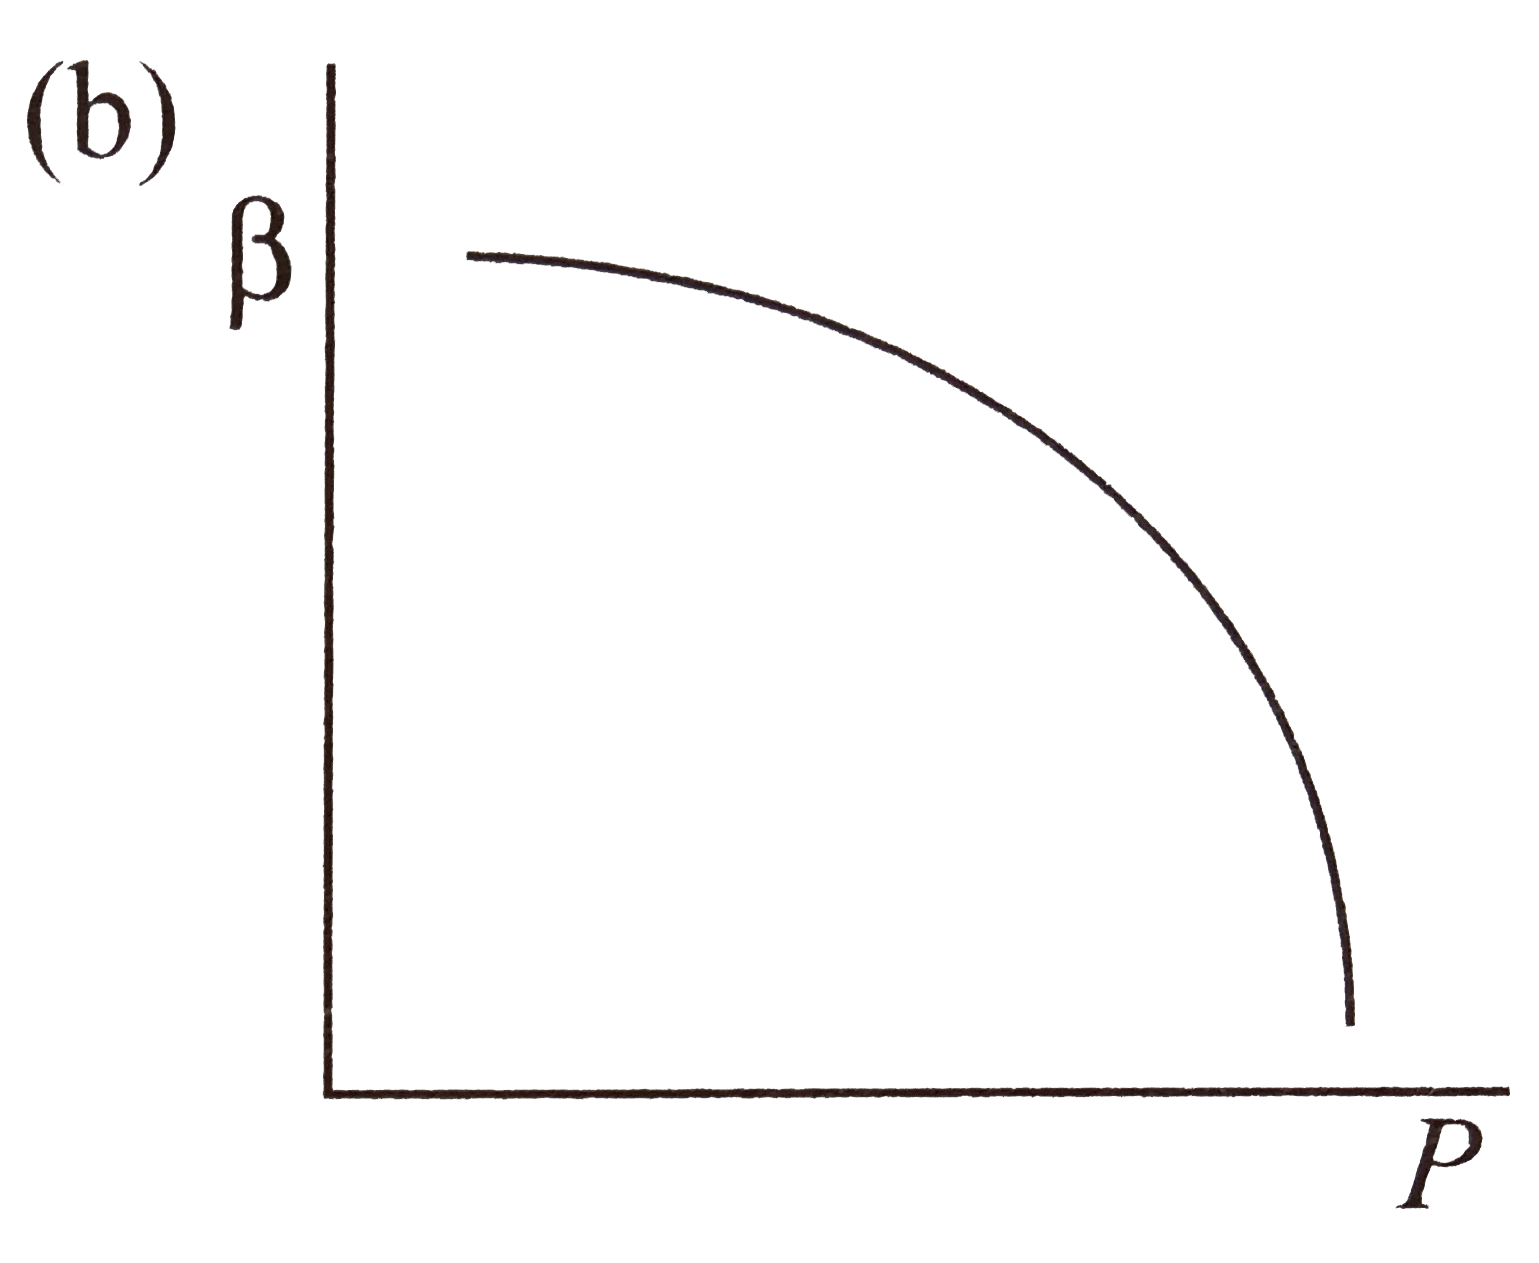 C
C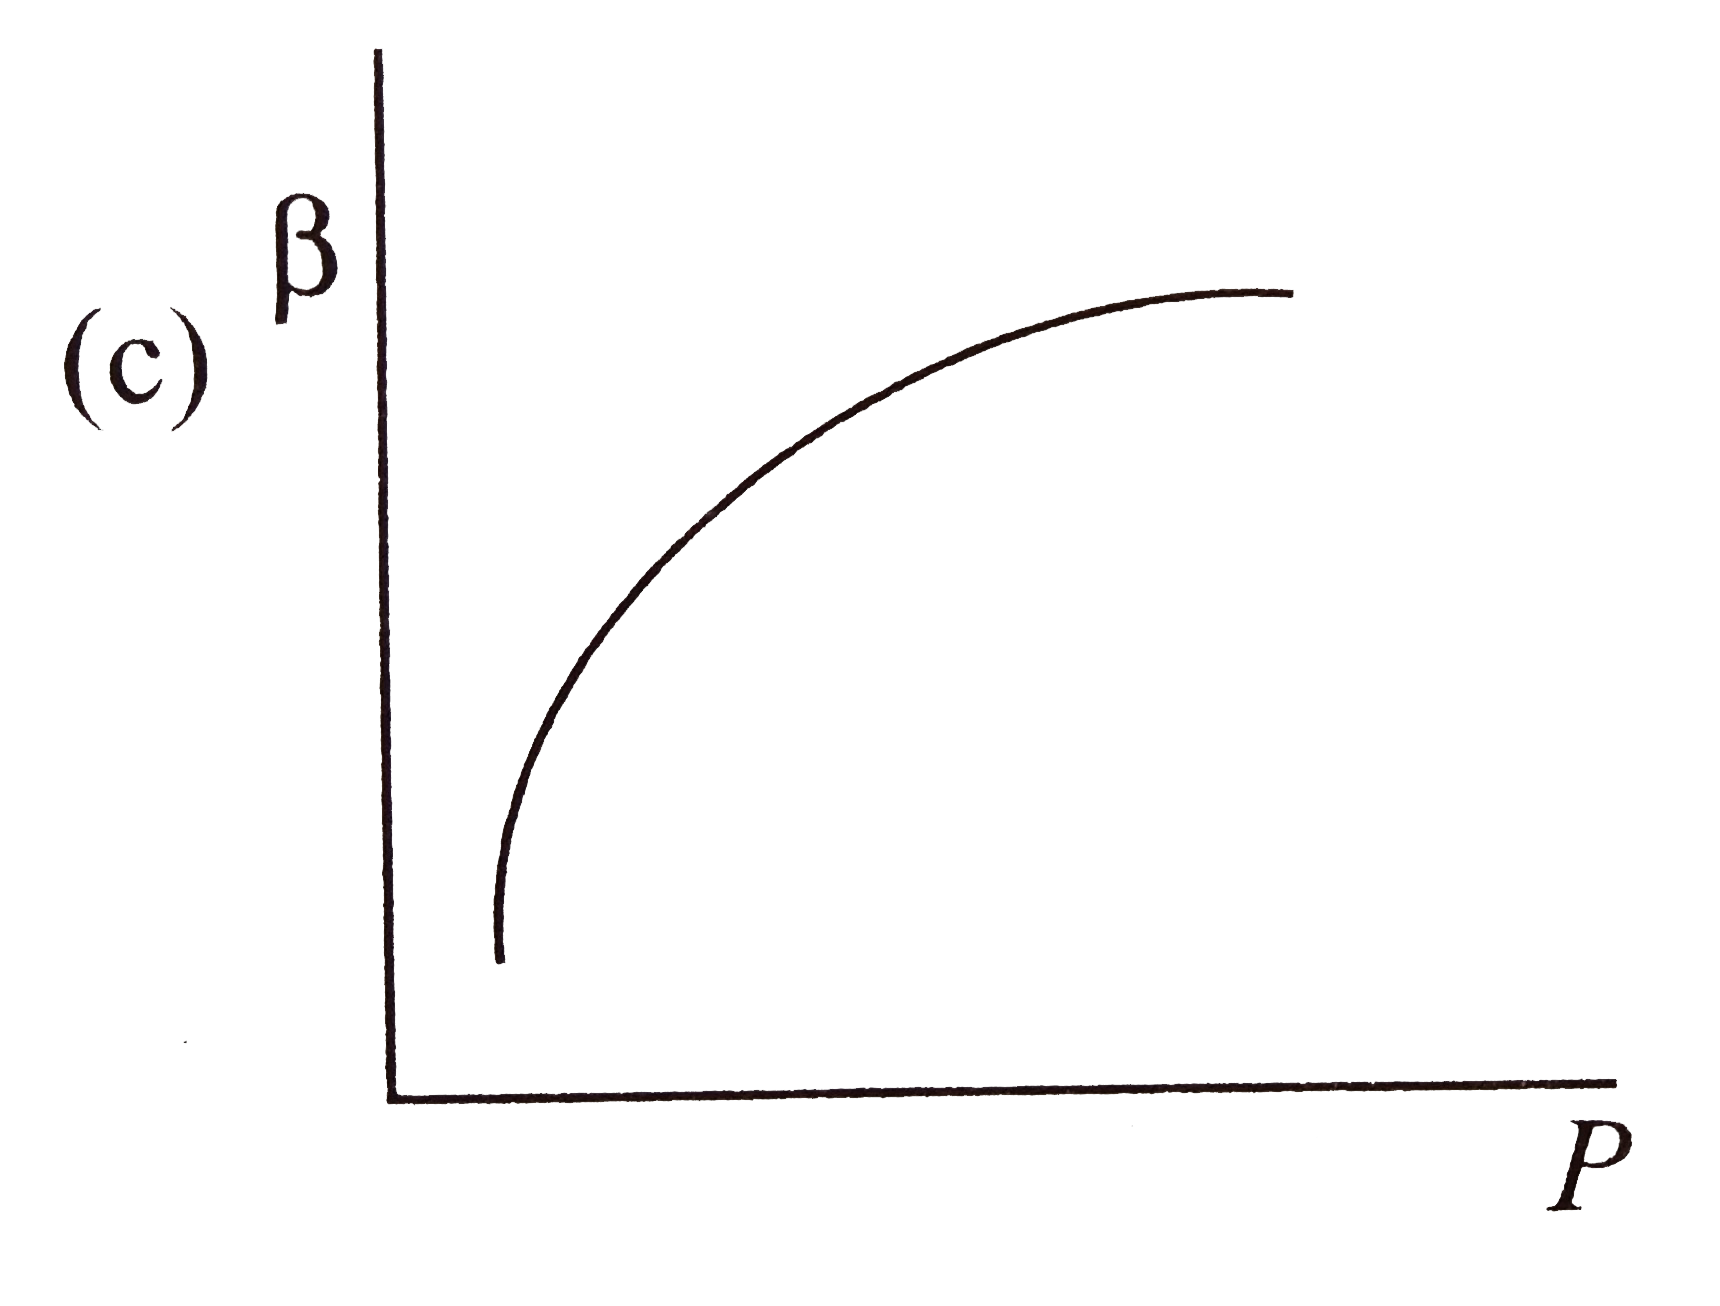 D
D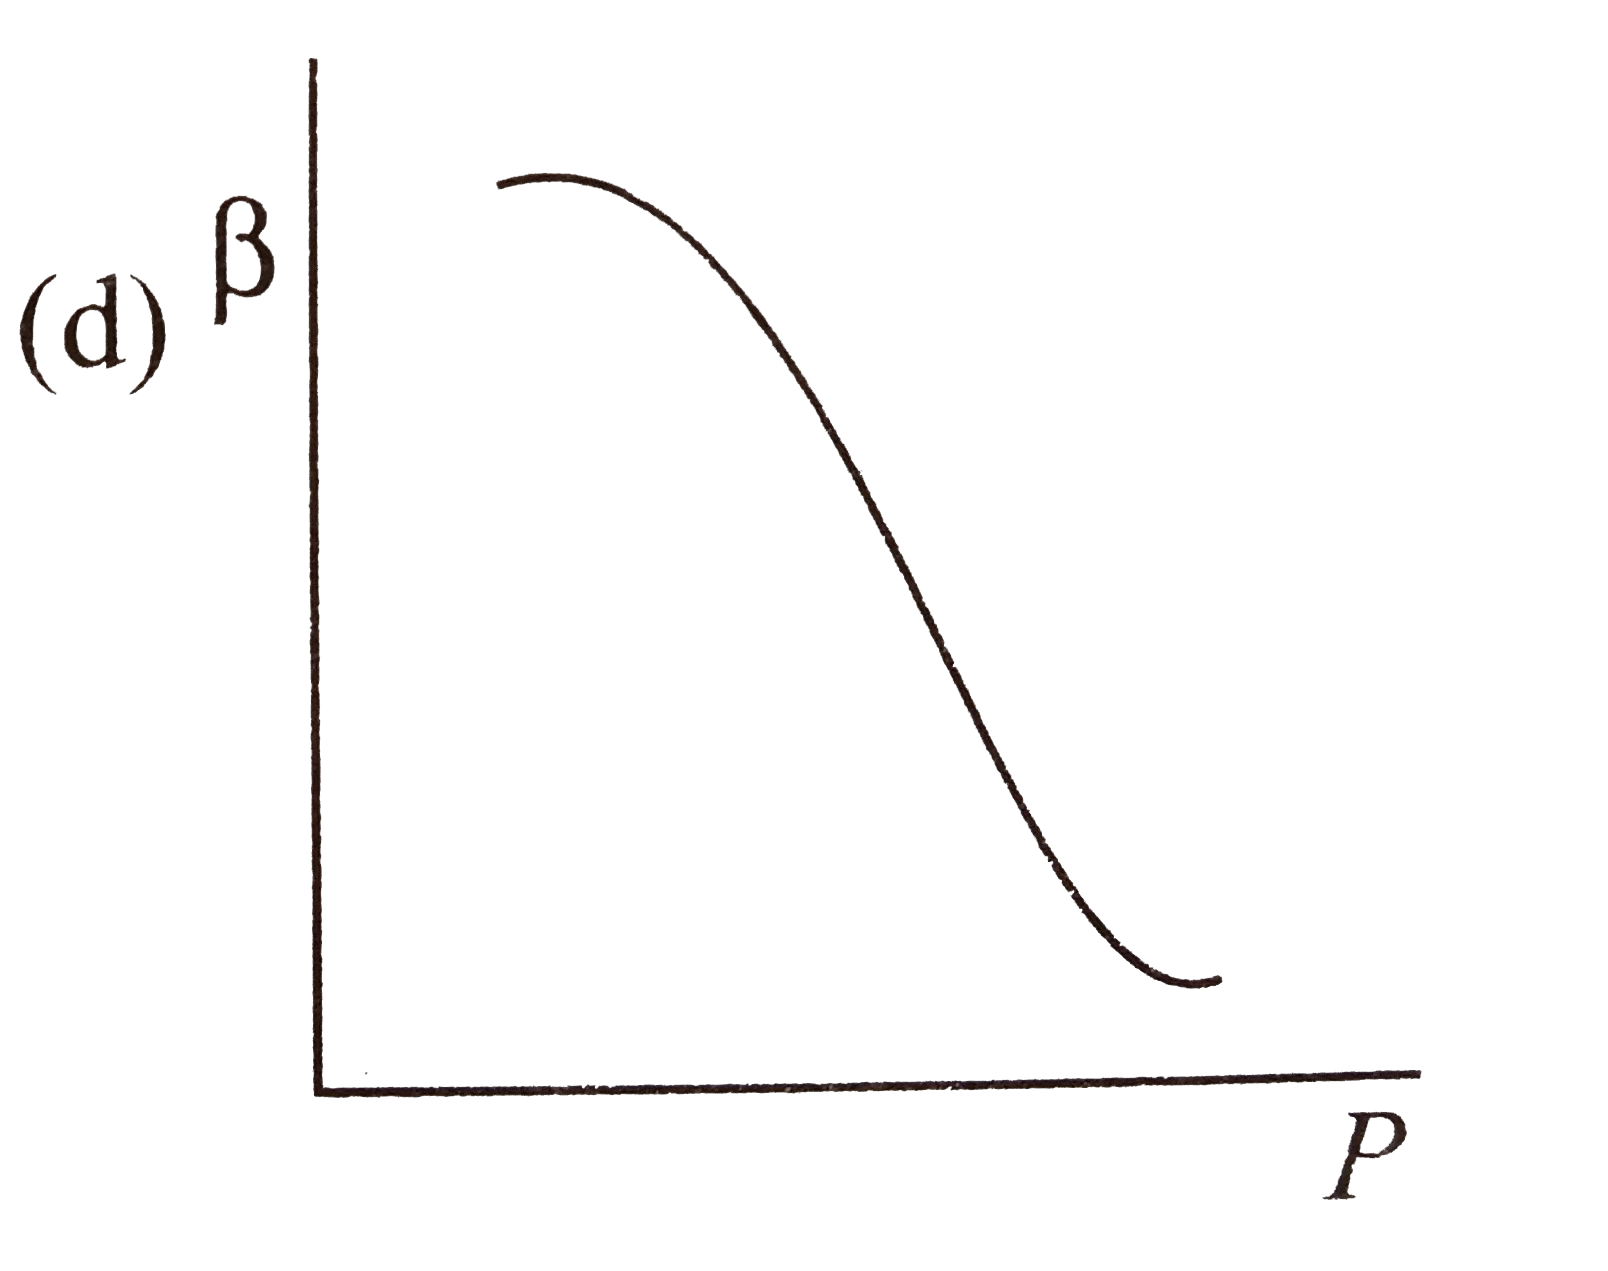
Which of the following graphs correctly represents the variation of β=−dV/dPV
with P for an ideal gas at constant temperature?A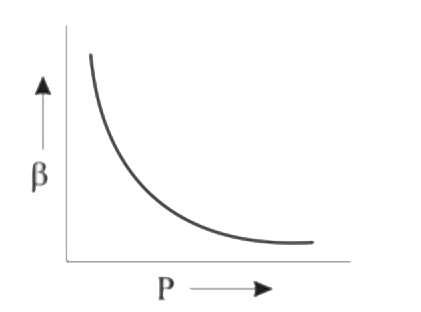 B
B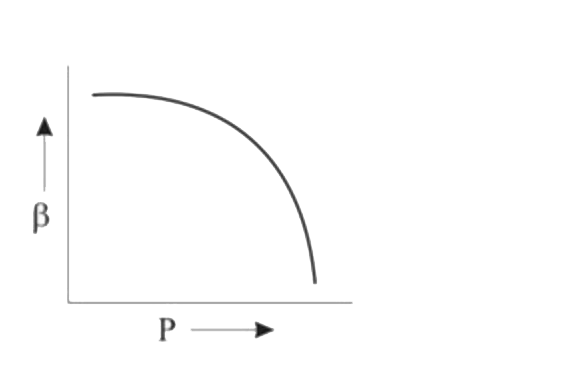 C
C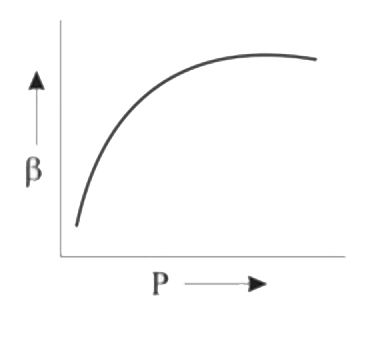 D
D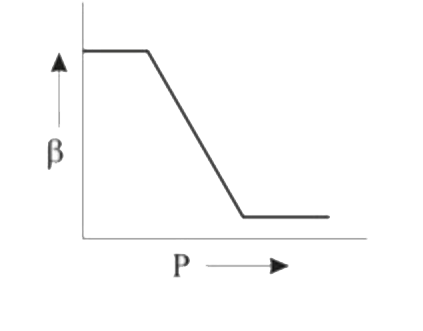
Work done on a ideal gas in a cylinder when it is compressed by an external pressure in a single step is shown below :
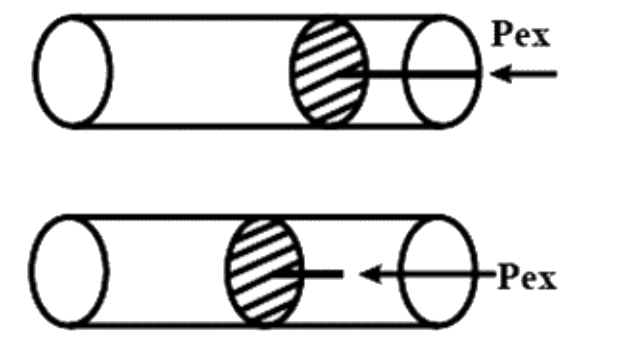
Which of the following graphs will show the work done on the gas?
View SolutionFor a ideal monoatomic gas match the following graphs for constant mass in different processes (ρ = Density of gas)
_E01_156_Q01.png)
View SolutionMatch the graphs between the following variables with their names.
View SolutionWhich of the following graphs correctly represents the variation of β=−(dVdP)1V with P for an ideal gas at constant temperature ?
View SolutionWhich of the following graphs correctly represents the variation of β=−dV/dPV
with P for an ideal gas at constant temperature?
View Solution

