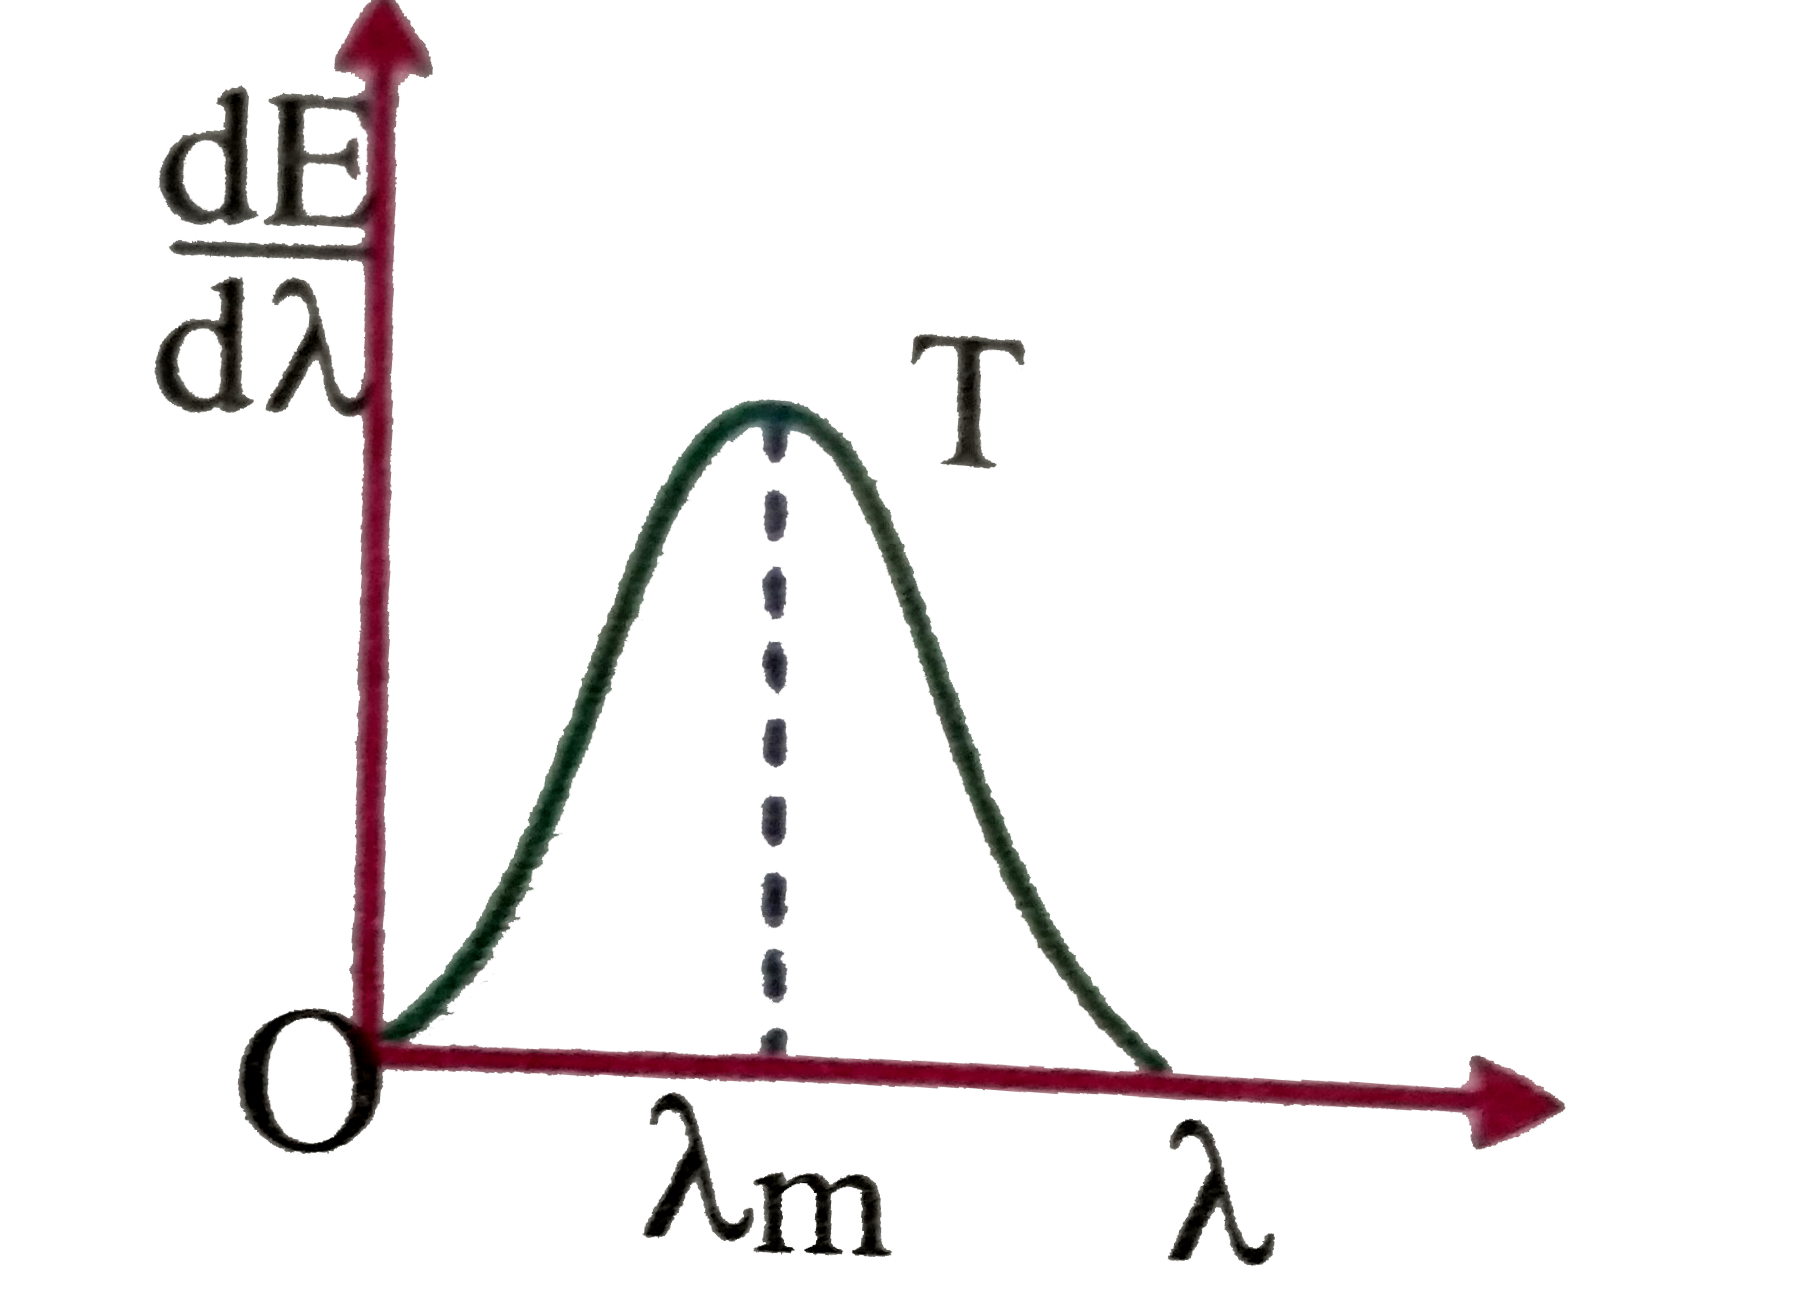
The shows a radiant energy spectrum graph for a black body at at temperature T

If the temperature of the body is raised to a higher temperature T then choose the correct statement (s).
The intensity of radiation for every wavelength increase
The maximum intensity occurs at a shorter wavelength
The area under the graph increases
The area under the graph is proportional to the fourth power of temperature .
The correct Answer is:A, B, C
Step by step video, text & image solution for The shows a radiant energy spectrum graph for a black body at at temperature T If the temperature of the body is raised to a higher temperature T then choose the correct statement (s). by Physics experts to help you in doubts & scoring excellent marks in Class 11 exams.
Updated on:21/07/2023Topper's Solved these Questions
- TRANSMISSION OF HEATBook:NARAYNAChapter:TRANSMISSION OF HEATExercise:LEVEL-I(H.W)
Explore 19 Videos
- TRANSMISSION OF HEATBook:NARAYNAChapter:TRANSMISSION OF HEATExercise:LEVEL-II(C.W)
Explore 27 Videos
- TRANSMISSION OF HEATBook:NARAYNAChapter:TRANSMISSION OF HEATExercise:SINGLE ANSWER QUESTIONS Passage -1
Explore 1 Video
- THERMODYNAMICSBook:NARAYNAChapter:THERMODYNAMICSExercise:Exercise
Explore 187 Videos
- UNITS AND MEASUREMENTSBook:NARAYNAChapter:UNITS AND MEASUREMENTSExercise:STATEMENT TYPE QUESTION
Explore 23 Videos
Similar Questions
Knowledge Check
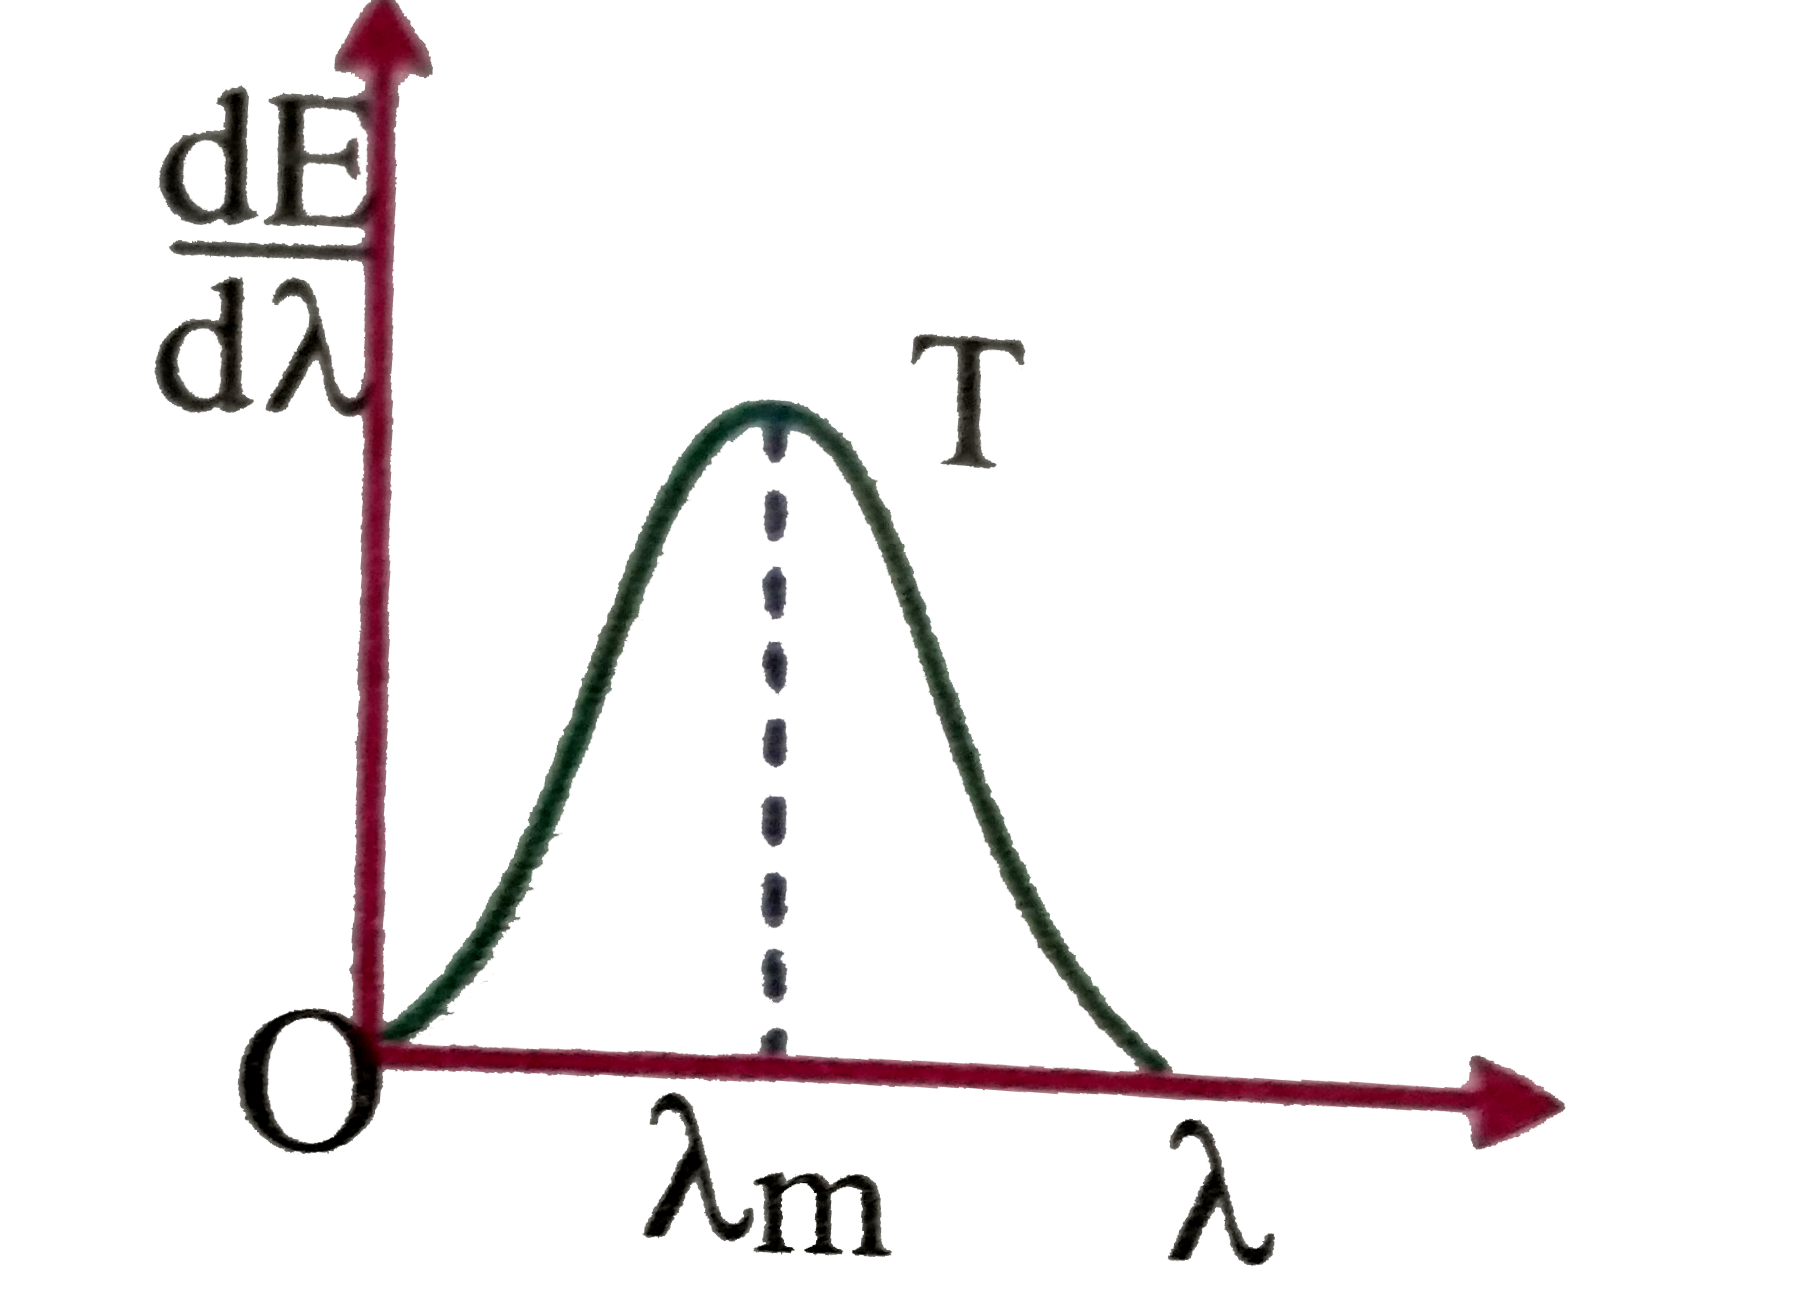
The shows a radiant energy spectrum graph for a black body at at temperature T

Choose the correct statements (s) .AThe radiant energy is not equally distributed among all the possible wavelengthsBFor a particular wavelength the spectral intensity is maximumCThe area under the curve is equal to the total rate at which heat is radiated by the body at that temperature .DNone of theseIf the temperature of a hot body is raised would increased by
A0.16B0.125C0.04D0.09If a black body is heated at a high temperature, it seems to be
AblueBgreenCwhiteDred
If a black body is heated at a high temperature, it seems to be
View SolutionIf a black body is heated at a high temperature, it seems to be
View SolutionA black body at high temperature emits thermal radiations of
View SolutionA black body radiates at the of W watts at a temperture T. If the temperature of the body is reduced to T/3, it will radiate at the rate of (in Watts)
View SolutionAt temperature T , the power radiated by a body is Q watts . At the temperature 3 T the power radiated by it will be
View Solution


_E01_249_Q01.png)