The graph show the behaviour of a length of wire in the region for which the substances obeys Hooke's law. P and Q represent
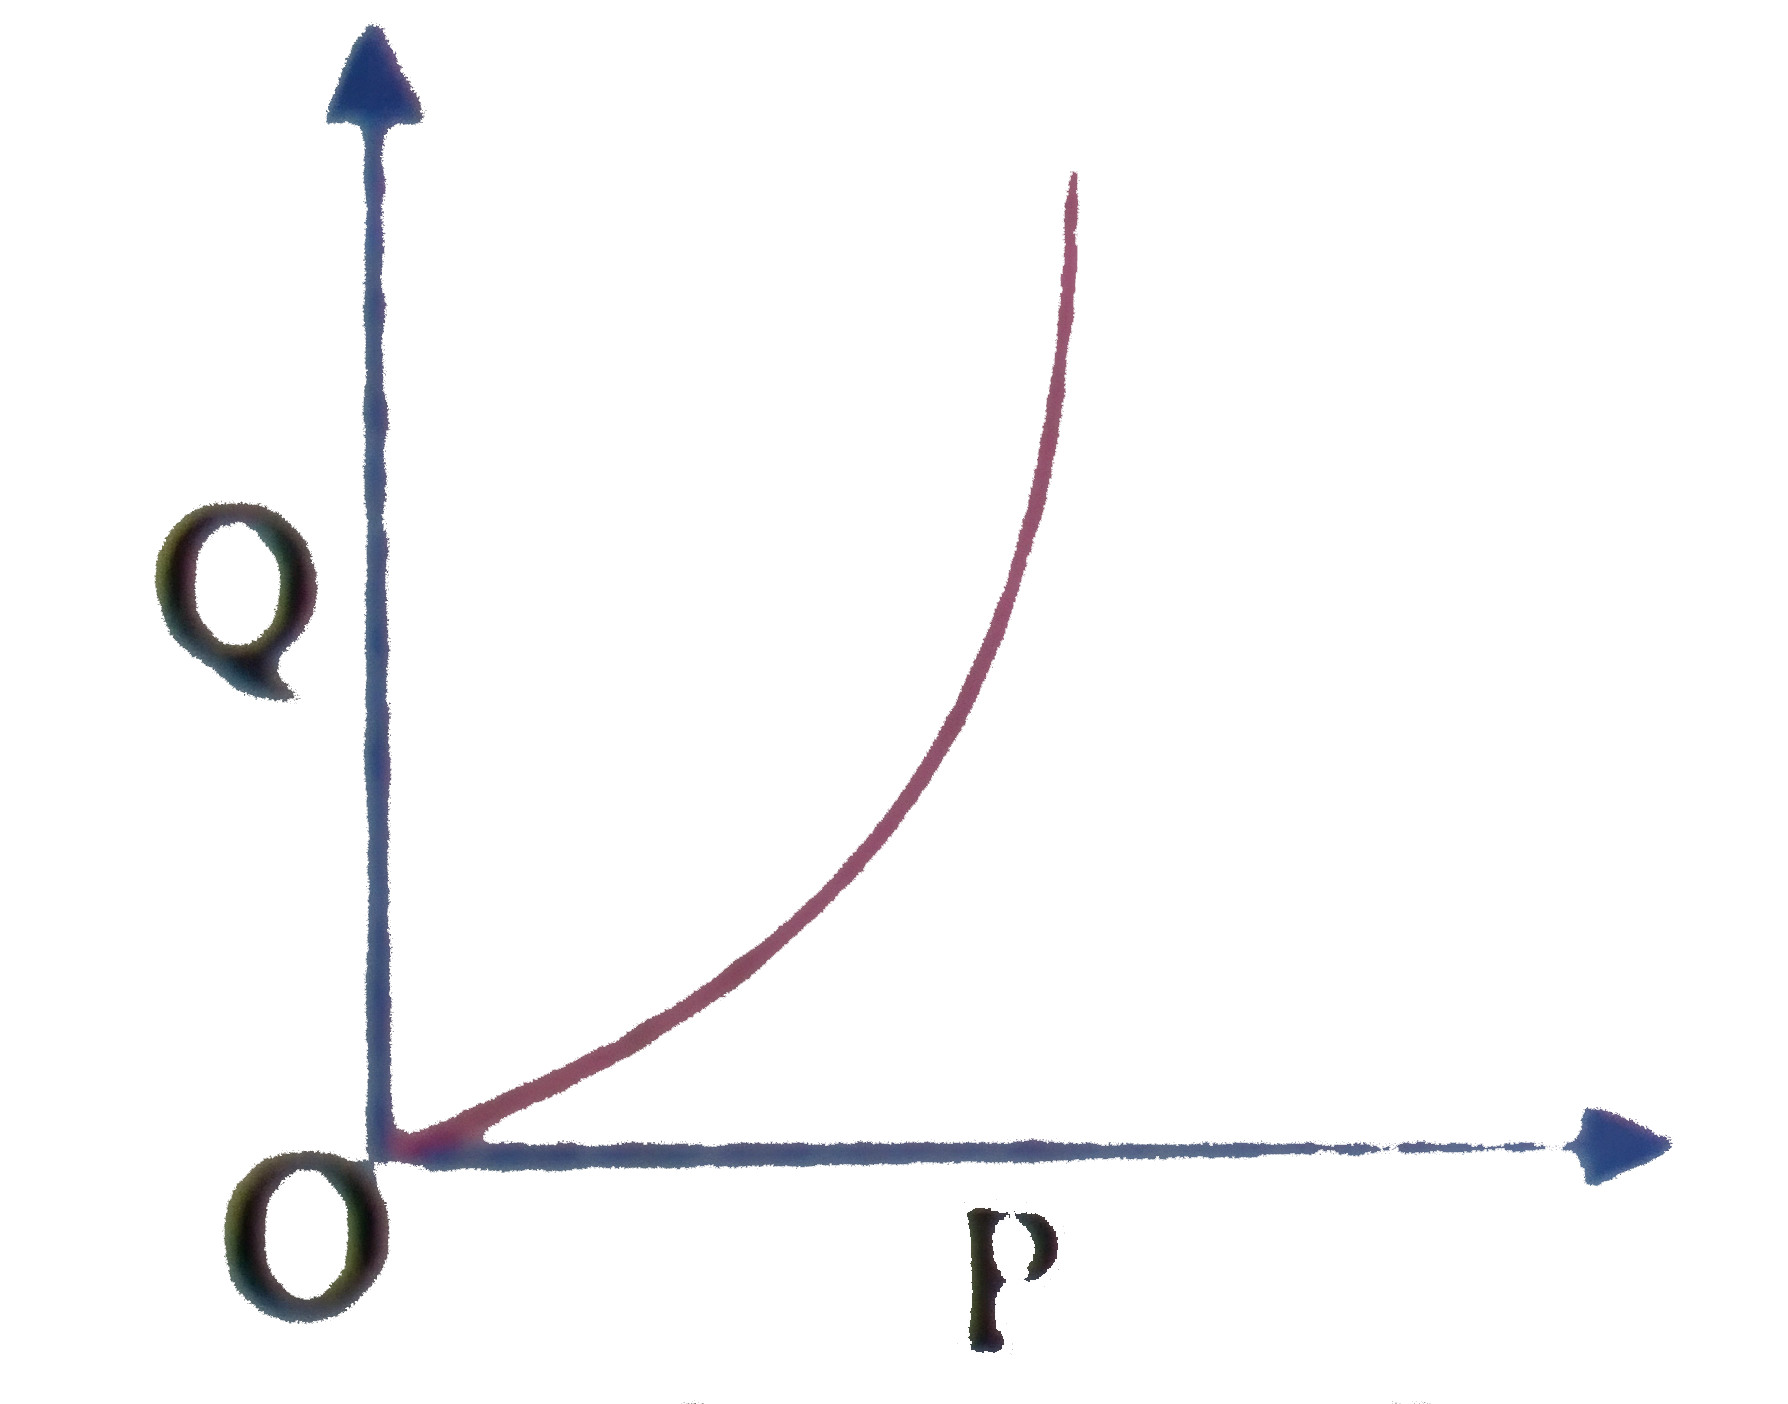
P = applied force, Q = extension
extension, applied force
extension, stored elastic energy
stored elastic energy, extension
The correct Answer is:C
Step by step video, text & image solution for The graph show the behaviour of a length of wire in the region for which the substances obeys Hooke's law. P and Q represent by Physics experts to help you in doubts & scoring excellent marks in Class 11 exams.
Topper's Solved these Questions
- BOOK - NARAYNACHAPTER - MECHANICAL PROPERTIES OF SOLIDSEXERCISE - LEVEL-I (C.W)37videos
MECHANICAL PROPERTIES OF SOLIDS
- BOOK - NARAYNACHAPTER - MECHANICAL PROPERTIES OF SOLIDSEXERCISE - LEVEL-II (C.W)32videos
MECHANICAL PROPERTIES OF SOLIDS
- BOOK - NARAYNACHAPTER - MECHANICAL PROPERTIES OF SOLIDSEXERCISE - LEVEL-II (H.W)24videos
MECHANICAL PROPERTIES OF SOLIDS
- BOOK - NARAYNACHAPTER - MECHANICAL PROPERTIES OF FLUIDSEXERCISE - EXERCISE - III30videos
MECHANICAL PROPERTIES OF FLUIDS
- BOOK - NARAYNACHAPTER - MOTION IN A PLANEEXERCISE - Level-II(H.W)31videos
MOTION IN A PLANE
Similar Questions
Draw the variation of potential energy and kinetic energy of a block attached to a spring, which obeys Hooke's law.
View SolutionThe graph in Fig. 11.8 shows the variation of elongation with tensile force for two wires P and Q.
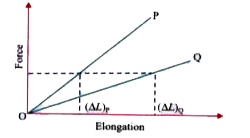
If P and Q are of the same material and have the same length, which one has a greater area of cross section ?View Solution
Knowledge Check
- Question 1 - Select One
The graph shows the behaviout of a length of wire in the region for which the substance obeys Hook's law. D and Q represent
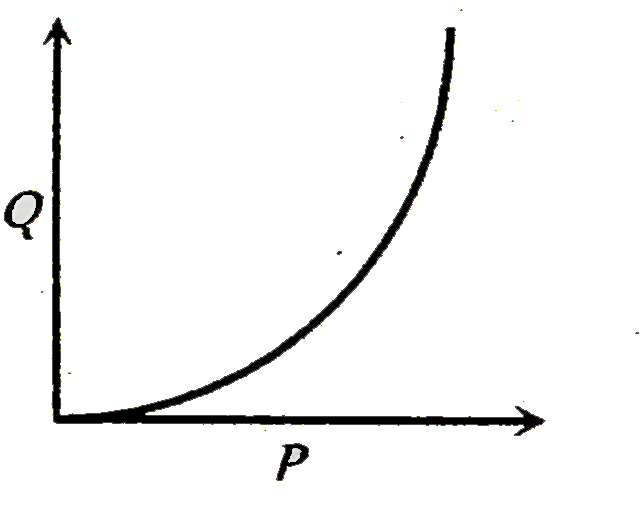 AP = applied force, Q = extensionBP = extension, Q = applied forceCP = extension, Q= stored elastic energyDP = stored elastic energy, Q = extension
 - Question 2 - Select One
The graph shows the behaviour of a steel wire in the region for whoch the wire obeys Hooke's law. The graph is a parabola. The variables X and Y -axes, respectively can be [ stress (σ),strain (ε) and elastic potential energy(U) ]
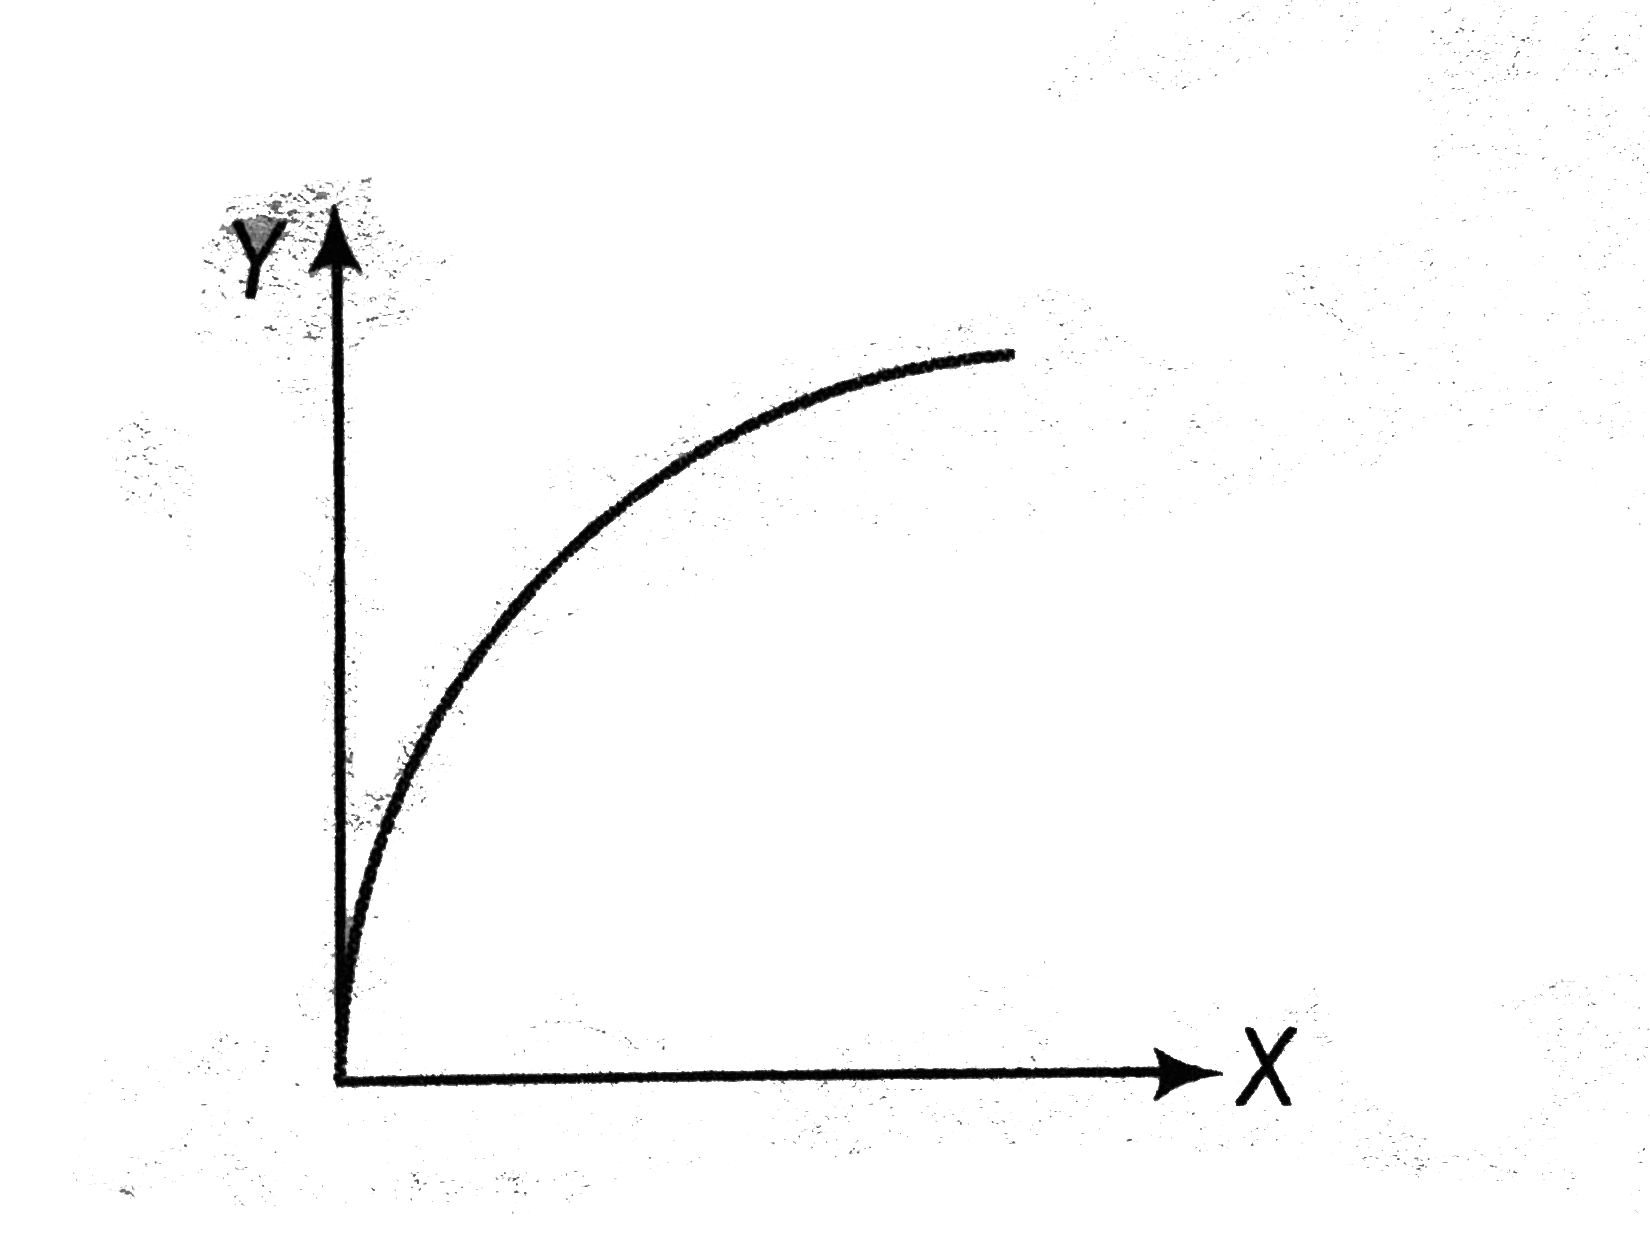 AA) U,σBB) U,εCC) σ,εDD) None of these
 - Question 3 - Select One
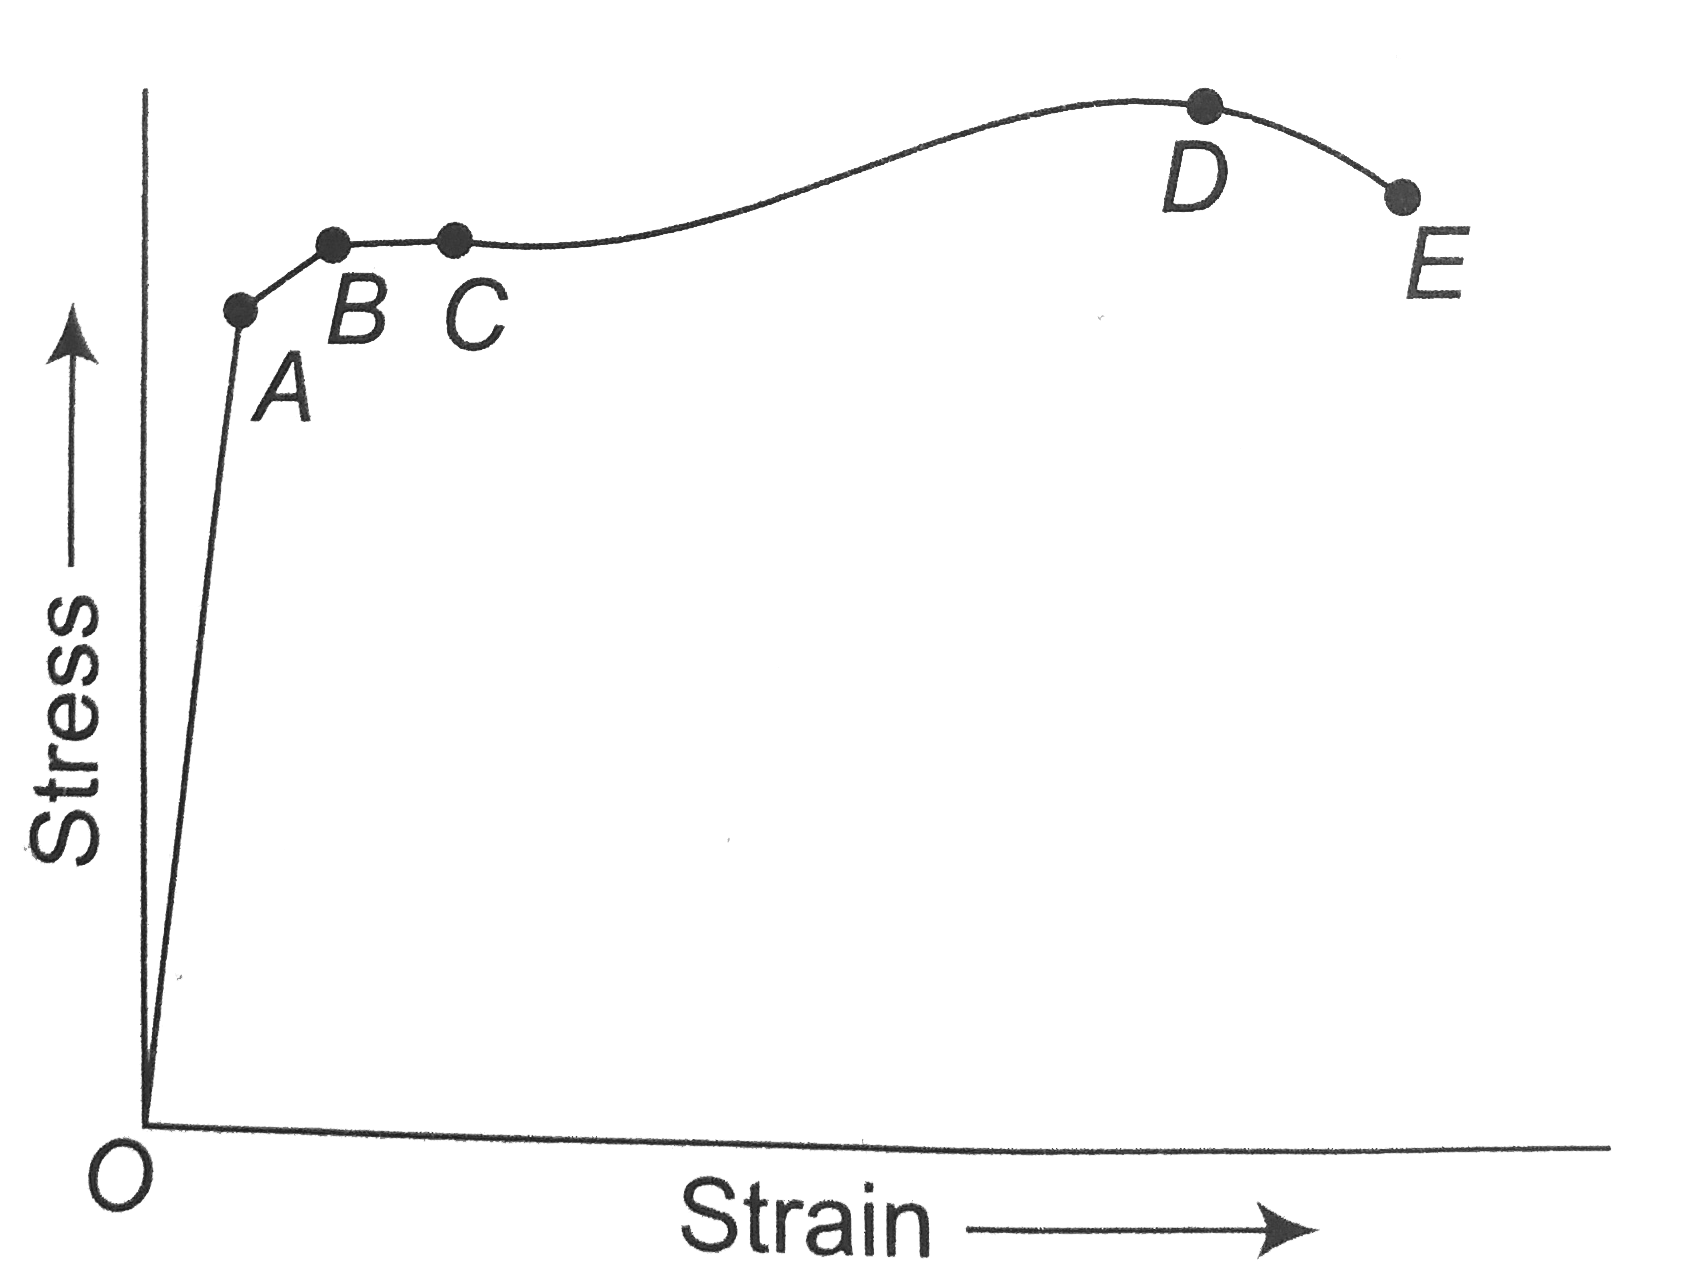
The stress strain graph for a metal wire is as shown in the figure. In the graph, the region in which Hooke's law is obeyed, the ultimate strength and fracture are represented byAOA,C,DBOB,D,ECOA,D,EDOB,C,D
One metre long metallic wire is broken into two unequal parts P and Q. The part P is uniformly extended into another wire R. Find the ratio of the resistances of P and R and also the ratio of the lengths P and Q.
View SolutionThe load versus elongation graph of four wires of same length and the same material as shown in the figure. The thinest wire is represented by the line
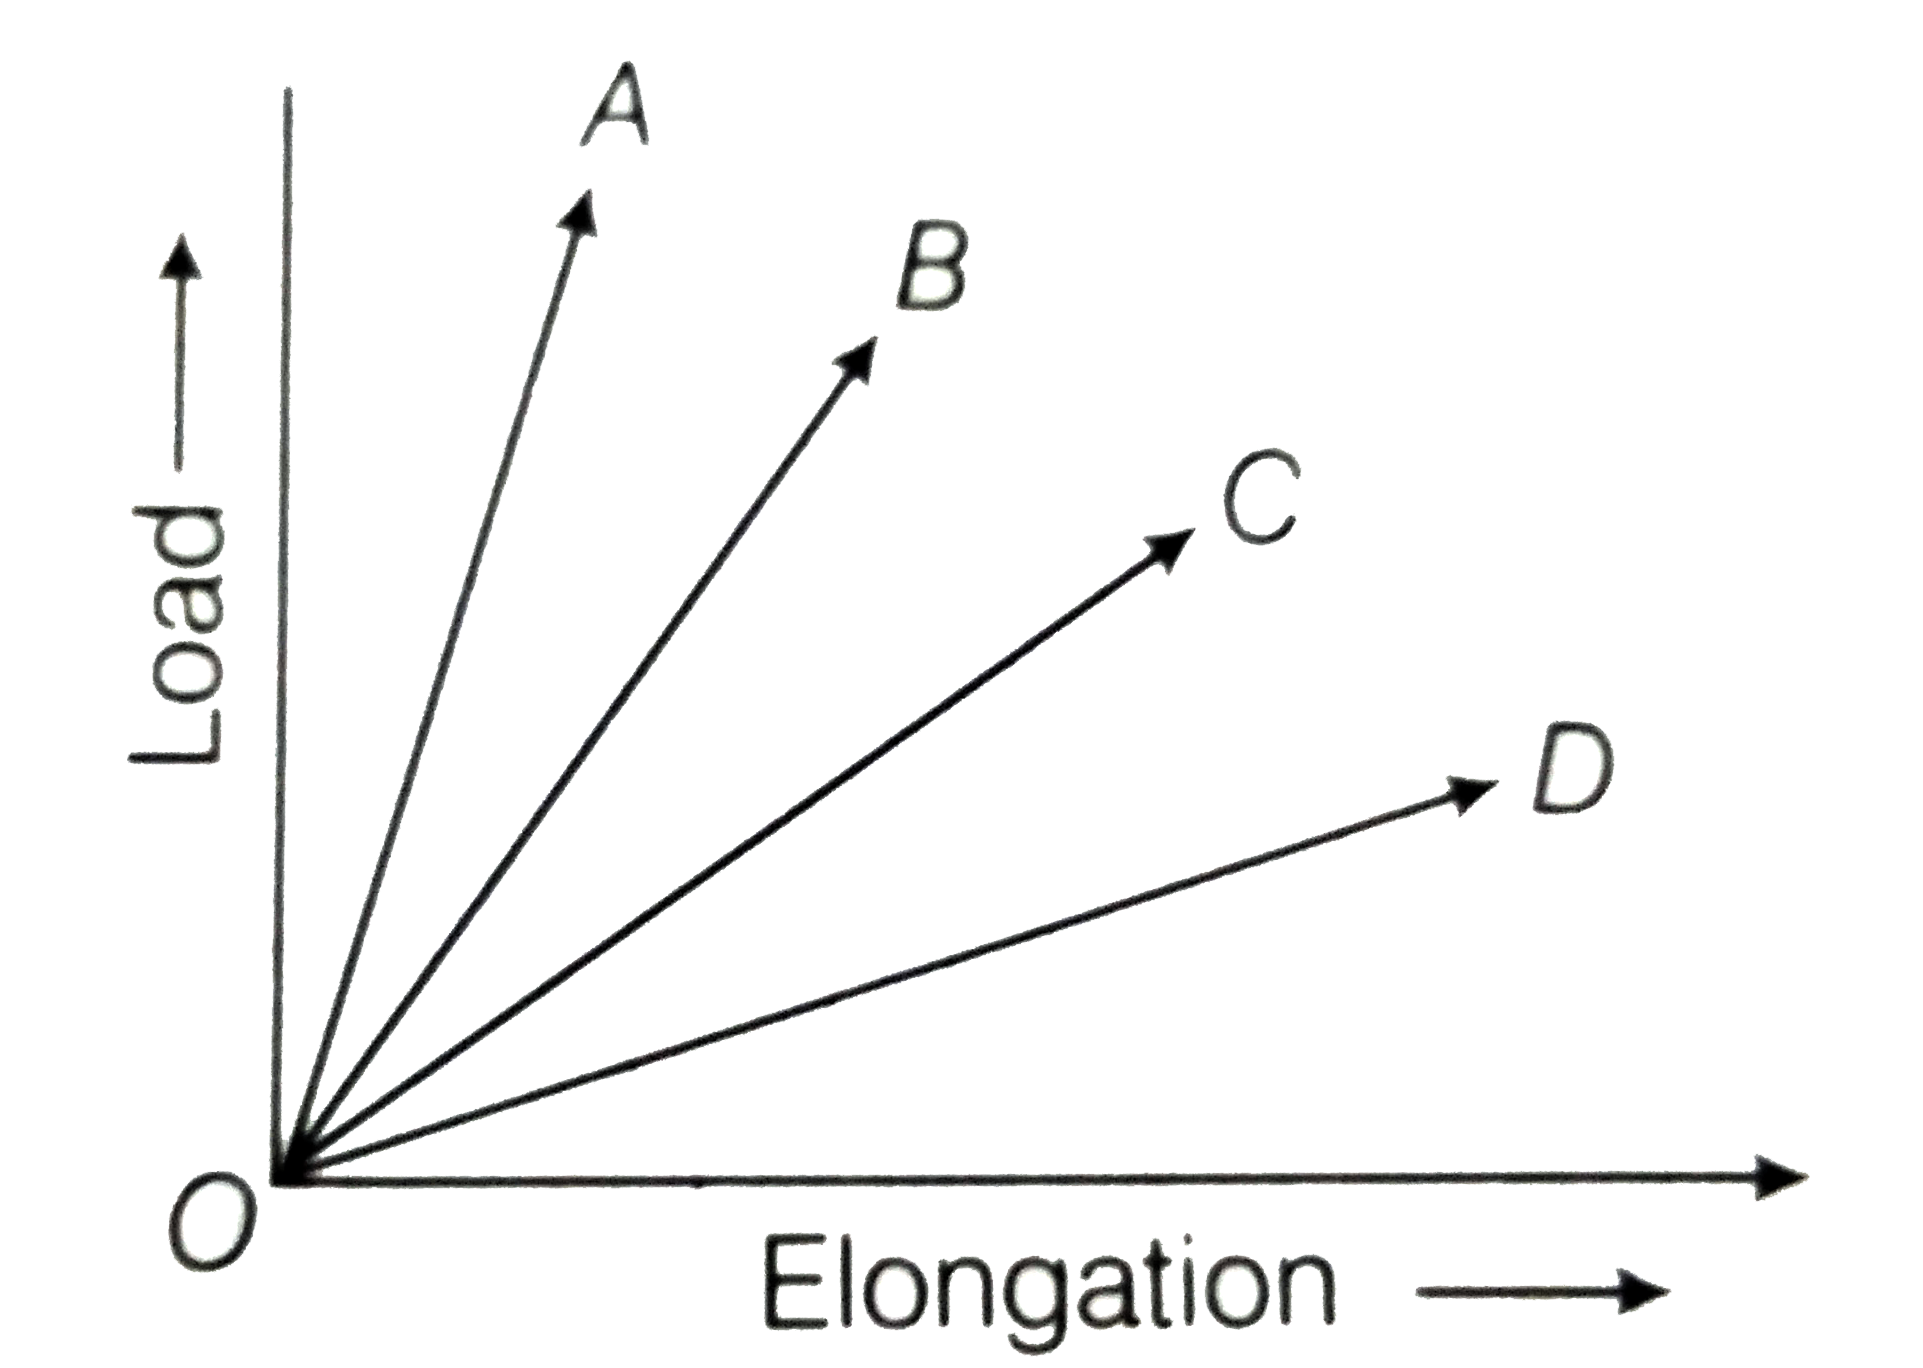 View Solution
1 meter long metallic wire is broken into two unequal parts PandQP part of the wire in uniformly extended into another wire R. Length of R is twice the length of P and the resistance of R is equal to that of Q. Find the ratio of the resistance P and R and also the ratio of the length PandQ
View SolutionThe given graph shows the variation of velocity with displacement. Which one of the graphs given below correctly represents the variation of acceleration with displacement ?
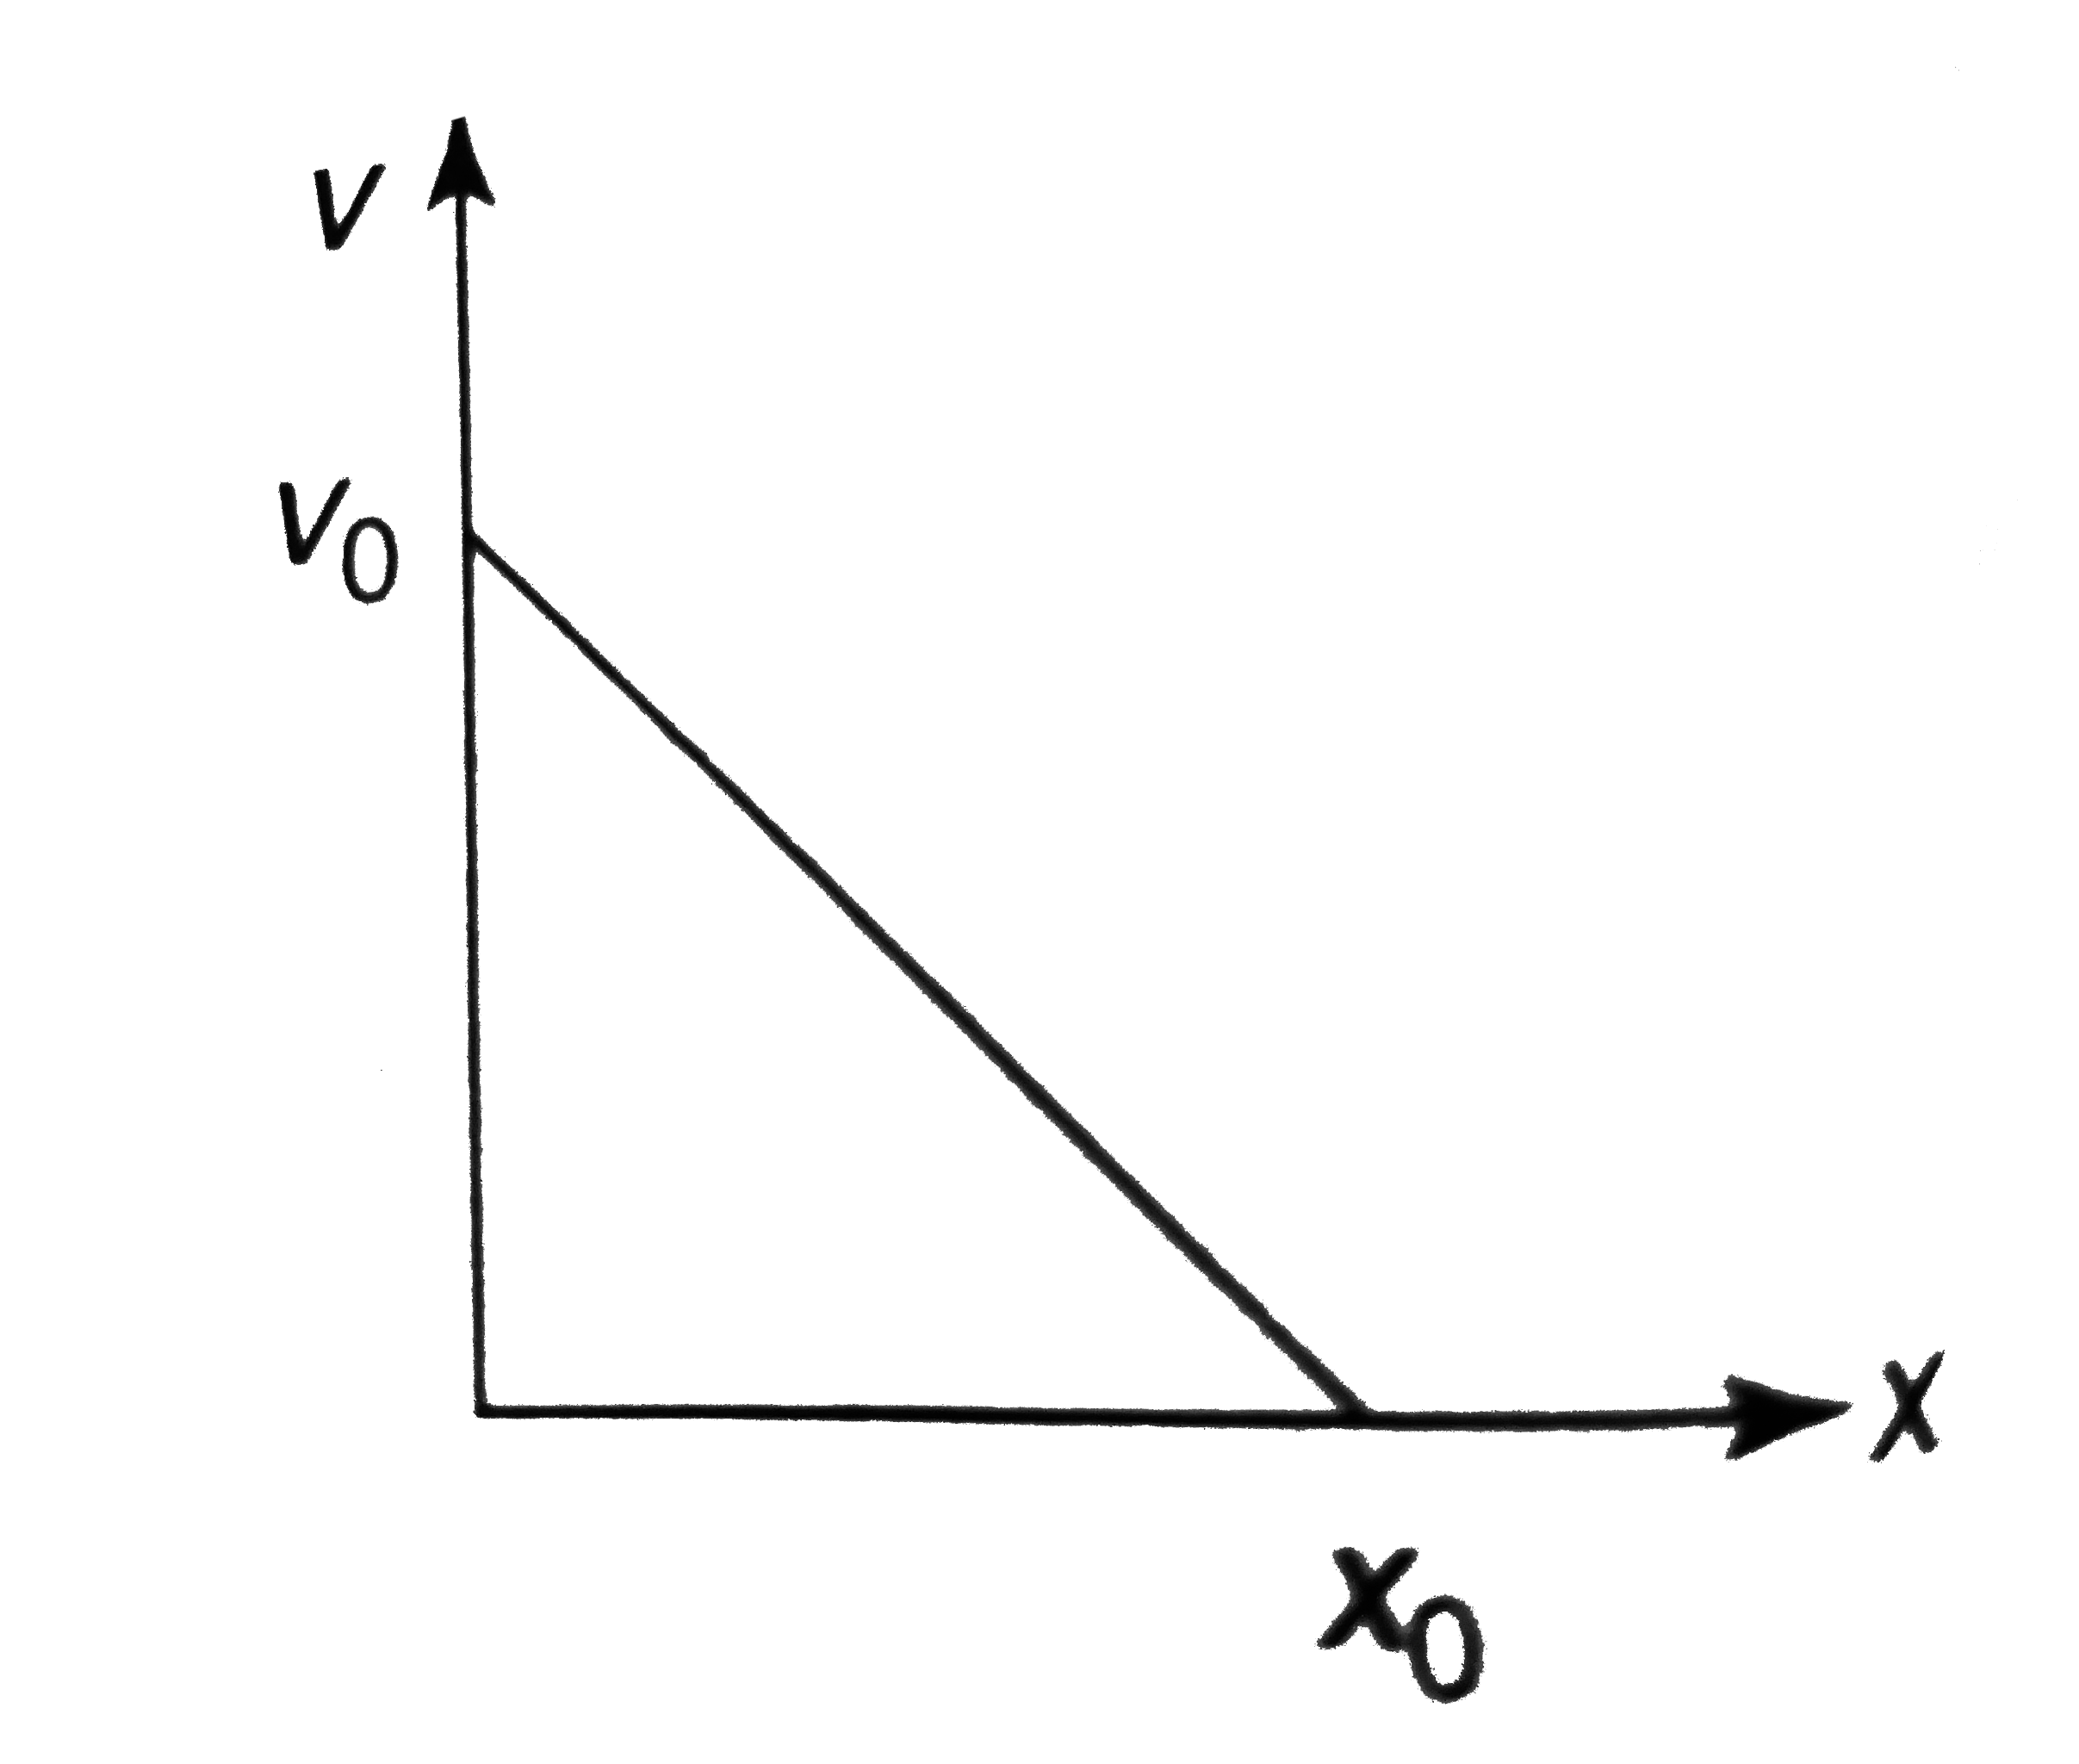 View Solution
Which of the following graphs represent the behaviour of an ideal gas ?
View Solution

