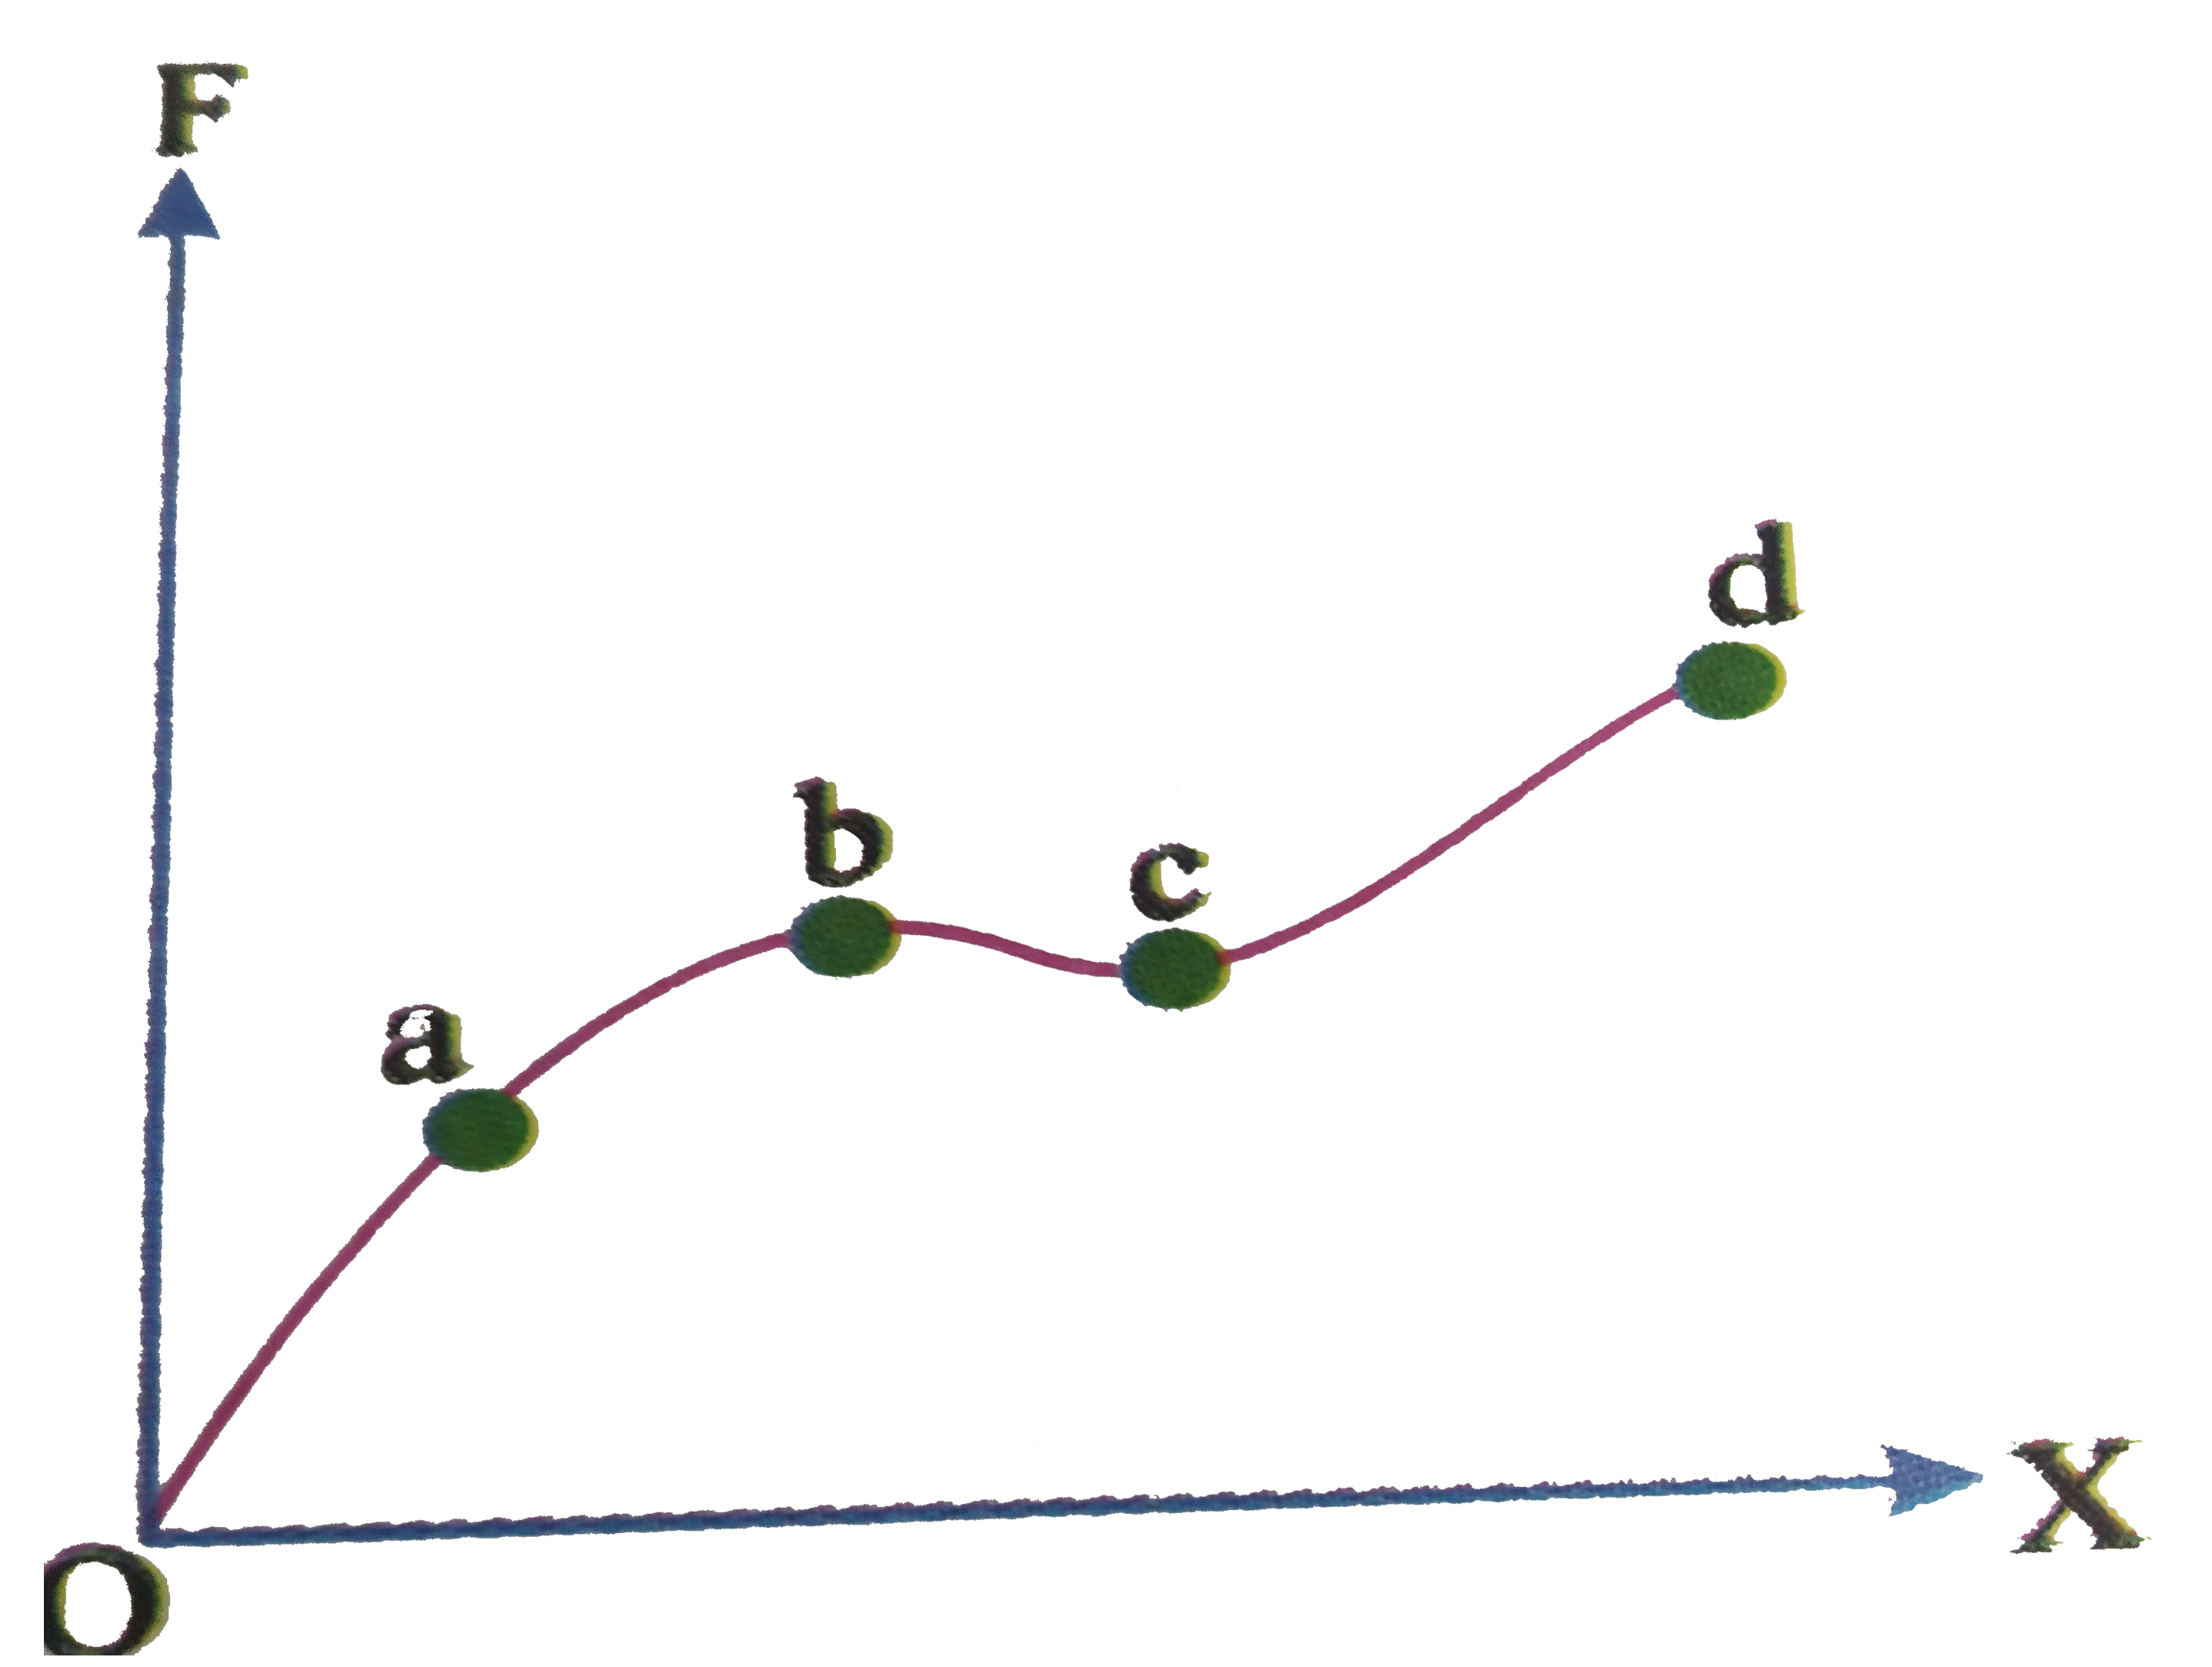
The diagram represents the applied force per unit area with the strain produced in a thin wire of uniform

cross-section in the curve shown. The region in which the wire behaves like a viscous liquid is
The correct Answer is:B
Step by step video, text & image solution for The diagram represents the applied force per unit area (F) with the strain (X) produced in a thin wire of uniform cross-section in the curve shown. The region in which the wire behaves like a viscous liquid is by Physics experts to help you in doubts & scoring excellent marks in Class 11 exams.
Updated on:21/07/2023Topper's Solved these Questions
- MECHANICAL PROPERTIES OF SOLIDSBOOK - NARAYNACHAPTER - MECHANICAL PROPERTIES OF SOLIDSEXERCISE - LEVEL-I (C.W)
37 Videos
- MECHANICAL PROPERTIES OF SOLIDSBOOK - NARAYNACHAPTER - MECHANICAL PROPERTIES OF SOLIDSEXERCISE - LEVEL-II (C.W)
32 Videos
- MECHANICAL PROPERTIES OF SOLIDSBOOK - NARAYNACHAPTER - MECHANICAL PROPERTIES OF SOLIDSEXERCISE - LEVEL-II (H.W)
24 Videos
- MECHANICAL PROPERTIES OF FLUIDSBOOK - NARAYNACHAPTER - MECHANICAL PROPERTIES OF FLUIDSEXERCISE - EXERCISE - III
30 Videos
- MOTION IN A PLANEBOOK - NARAYNACHAPTER - MOTION IN A PLANEEXERCISE - Level-II(H.W)
31 Videos
Similar Questions
Calculate the strain energy per unit volume in a brass wire of length 3 m and area of cross-section 0.6 kg wt is applied to its free end.
View SolutionA steel wire having cross-sectional area 2 mm^(2) is stretched by 20 N. Find the lateral strain produced in the wire Y_("steel") = 2 xx 10^(11) Nm^(-2), sigma = 0.391
View Solution
Knowledge Check
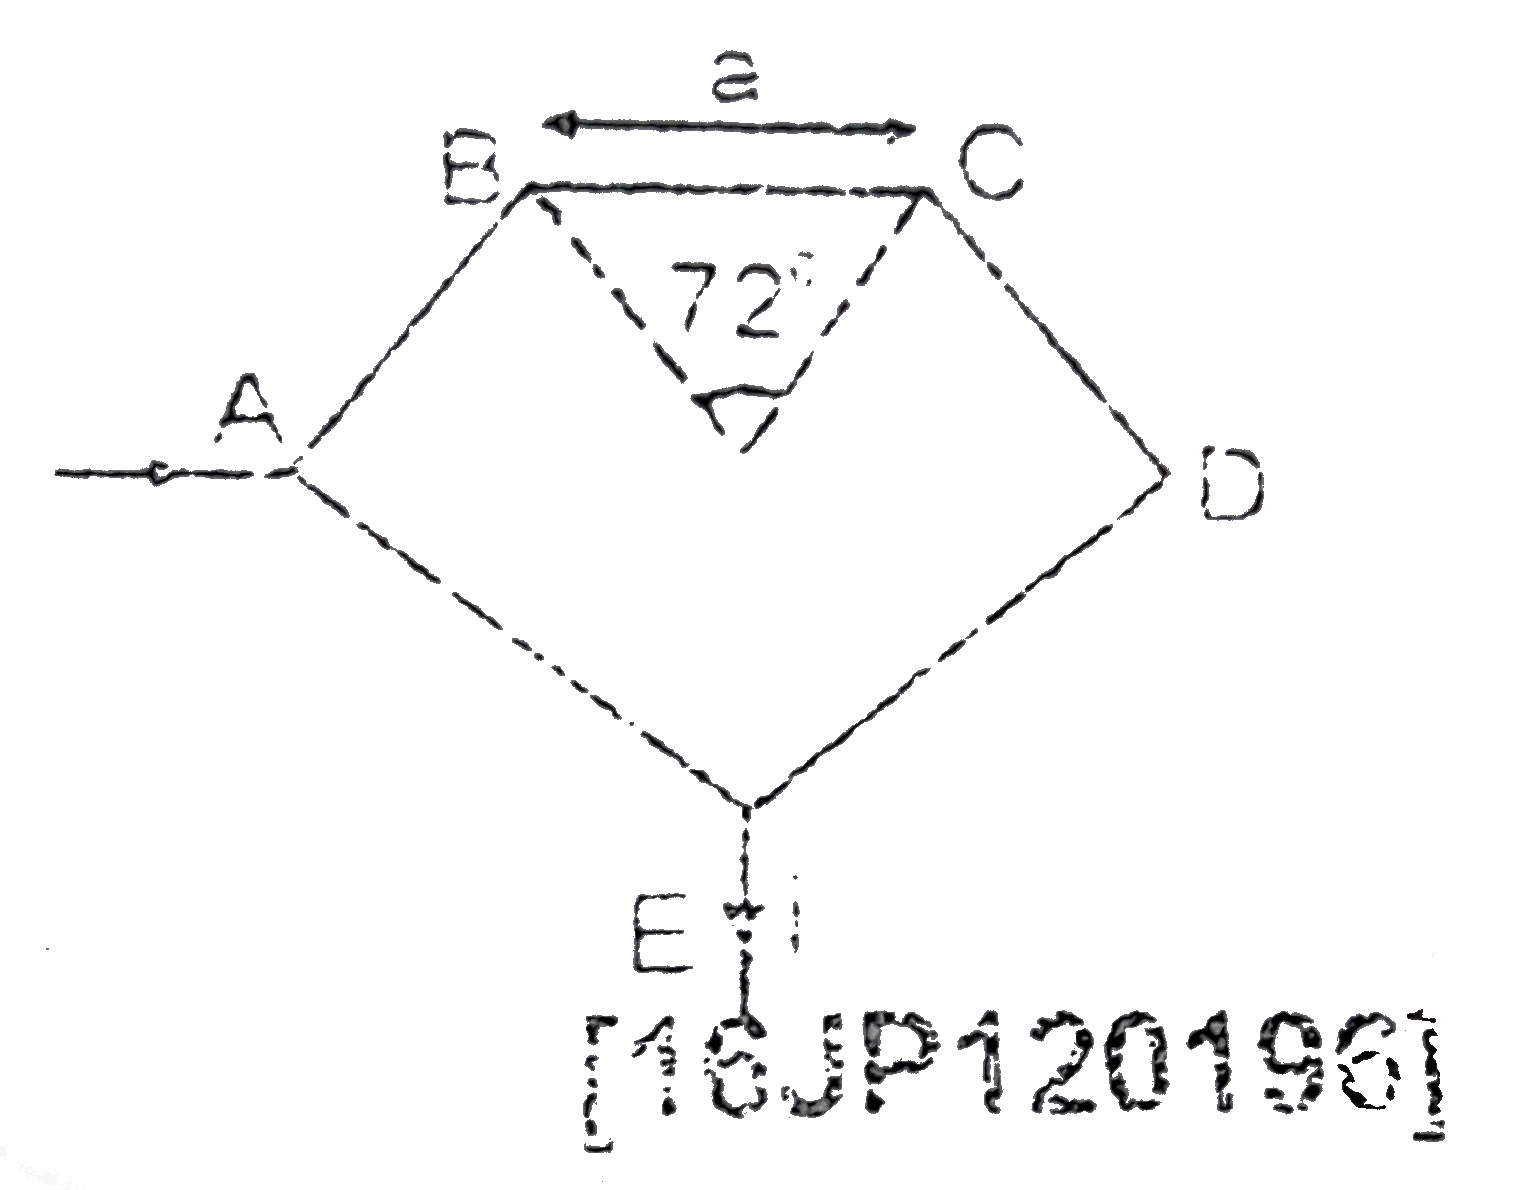
Magnetic field strength at the centre of regular pentagon made of a conducting wire of uniform cross section area as shown in figure is:
 A5μ0i4πa[2sin72∘2]B0CNot zero if current i leaves D point instead of EDZero even if the current i leaves point D instead of point E.
If x longitudinal strain is produced in a wire of Young's modulus y, then energy stored in the material of the wire per unit volume is
Ayx2B2yx2C12y2xD12yx2Braking froce per unit area of cross section of a wire is called
Ayield pointBtensile stressCductilityDbreaking stress
A copper wire of non-uniform area of cross-section is connected to a d.c. battery. The physical quantity which remains constant along the wire is
View SolutionIf x is the strain produced in a wire having the Young's modulus Y, then the strain energy per unit volume is
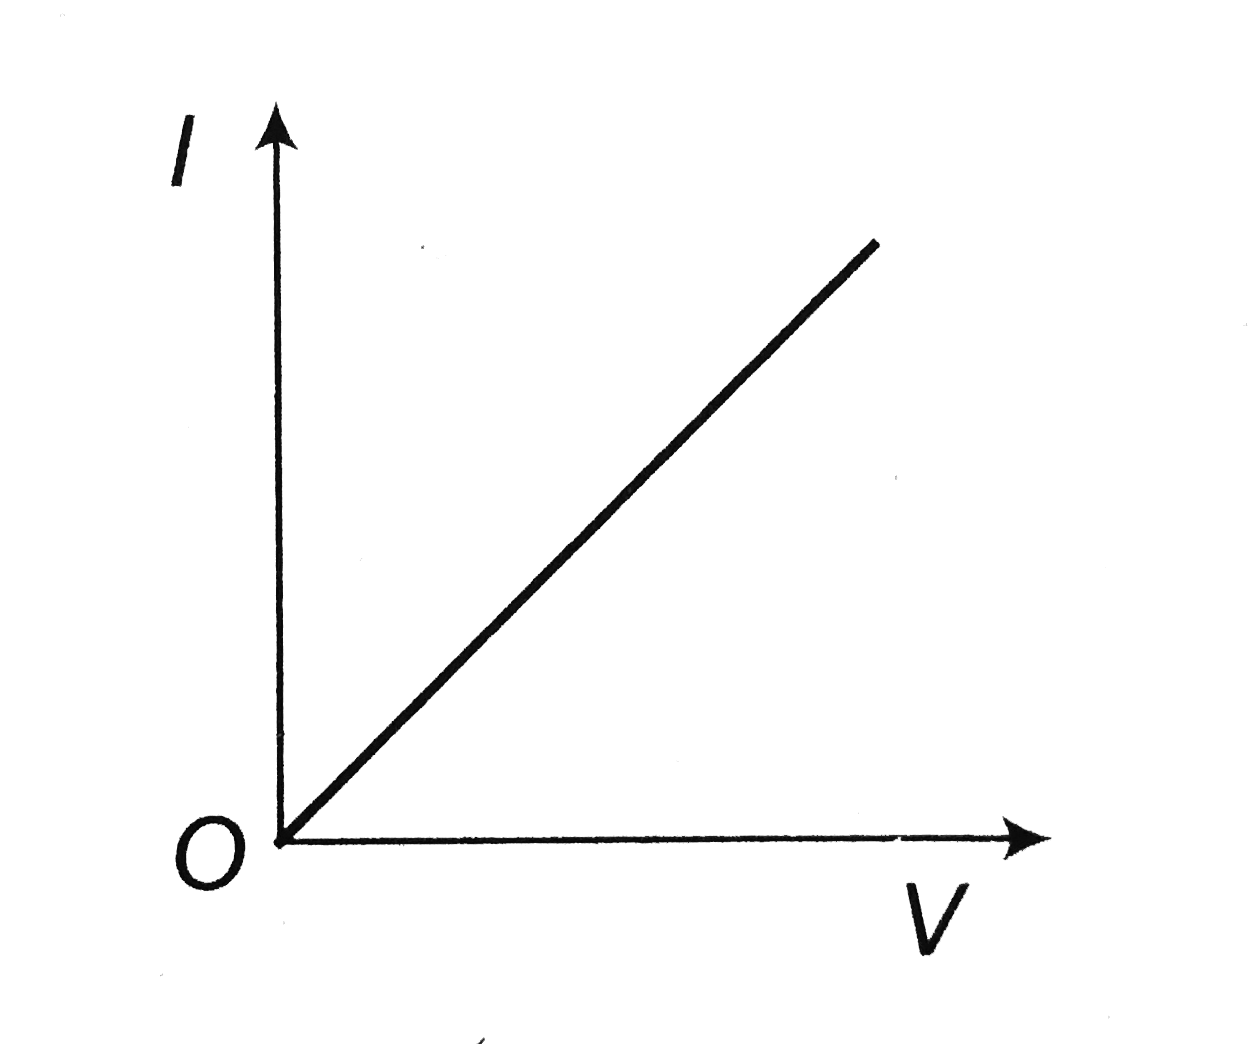
View SolutionI−V characteristics of a copper wire of length L and area fo cross-section A is shown in Fig. The slope of the curve becomes

View Solutionl-V characteristic of a copper wire of length Land area of cross-section A is shown in figure. The slope of the curve becomes

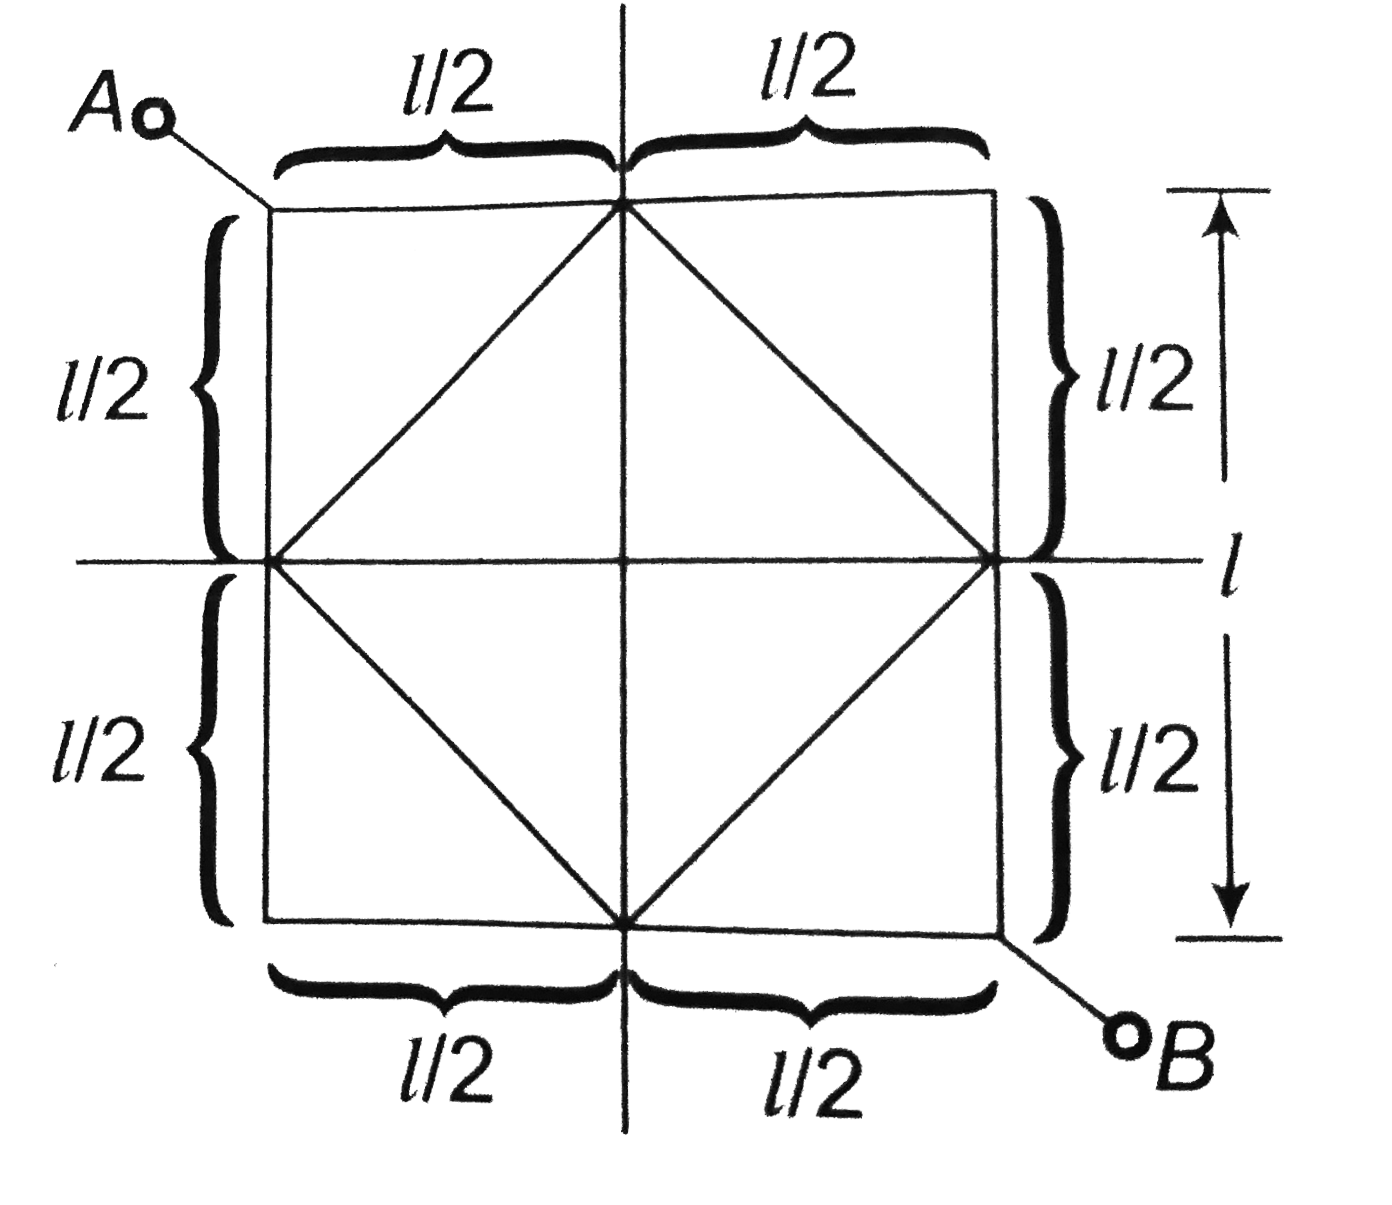
View SolutionIf the wire has resistively per unit area of cross-section.the resistance between A and B is

View Solution
