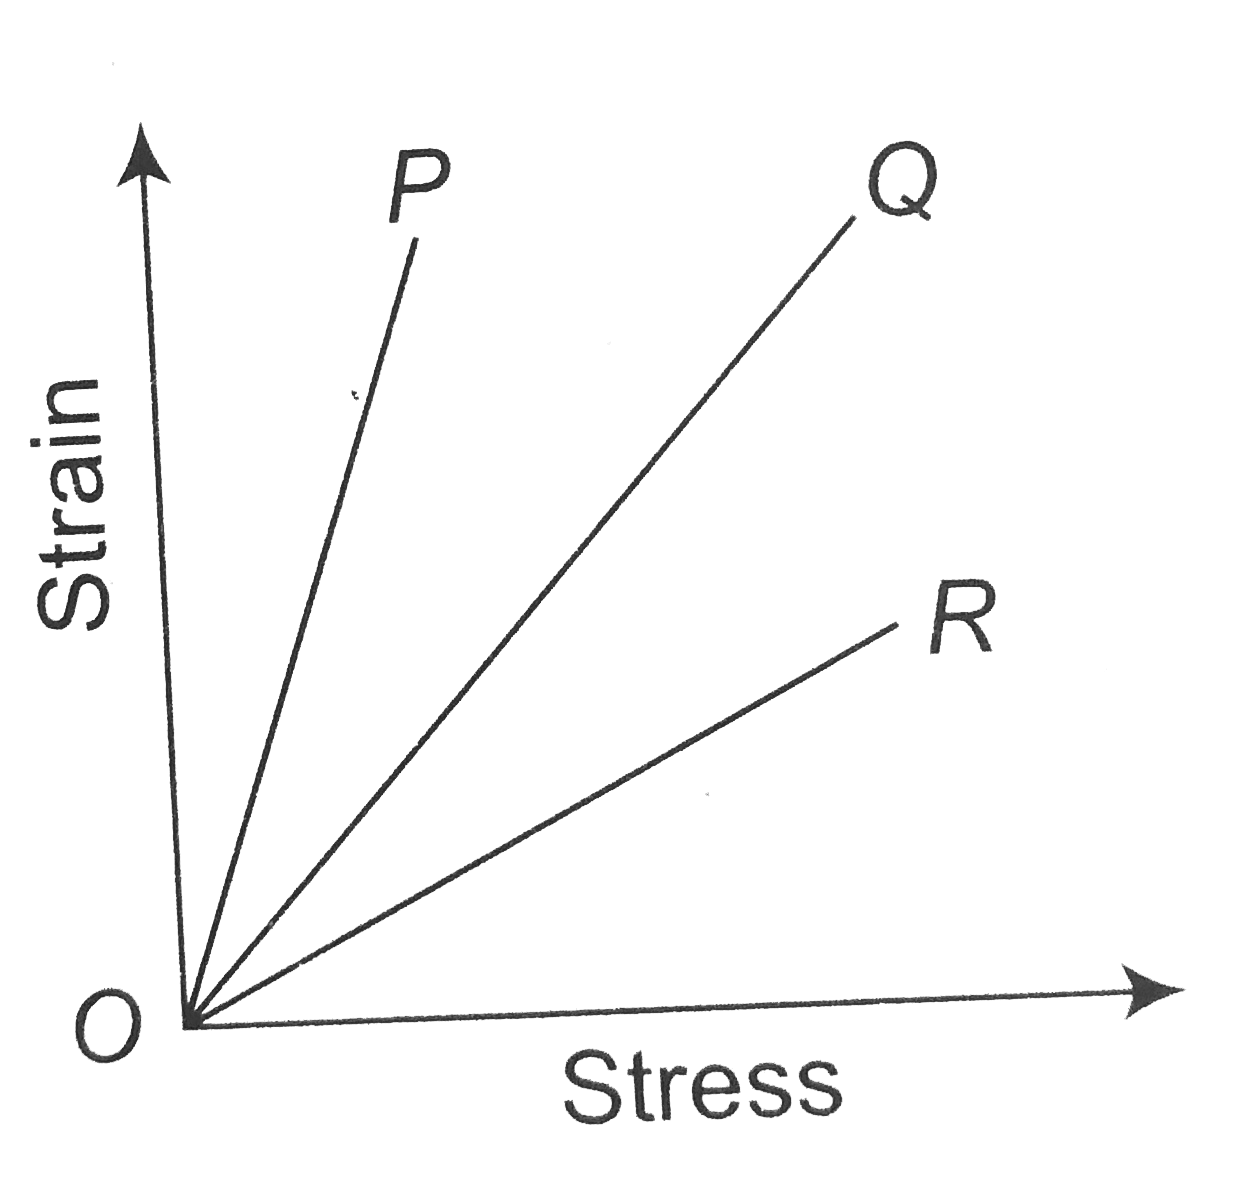
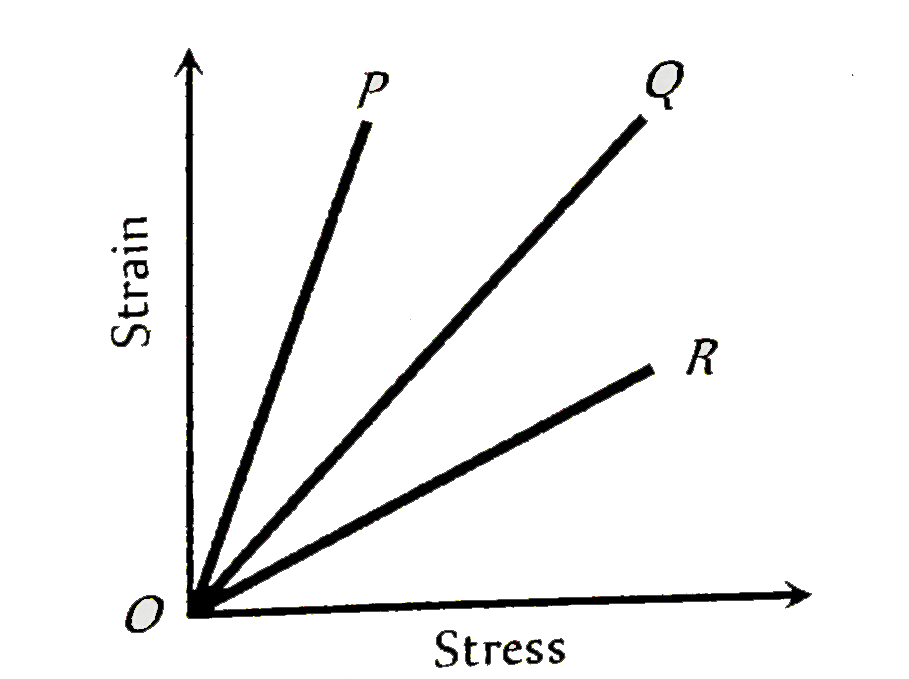
The strain stress curves of three wires of different materials are shown in the figure. P, Q and R are the elastic limits of the wires. The figure shown that
Elasticity of wire 'P' is maximum
Elasticity fo wire 'Q' is maximum
Tensile strength of R' is maximum
Elasticity P,Q&R are same
The correct Answer is:A
Step by step video, text & image solution for The strain stress curves of three wires of different materials are shown in the figure. P, Q and R are the elastic limits of the wires. The figure shown that by Physics experts to help you in doubts & scoring excellent marks in Class 11 exams.
Updated on:21/07/2023Topper's Solved these Questions
- MECHANICAL PROPERTIES OF SOLIDSBook:NARAYNAChapter:MECHANICAL PROPERTIES OF SOLIDSExercise:LEVEL-I (C.W)
Explore 37 Videos
- MECHANICAL PROPERTIES OF SOLIDSBook:NARAYNAChapter:MECHANICAL PROPERTIES OF SOLIDSExercise:LEVEL-II (C.W)
Explore 32 Videos
- MECHANICAL PROPERTIES OF SOLIDSBook:NARAYNAChapter:MECHANICAL PROPERTIES OF SOLIDSExercise:LEVEL-II (H.W)
Explore 24 Videos
- MECHANICAL PROPERTIES OF FLUIDSBook:NARAYNAChapter:MECHANICAL PROPERTIES OF FLUIDSExercise:EXERCISE - III
Explore 30 Videos
- MOTION IN A PLANEBook:NARAYNAChapter:MOTION IN A PLANEExercise:Level-II(H.W)
Explore 31 Videos
Similar Questions
Knowledge Check
The strain-stress curves of three wires of different materials ar shown in the figure P,Q and R are the elastic limits of the wires. The figure shows that :
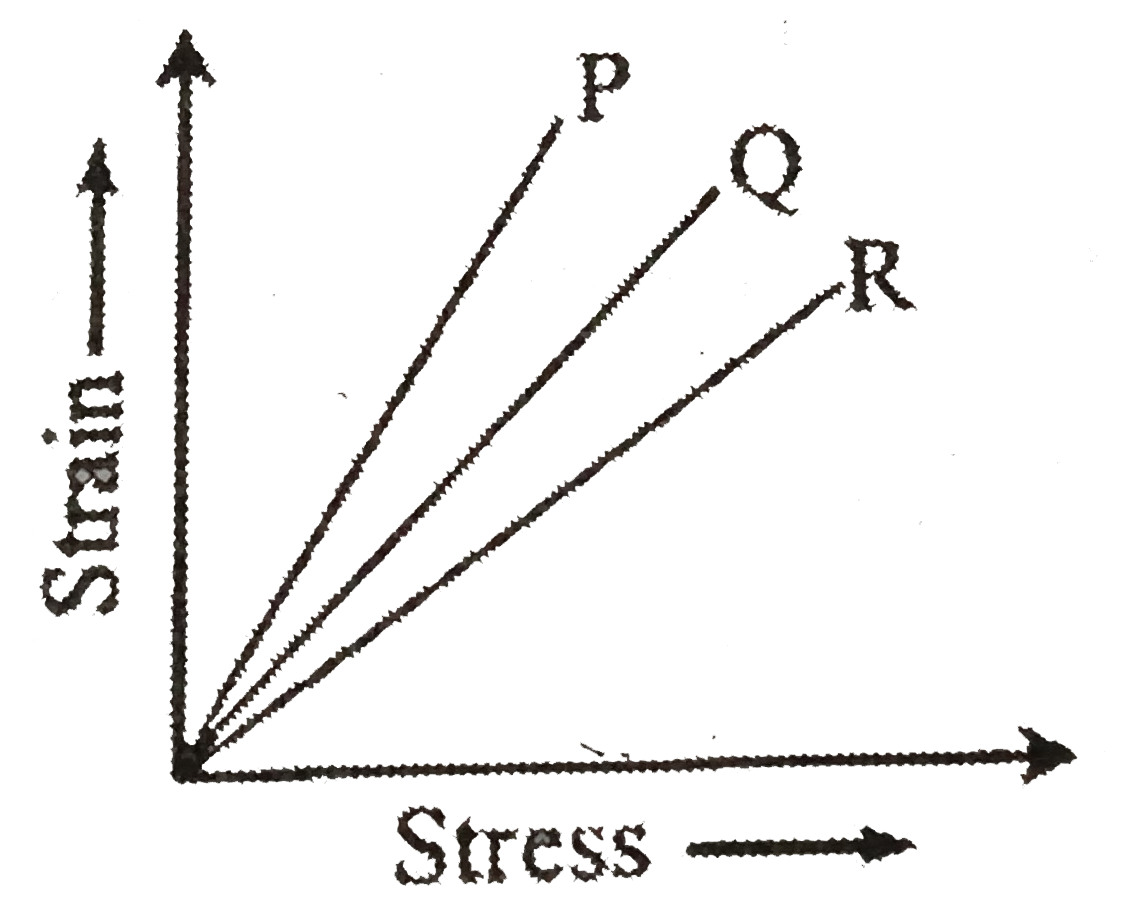 Aelasticity of wire P is maximumBelasticity of wire Q is maximumCtensile strength of R is maximumDnone of the above
The strain-stress curves of three wire of different materials are shown in the figure. P,Q and R are the elastic limits of the wires. The figures shows that
 AElasticity of wire P is maximumBElastiity of wire Q is maximumCTensile strength of R is maximumDNone of the above is true
The stain-stress curves of three wires of different material are showm in the figure P,Q,R are the elastic limits of the wires, the figure shows that
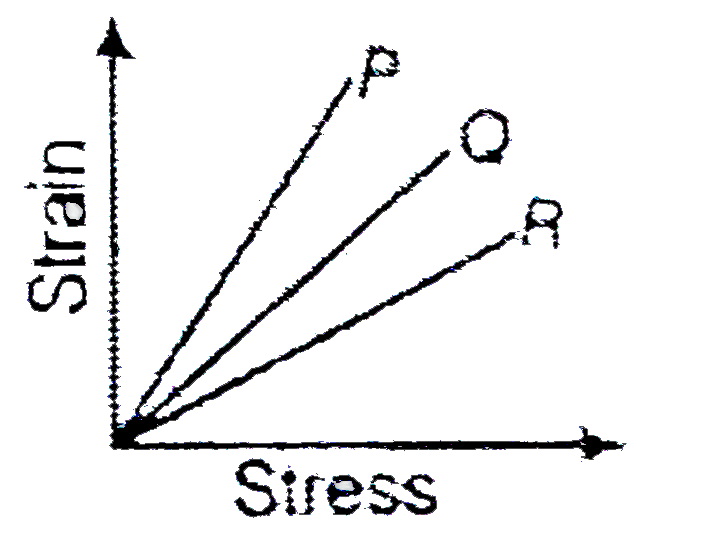 Aelasticity of wire P is maximumBelasitcity of wire R is maximumCtensile strenght of R is maximumDNone the above
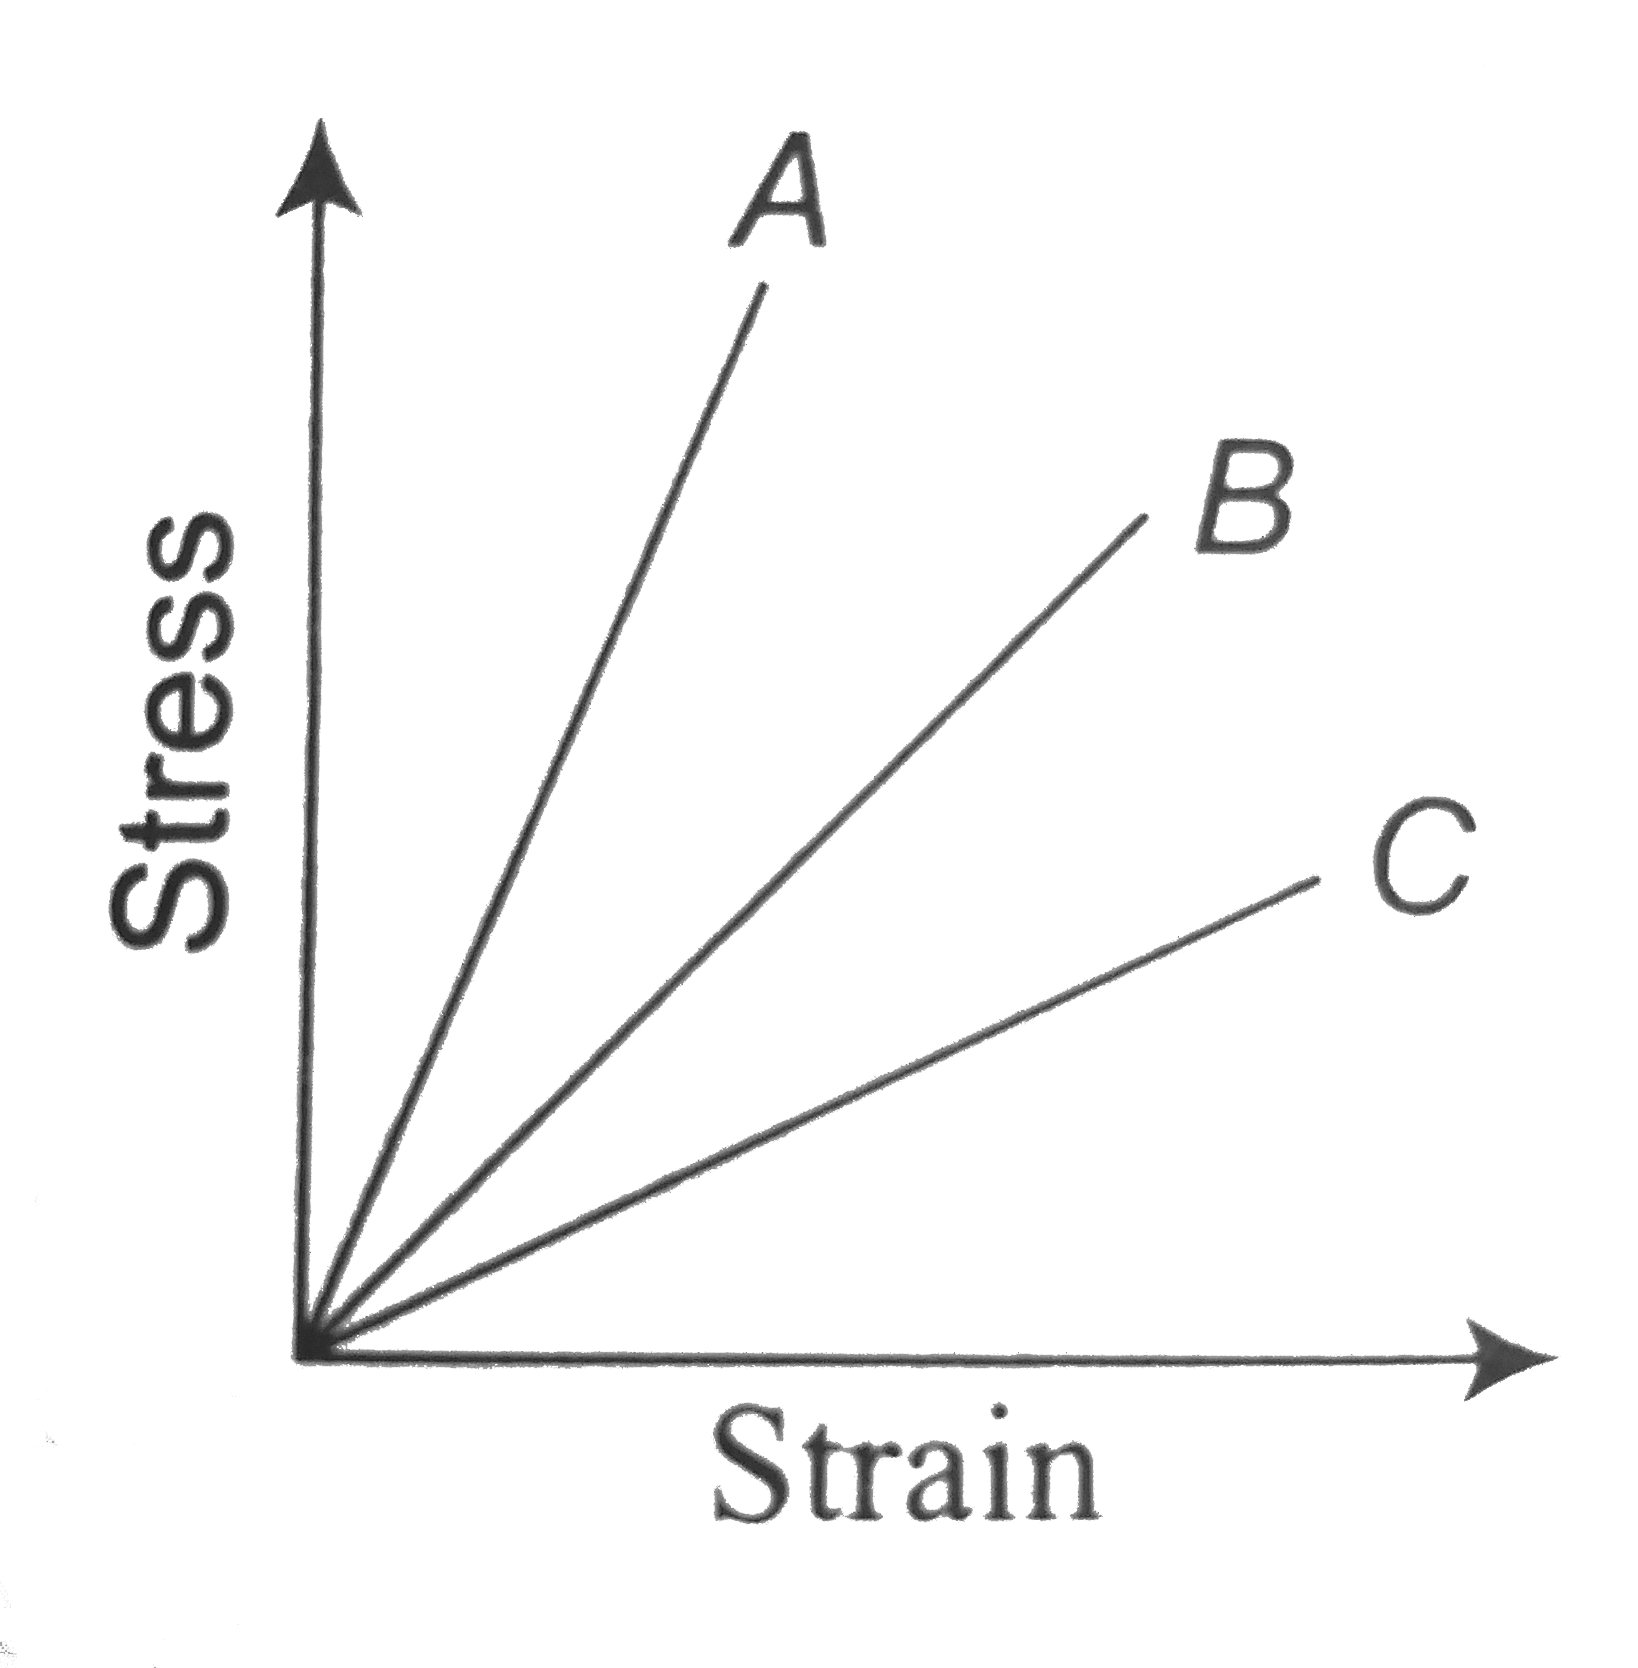
The stress strain curves for brass, steel and rubber are shown in the figure. The lines A, B and C are for
View Solution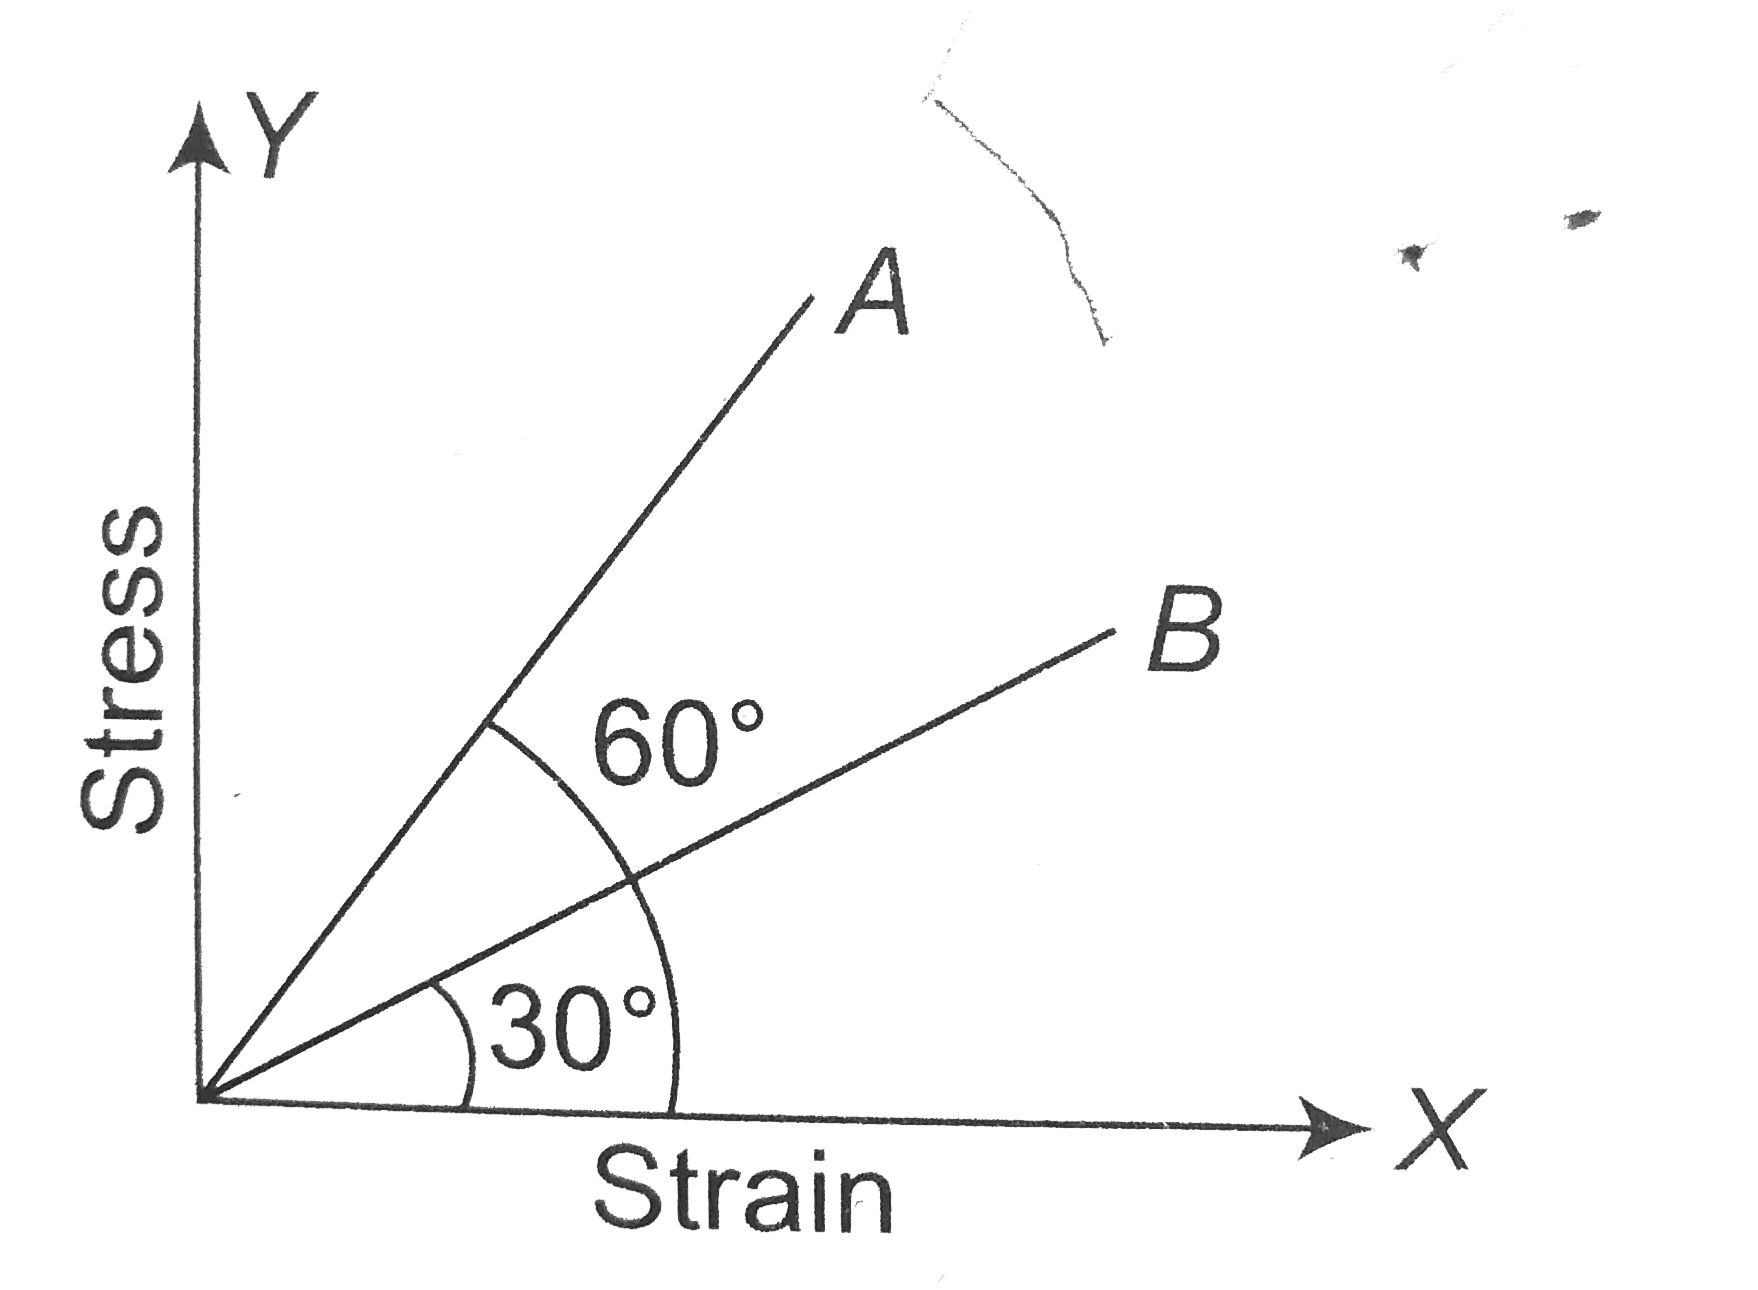
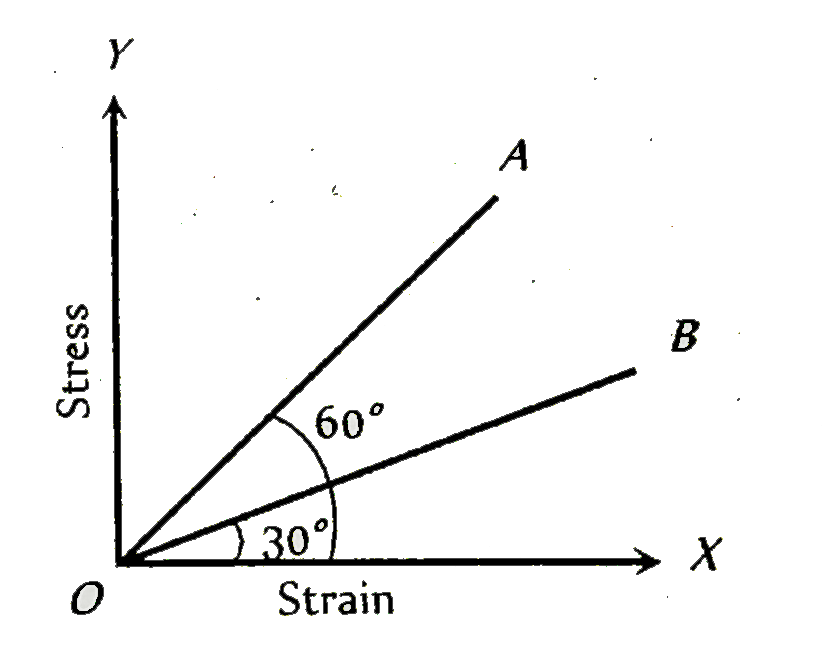
The stress versus strain graphs for wires of two materials A and B are as shown in the figure. If YA and YB are the Young's moduli of the materials then
View SolutionThe stress versus strain graphs for wires of two materials A and B are as shown in the figure. If YAandYB are the younng's moduli of the materials, then
View SolutionA wire is sliding as shown in Figure. The angle between the acceleration and the velocity of the wire is
View SolutionIf linear charge density of a wire as shown in the figure is λ
View Solution


