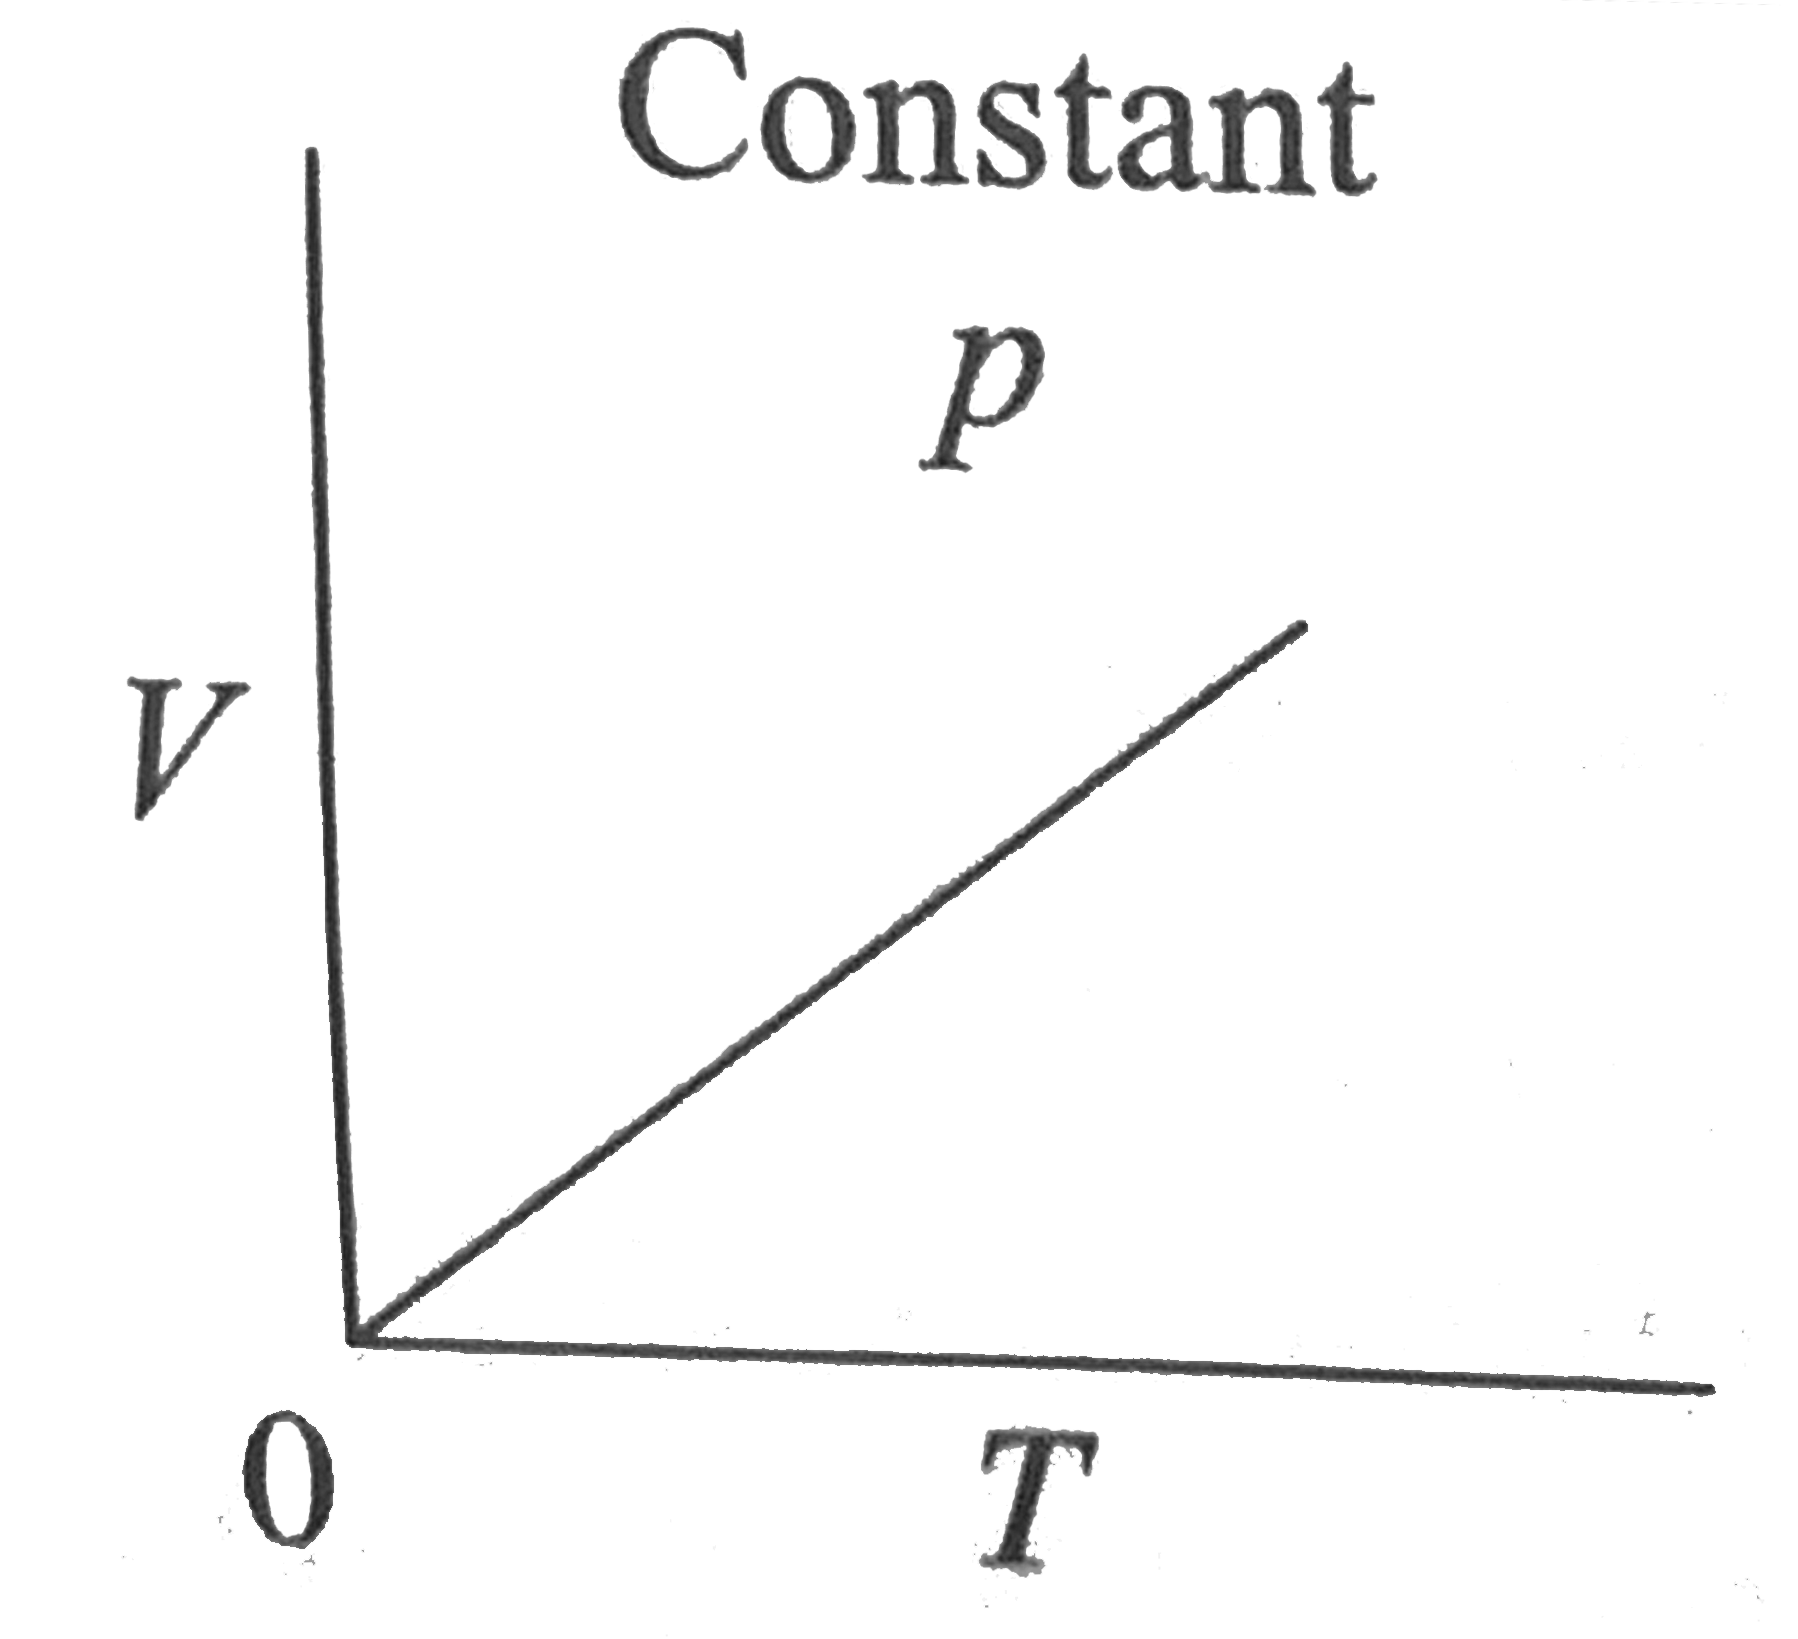
Which of the following diagrams correctly decribes the behavior of a fixed mass of an ideal gas ? (T is measured in K)
A
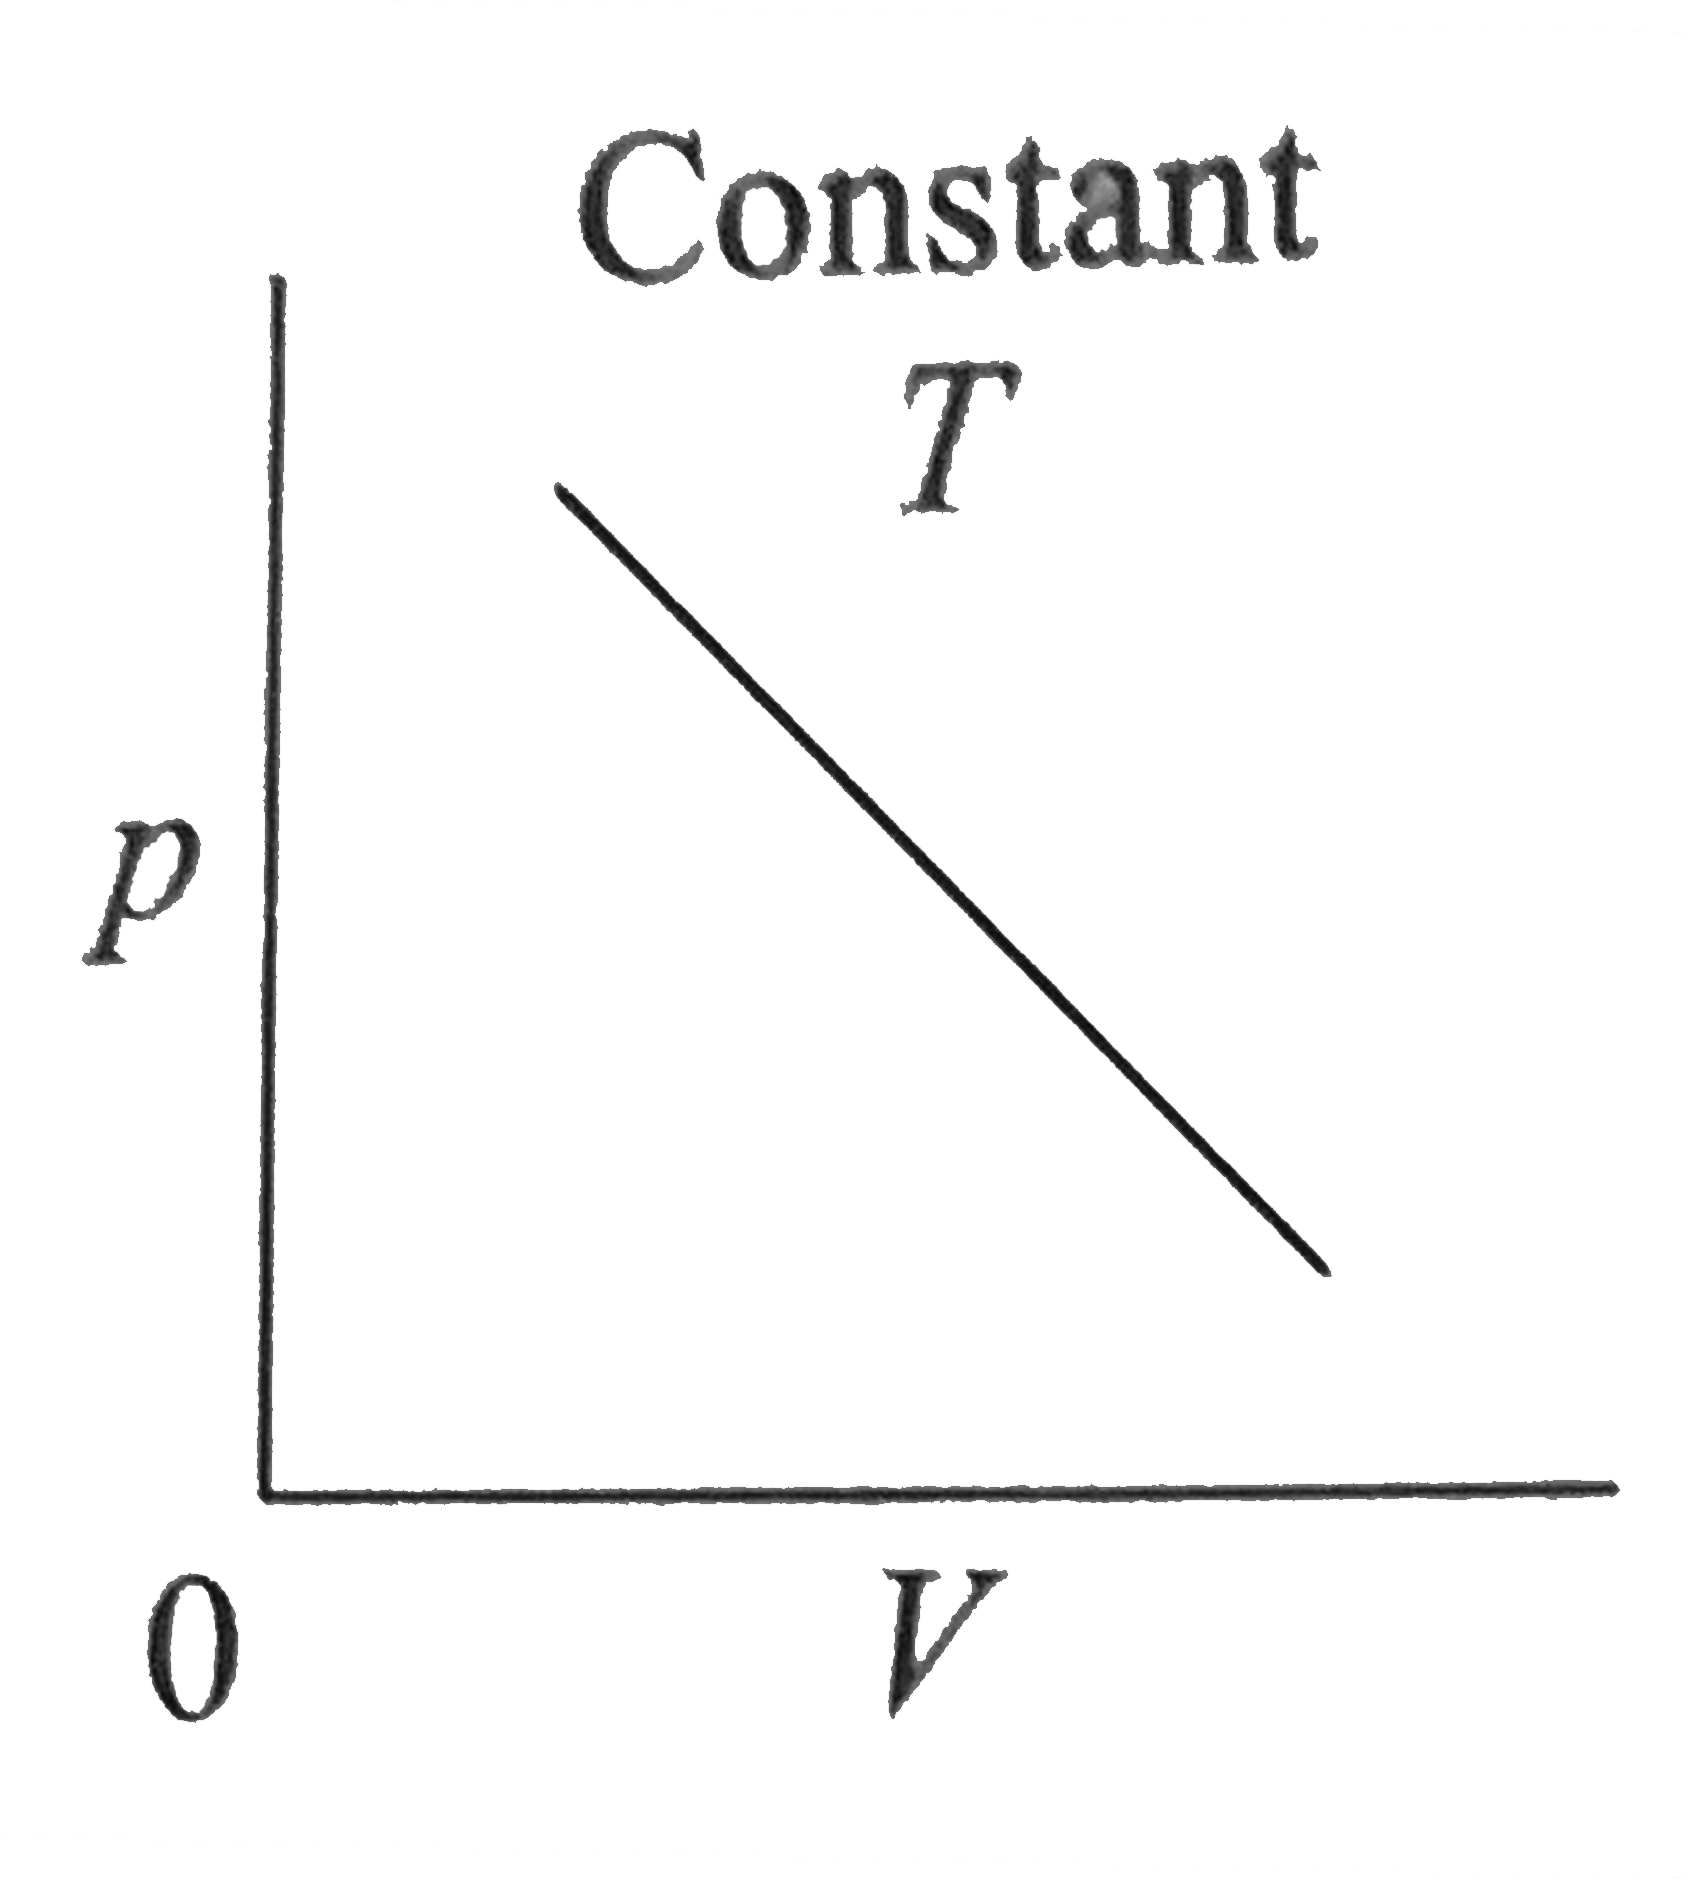
B
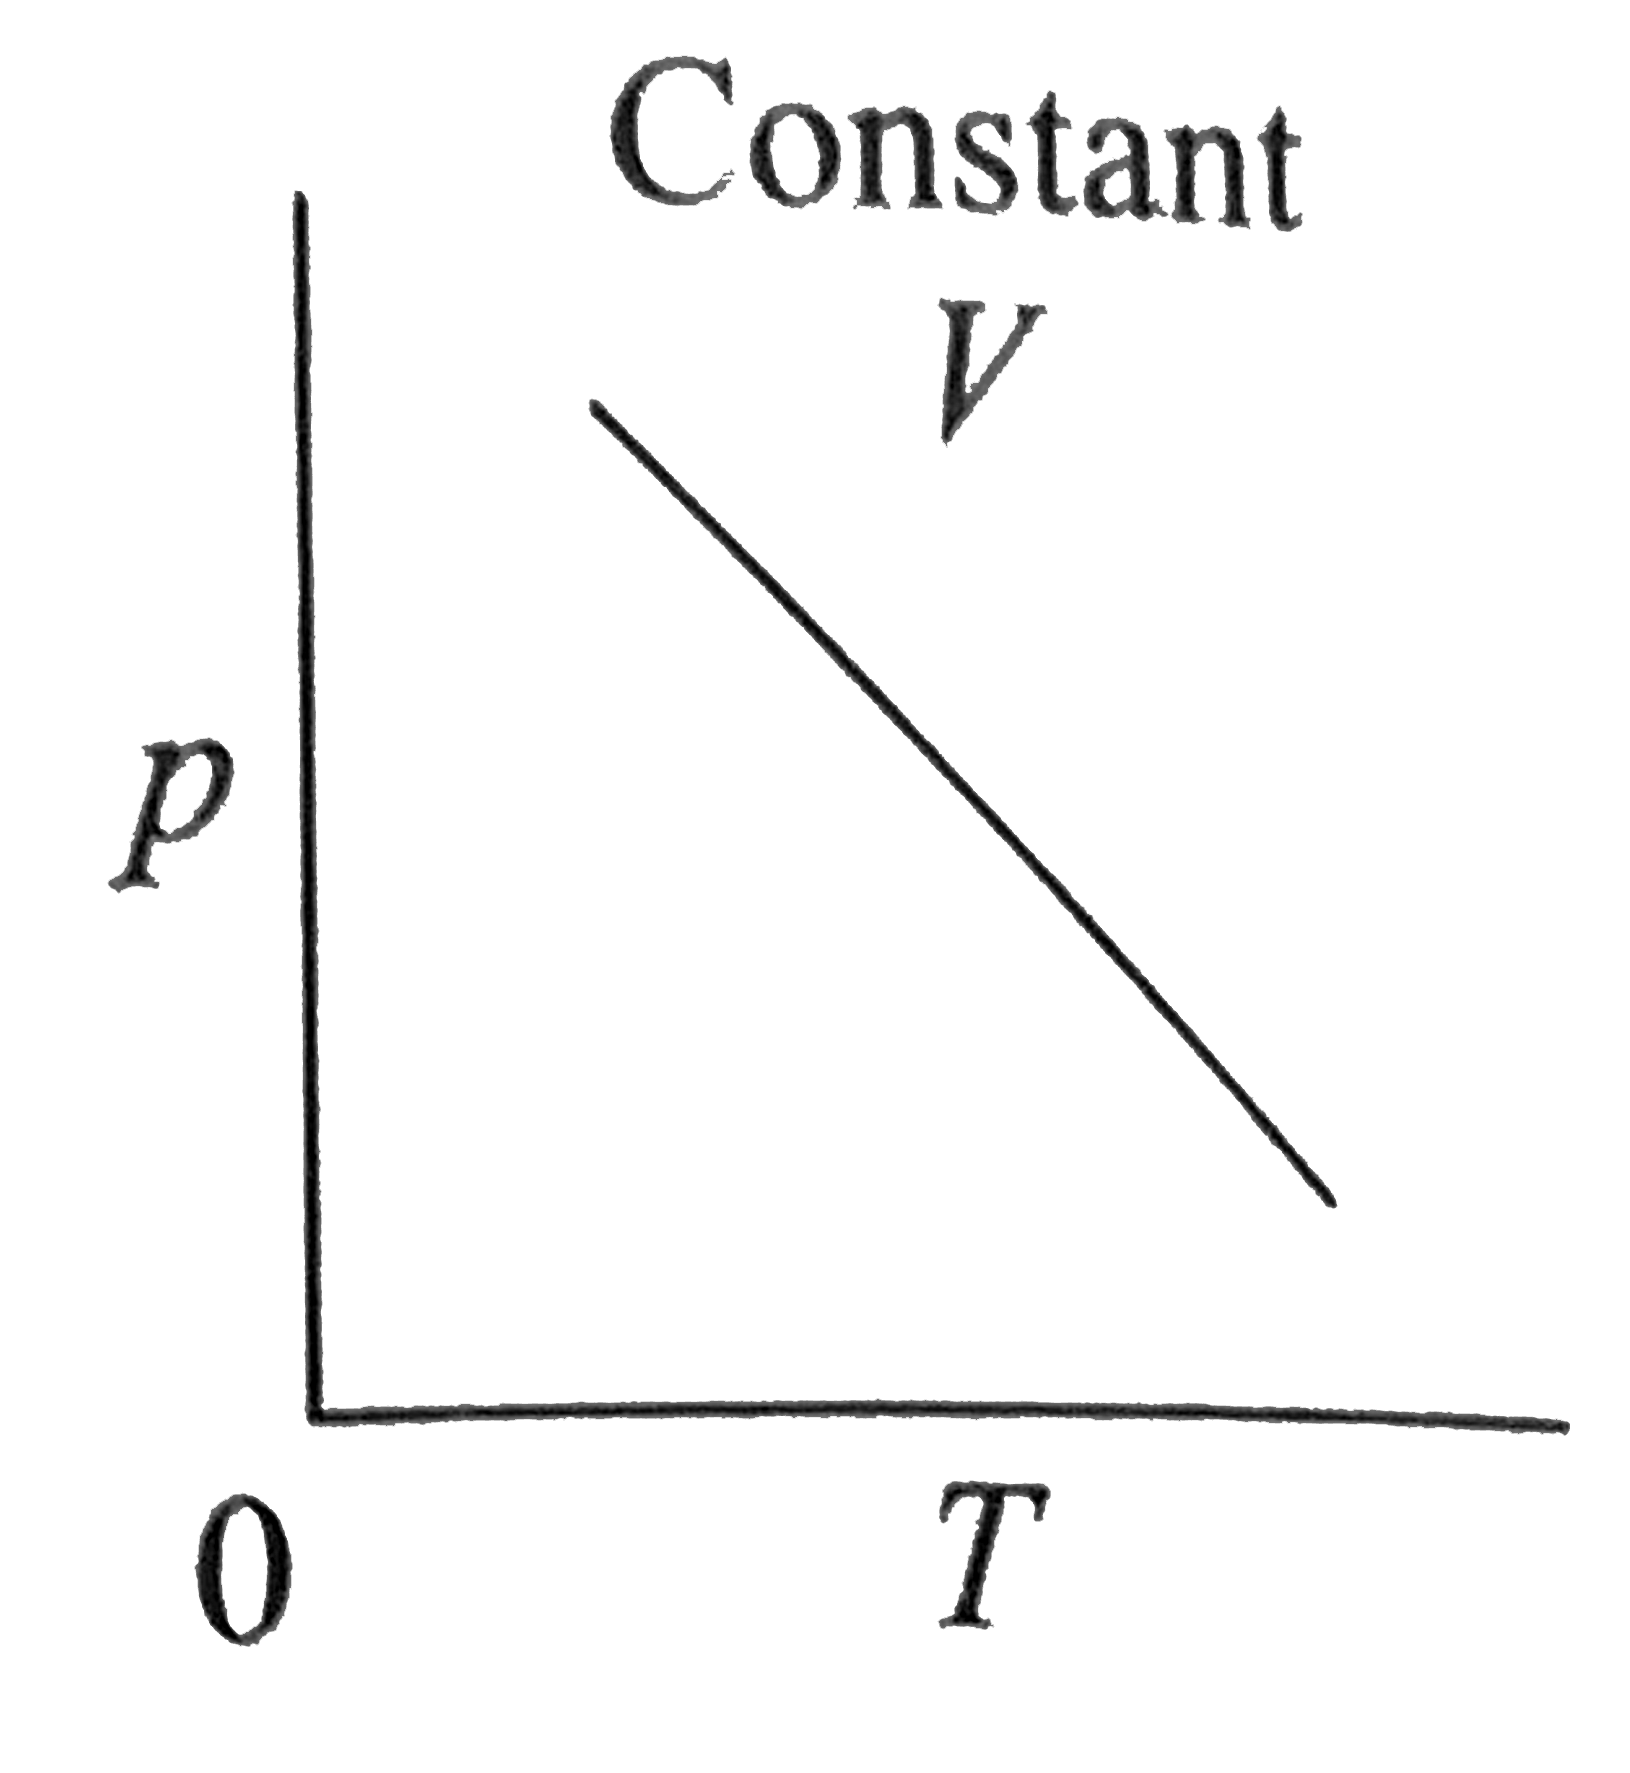
C
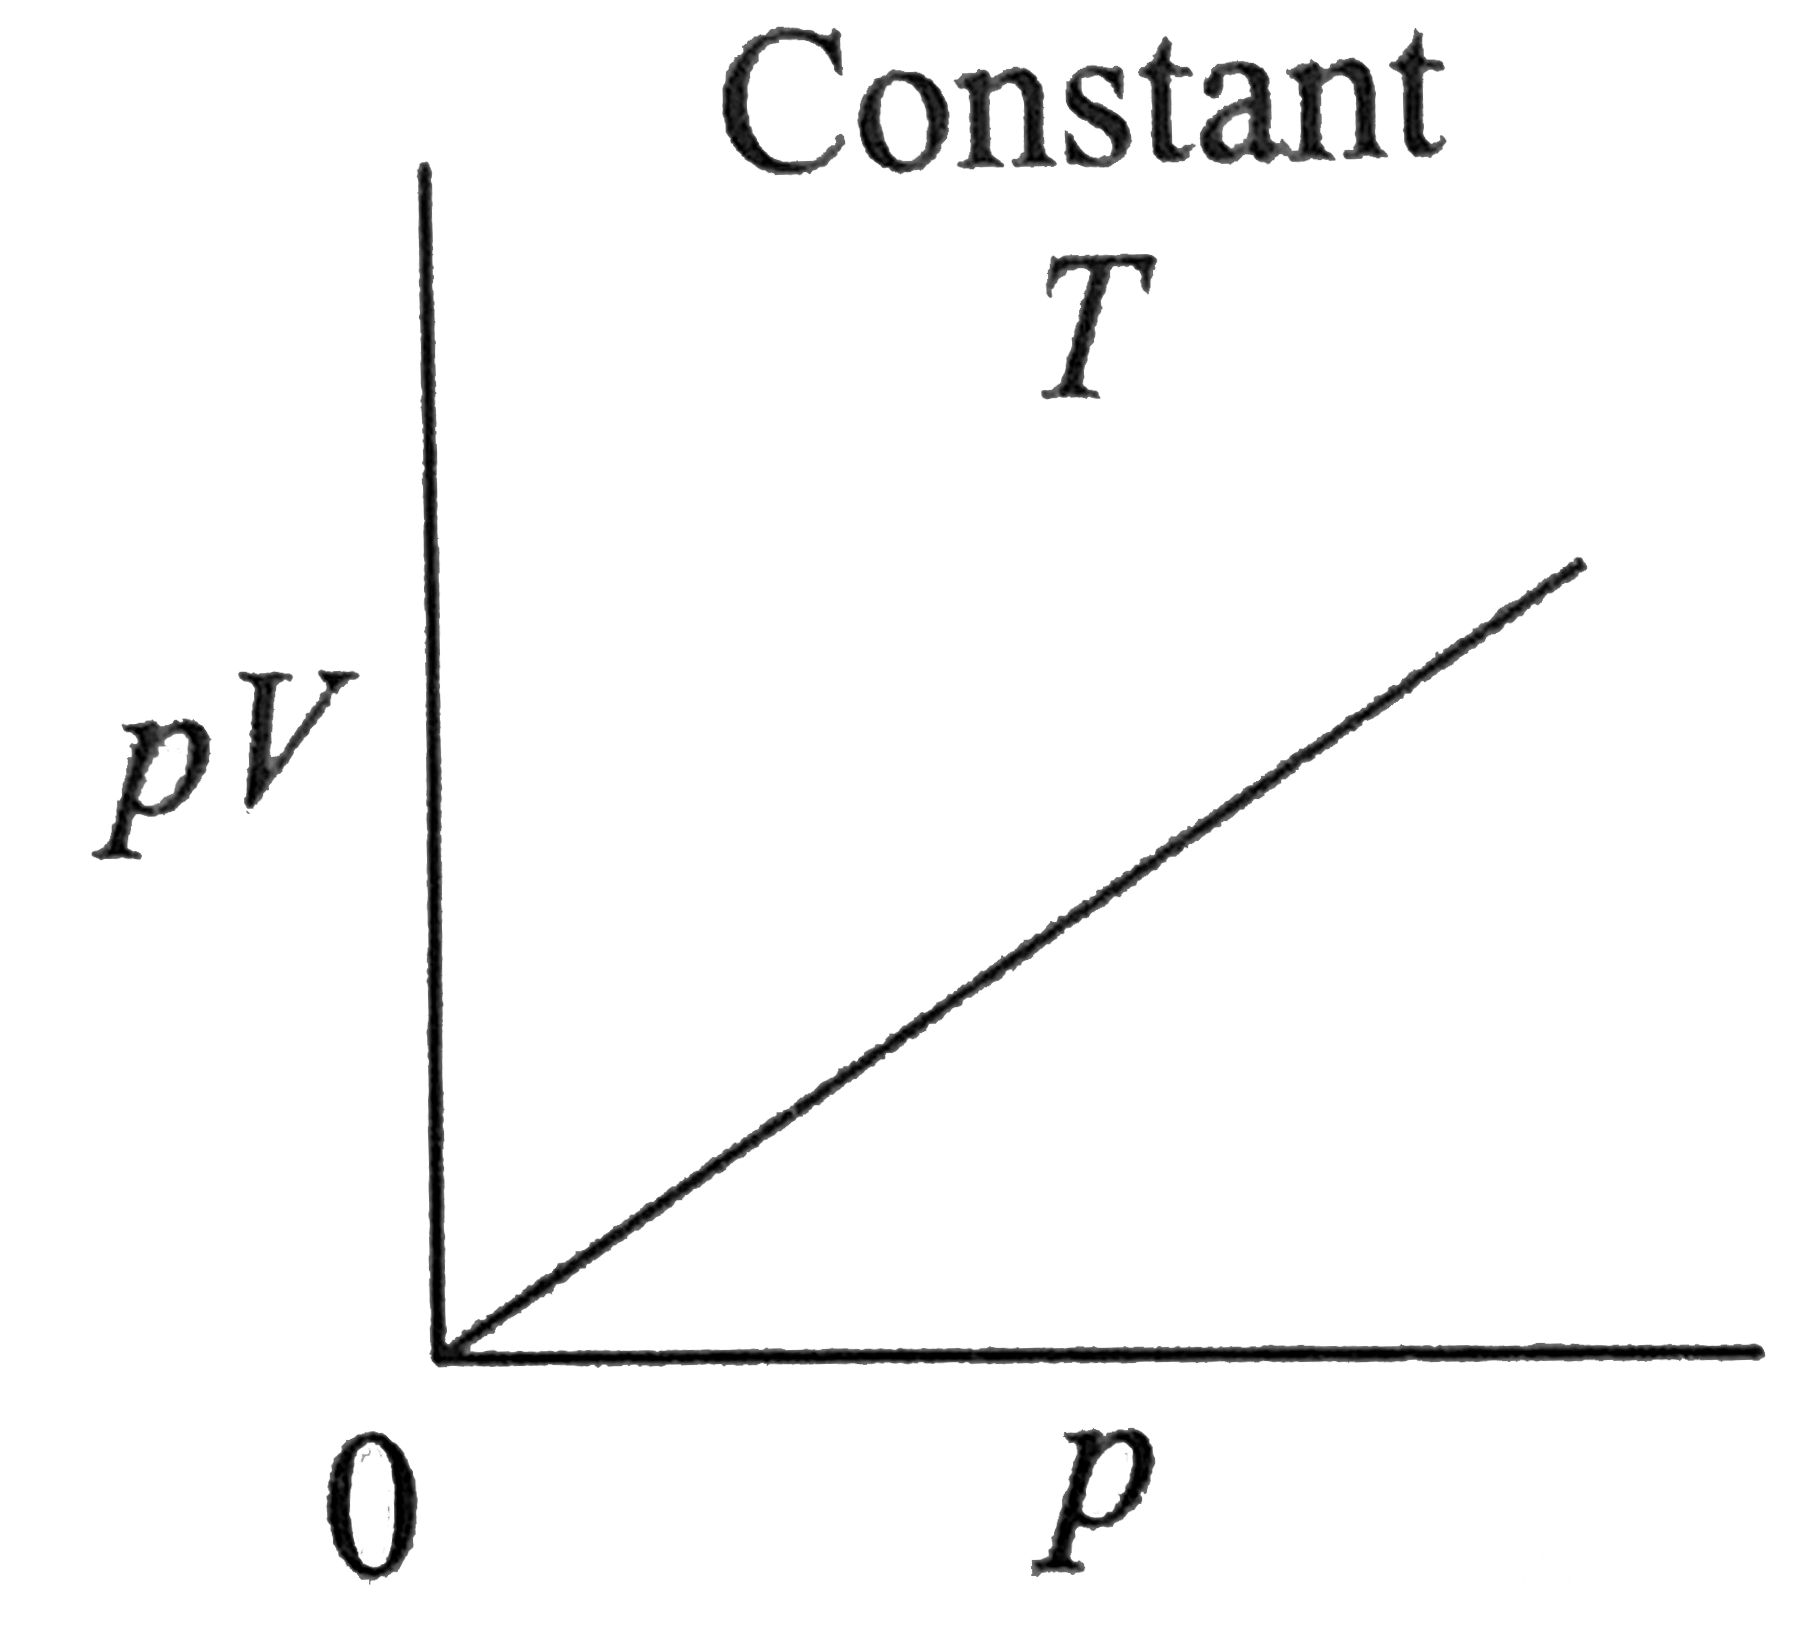
D
Video Solution
Text Solution
According to Charle's law , at constant p, the volume occupied by a fixed mass of an ideal gas is directly proportional
V=kT
It has the form of the liner equation y=mx. Thus , by plotting V versus T , we obtain a straight line with positive slope and zero intercept.
|
Topper's Solved these Questions
- STATES OF MATTERBook:R SHARMAChapter:STATES OF MATTERExercise:Question Bank Level - IV
Explore 6 Videos
- SOME BASIC CONCEPTS OF CHEMISTRYBook:R SHARMAChapter:SOME BASIC CONCEPTS OF CHEMISTRYExercise:Archives
Explore 26 Videos
- STRUCTURE OF ATOMBook:R SHARMAChapter:STRUCTURE OF ATOMExercise:ARCHIVES
Explore 55 Videos
Similar Questions
Knowledge Check
Which of the following diagram correctly describes the behaviour of a fixed mass of an ideal gas ? (T is measured in K)
A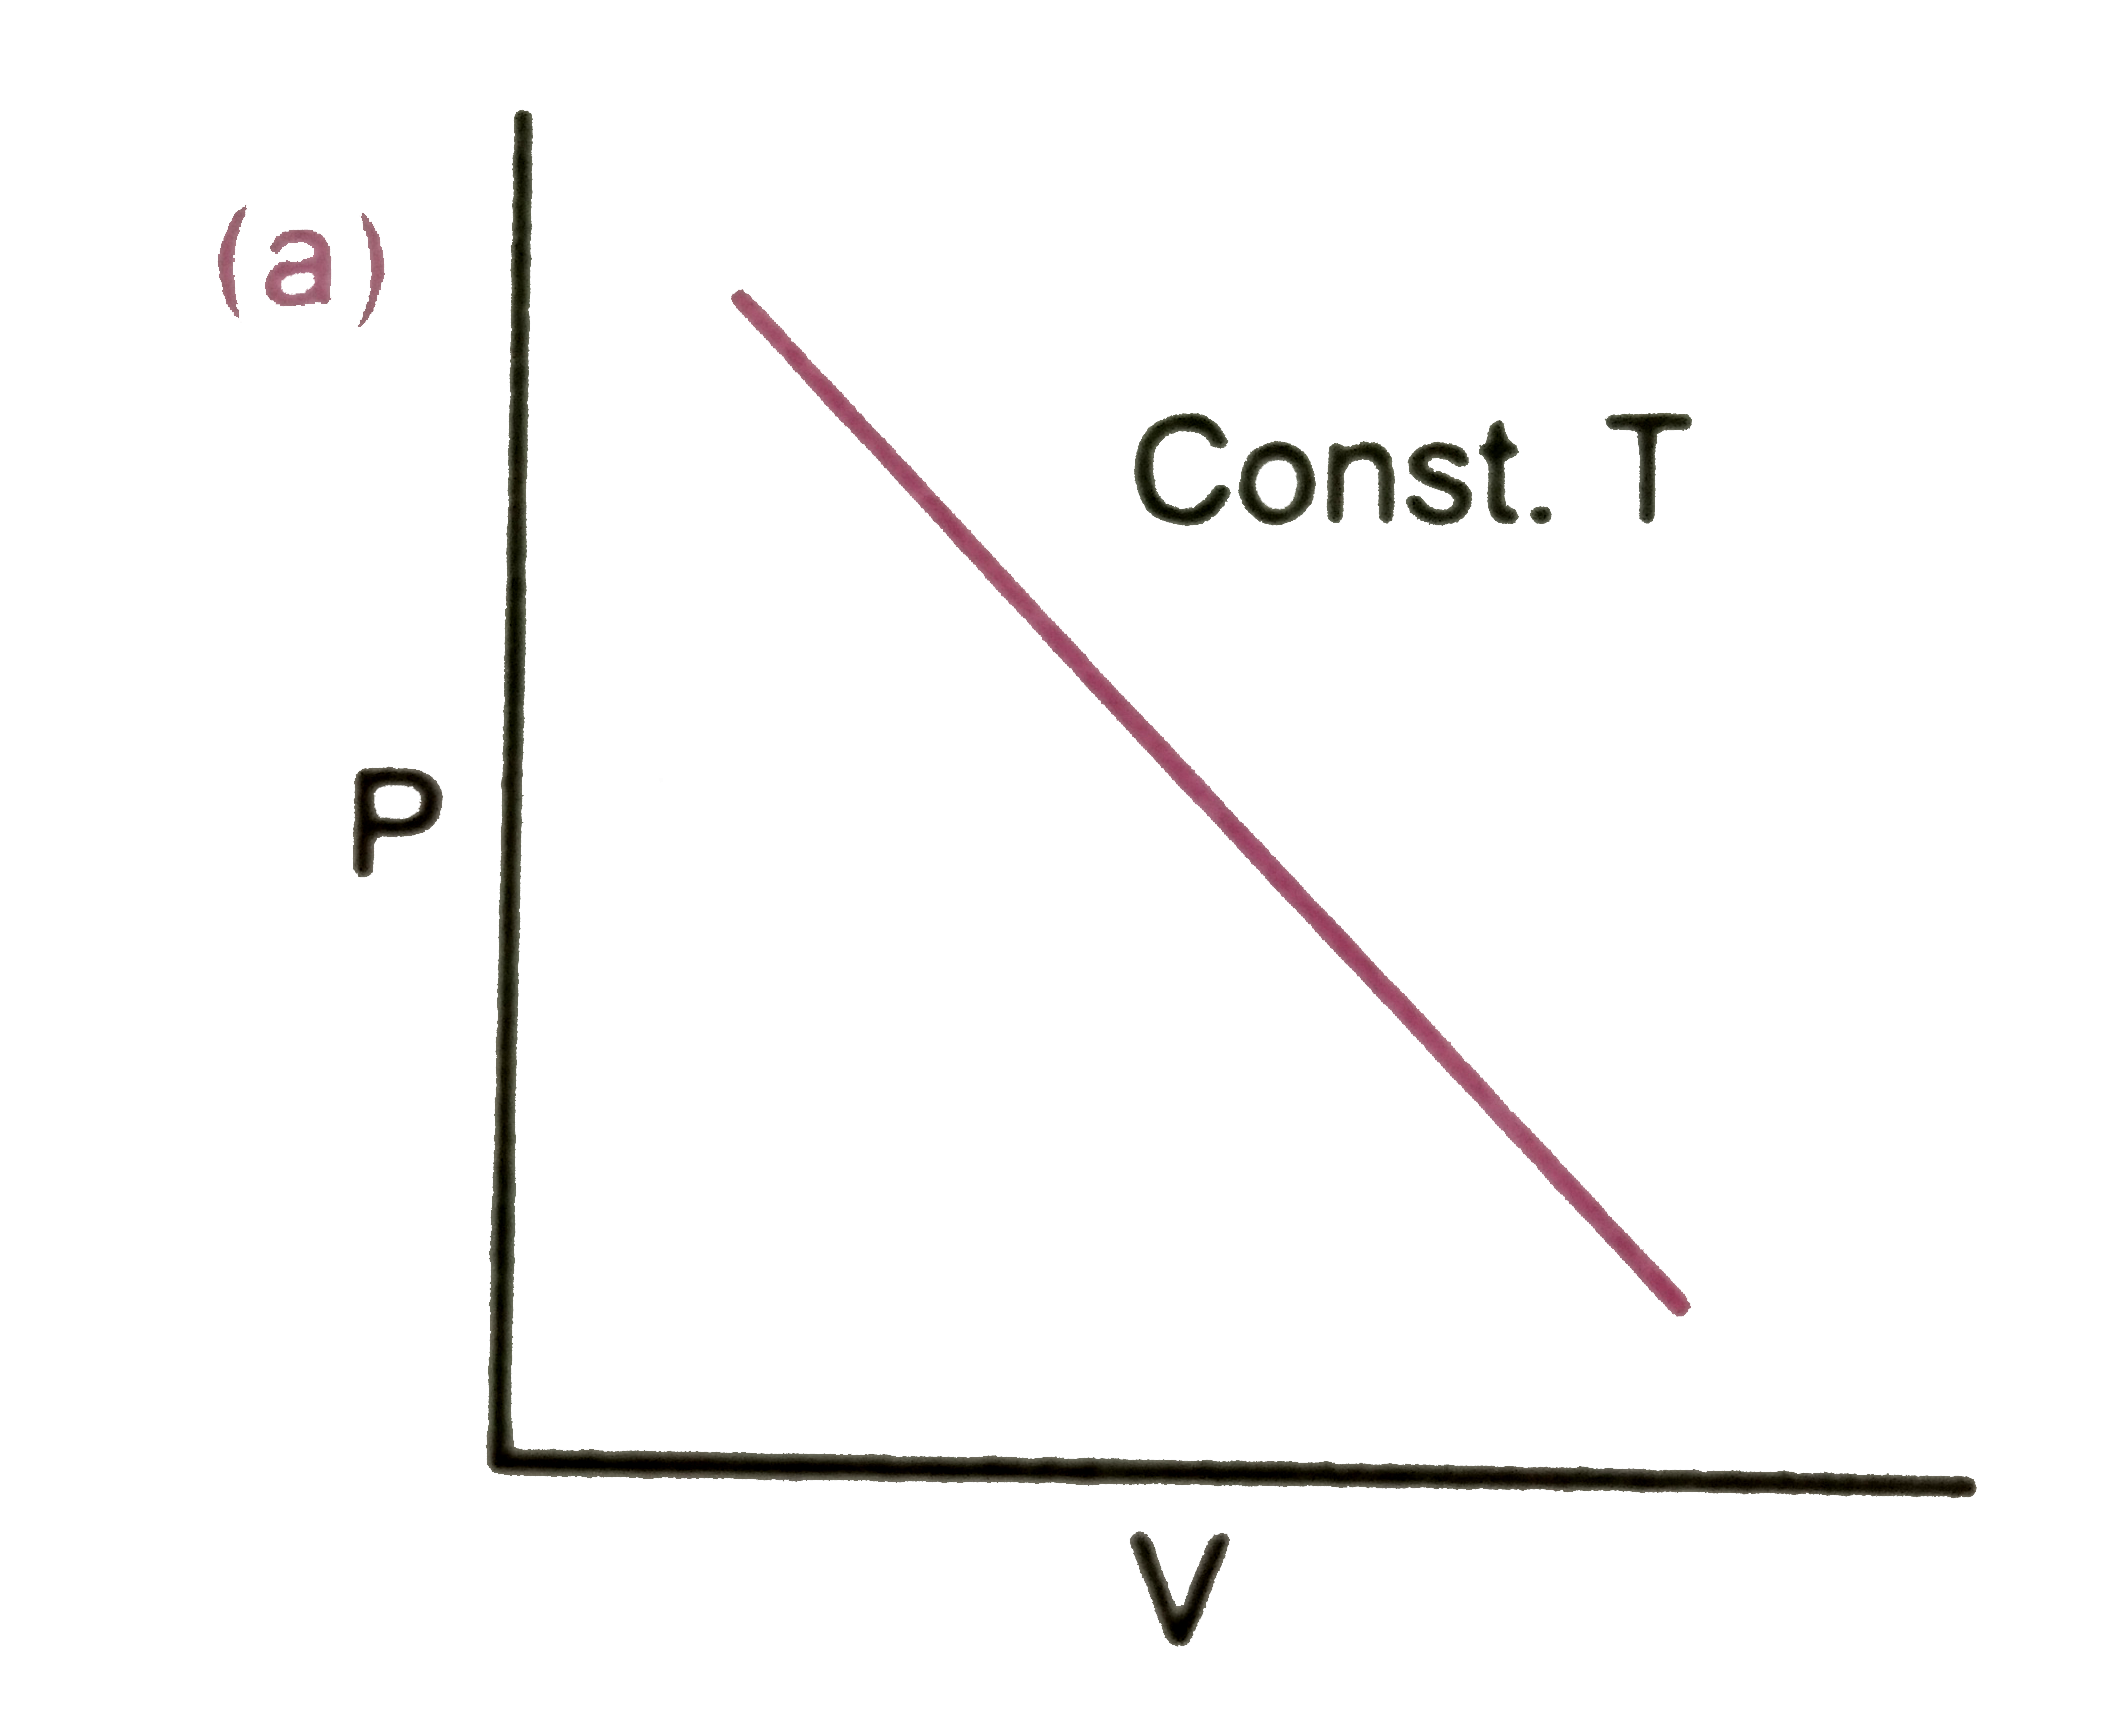 B
B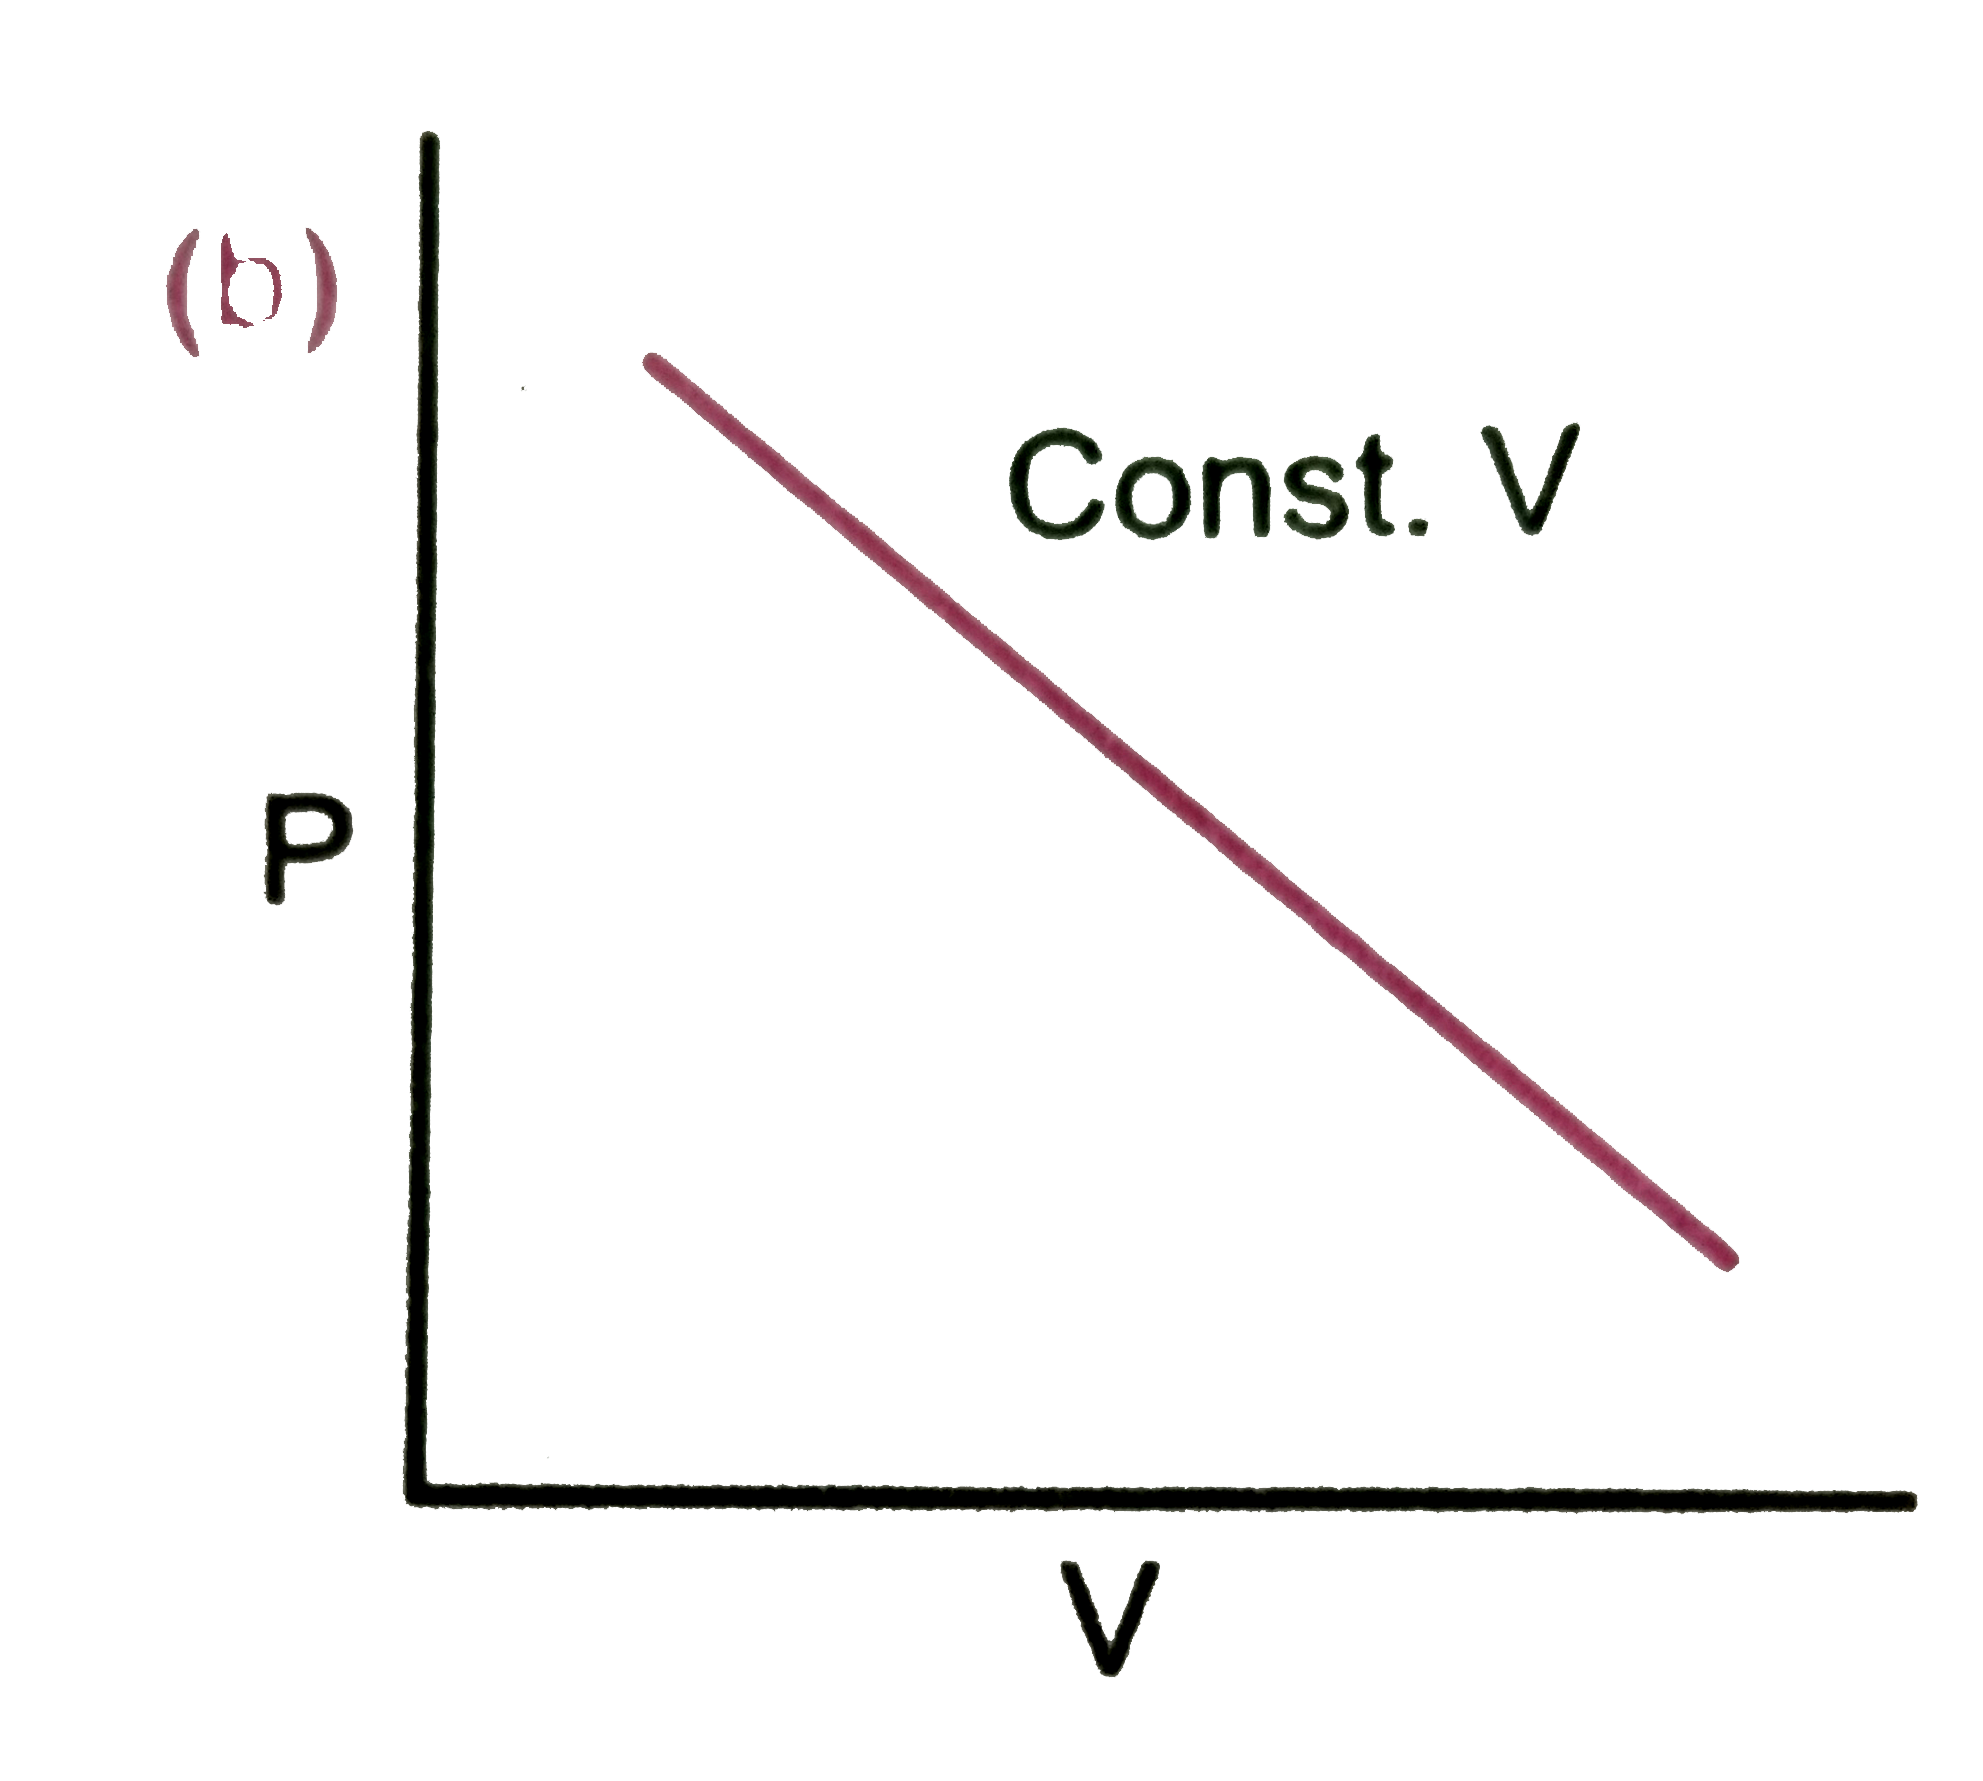 C
C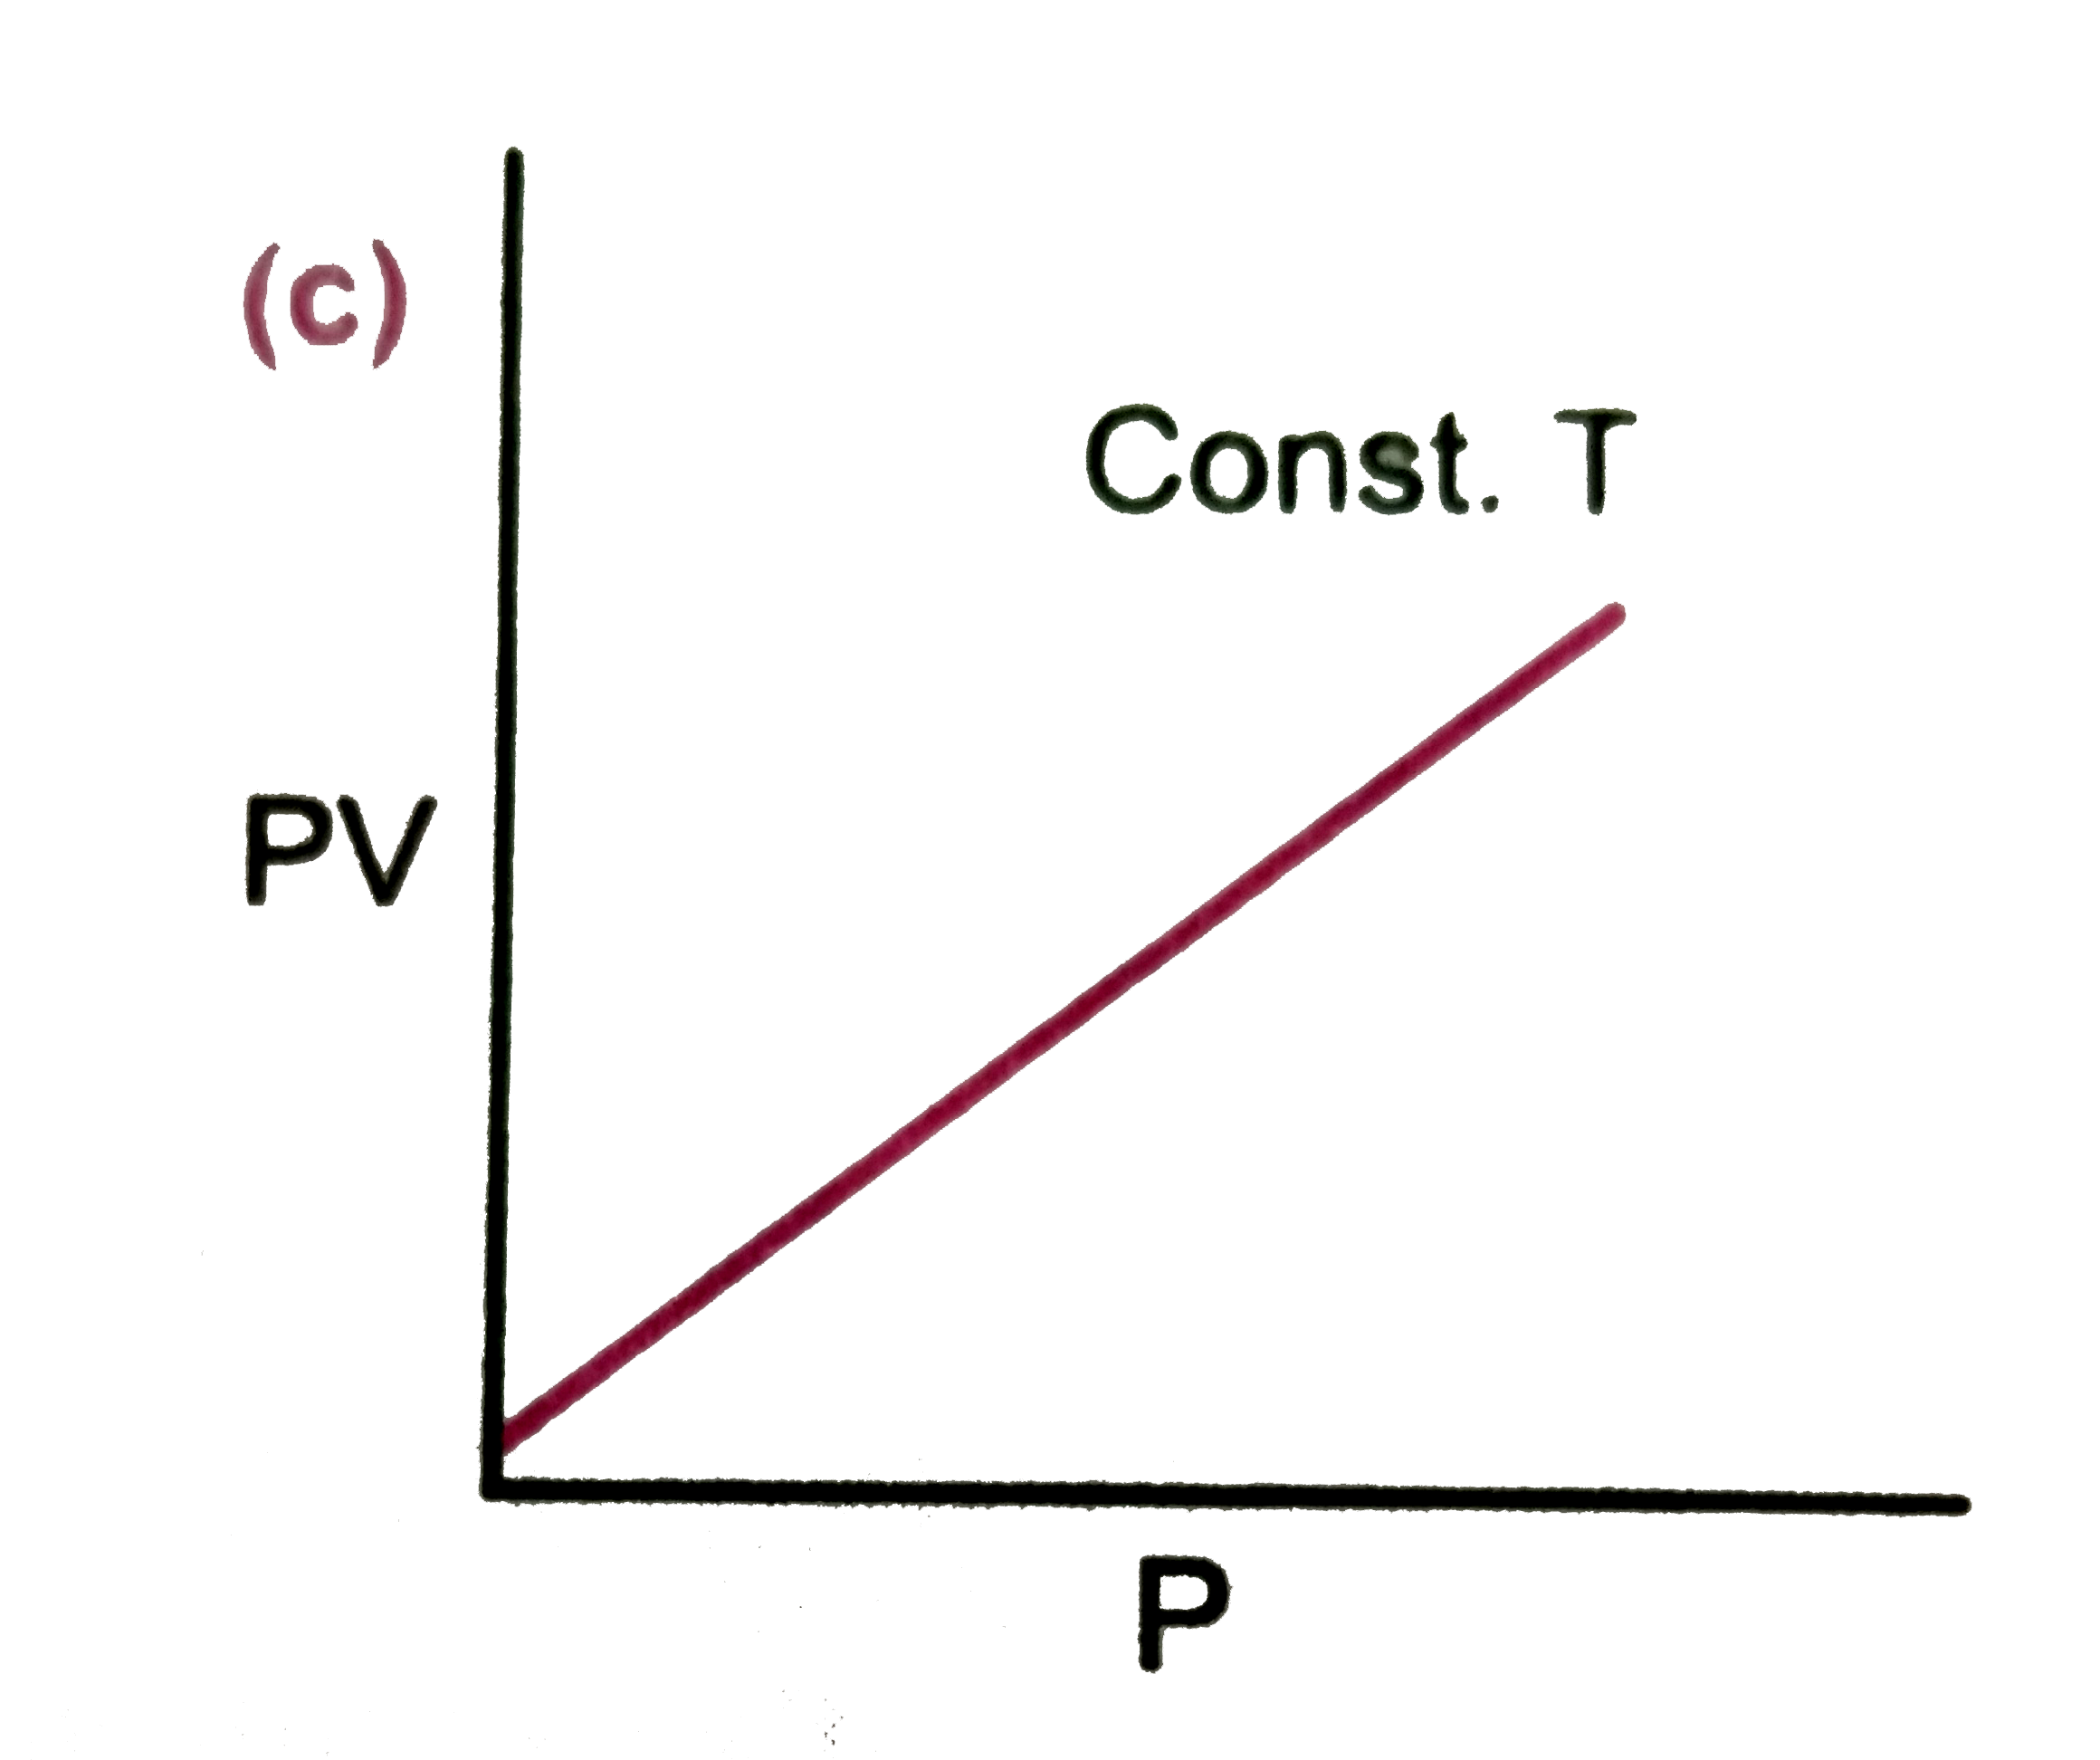 D
D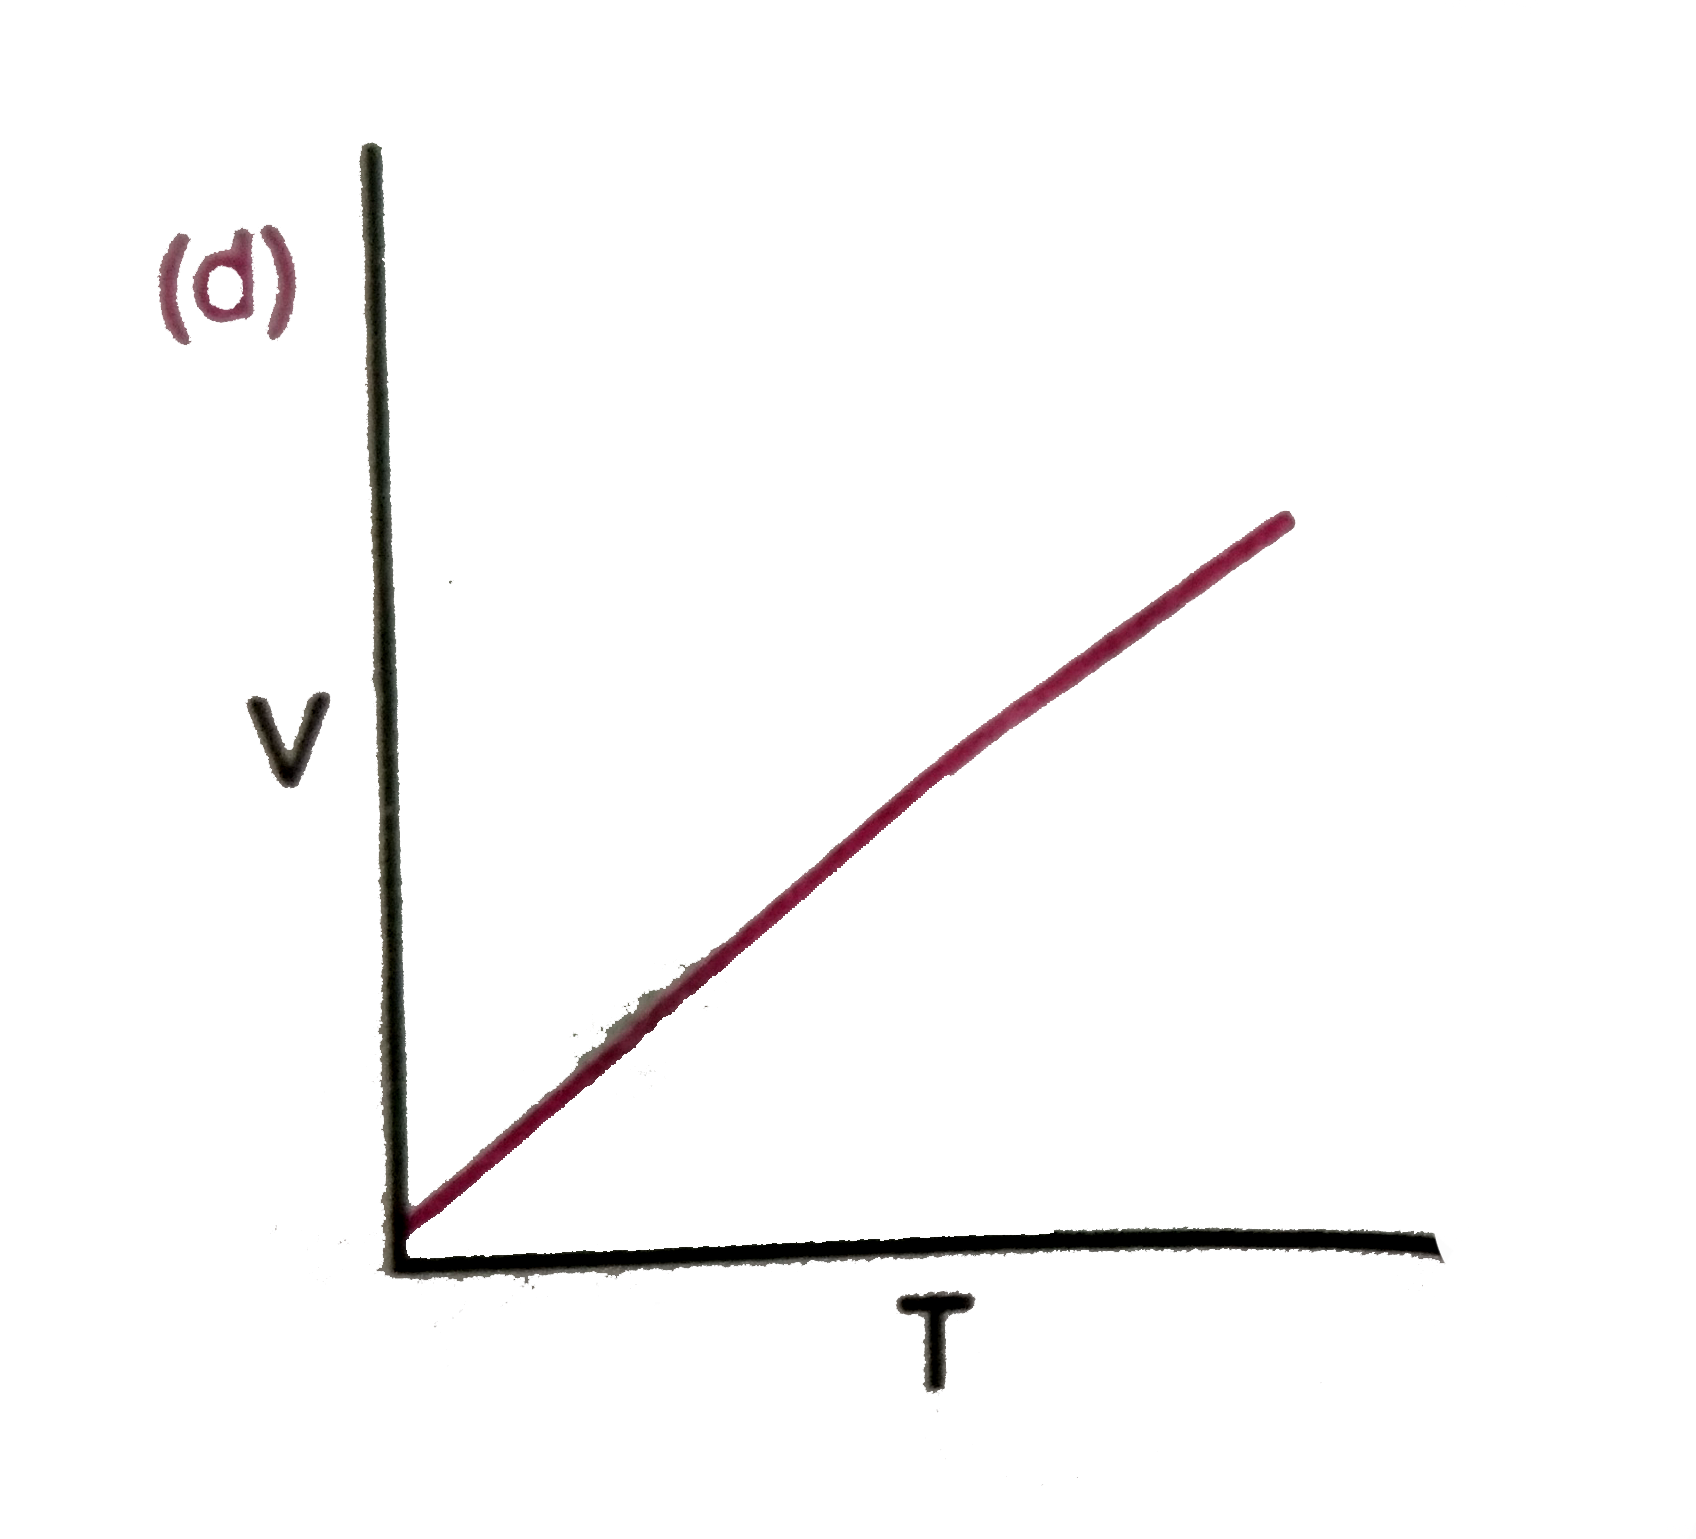
Which of the following diagrams correctly represents the counter pattern ?
A B
B C
C D
D
Which of the following diagram is correctly related to refining of gold?
A B
B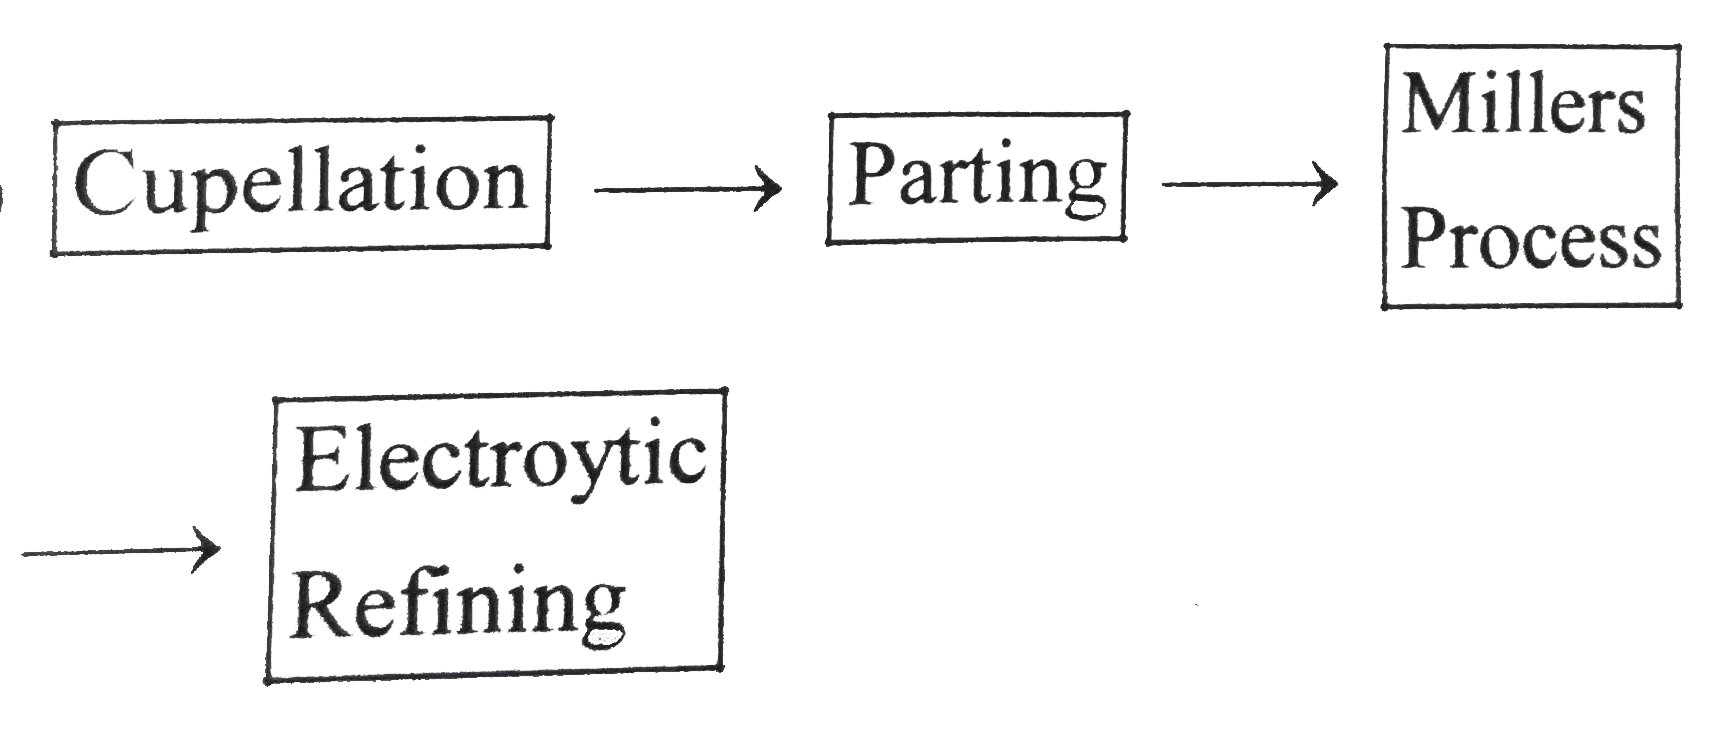 C
C D
D
Which of the following diagrams, Fig. depicts ideal gas behaviour ?
View SolutionWhich of the following diagrams (figure) depicts ideal gas behaviour?
View SolutionWhich of the following best decribes the alkali metals?
View SolutionWhich of the following measure the deviation from ideal behaviour of gas?
View SolutionWhich of the following options is correct w.r.t. ideal gas
View Solution


