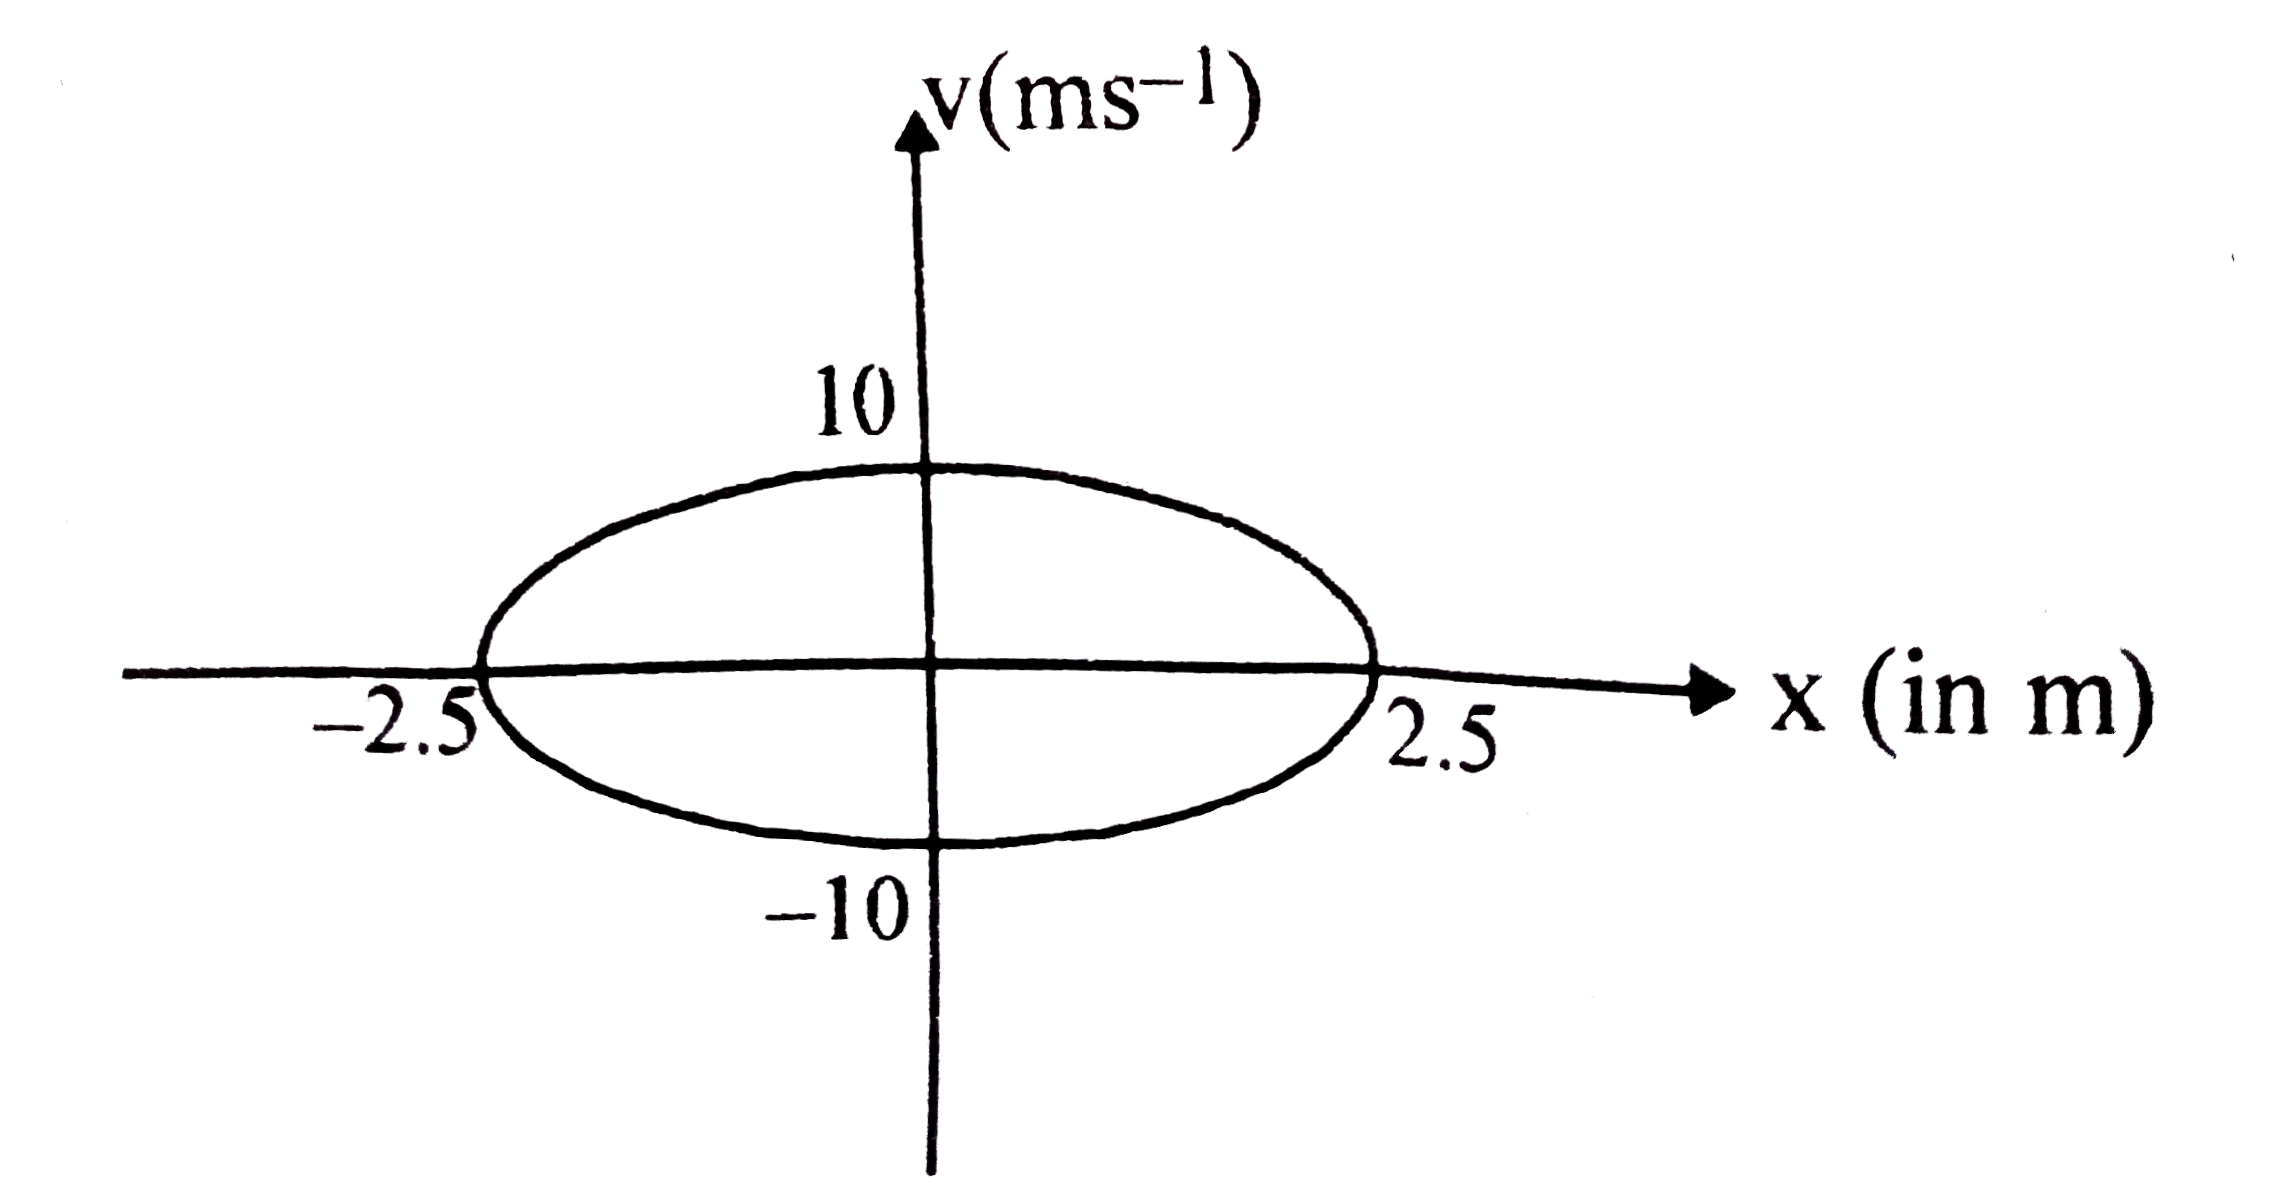
The figure shows a graph between velocity and displacement (from mean position) of a particle performing SHM: 
the time period of the particle is 1.57s
the maximum acceleration will be 40cm/s2
the velocity of particle is 2√21cm/s when it is at a distance 1cm from the mean position.
none of these
The correct Answer is:A, B, C
Figure
Similar Questions
Knowledge Check
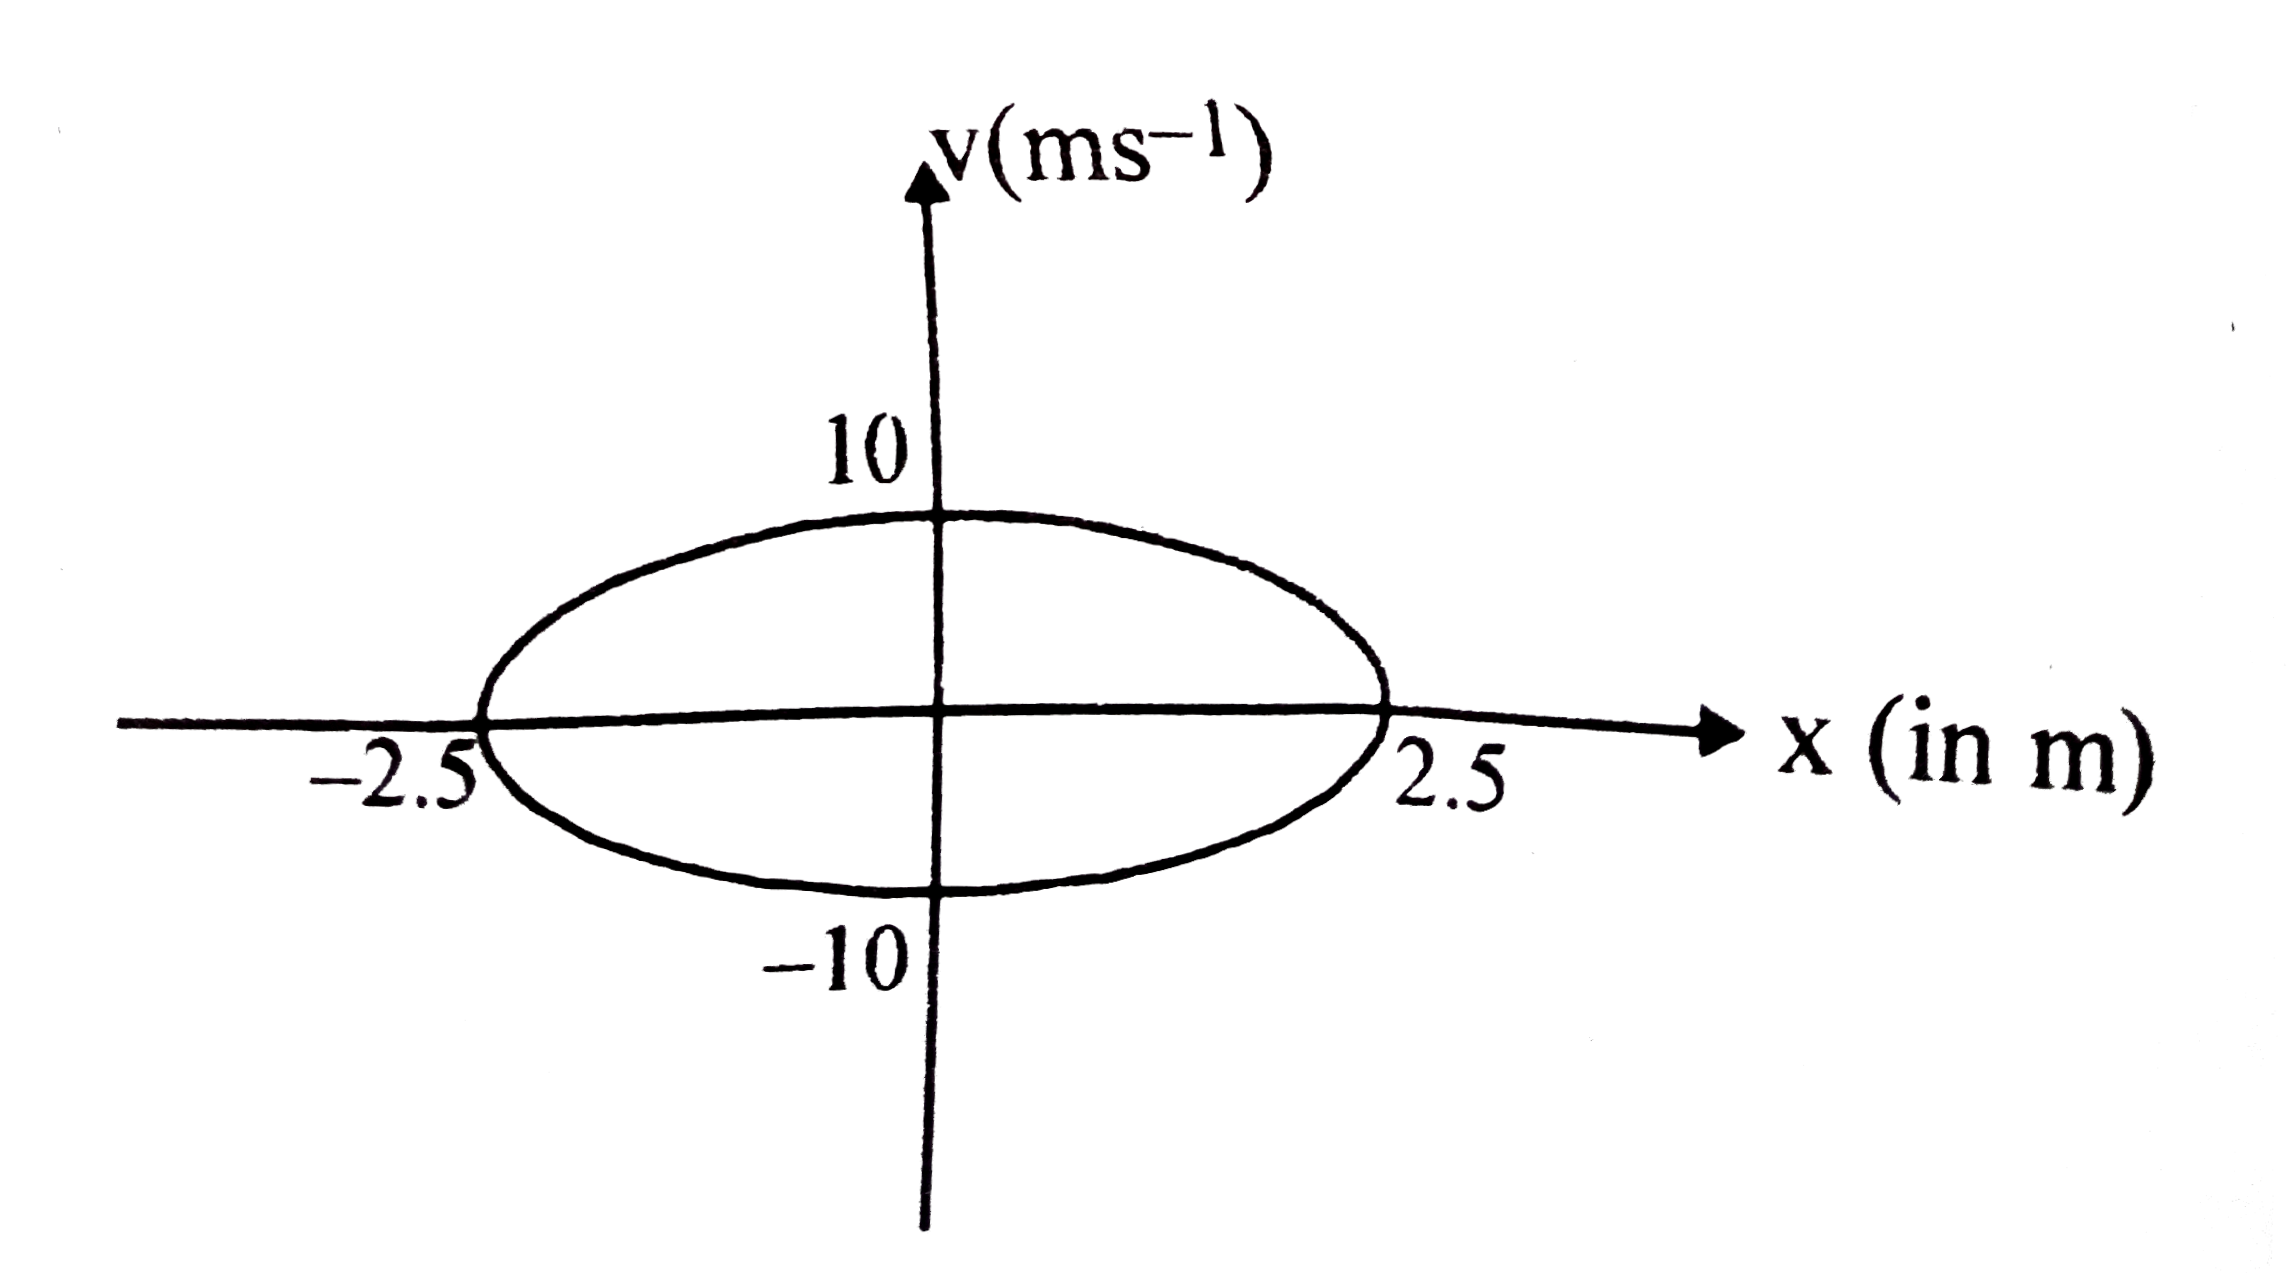
The figure shows graph between velocity 'V' and displacement 'X' from mean position of a particle performing simple harmonic motion

The time period of motion of particle is:Aπ4sBπ2sCπsD2πsThe figure shows graph between velocity 'V' and displacement 'X' from mean position of a particle performing simple harmonic motion

The velocity of particle when it is at a distance 1.5m from mean position is :A4ms−1B8ms−1C12ms−1D16ms−1The graph between instantaneous velocity and angular displacement of a particle performing S.H.M. is
AparabolaBstraight lineCsinusoidalDcircle
The velocity of a particle in simple harmonic motion at displacement y from mean position is
View SolutionA particle of mass 1kg is udnergoing S.H.M., for which graph between force and displacement (from mean position) as shown.
Its time period, in seconds, is-

View SolutionThe graph between potential energy and displacement of a particle performing S.H.M. is
View SolutionWhich of the following graphs correctly shows variation between the restoring force I F I and distance from the mean position (x) of a particle performing linear S.H.M.?
View SolutionThe graph between instantaneous acceleration and angualr displacement of a particle performing S.H.M. is
View Solution

