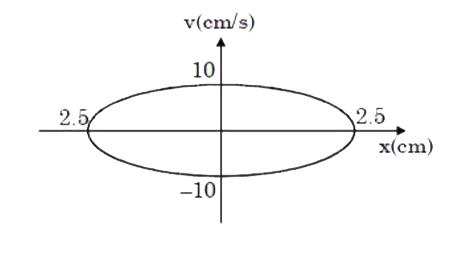
The graph between potential energy and displacement of a particle performing S.H.M. is
parabola
straight line
ellipse
circle
The correct Answer is:A
Step by step video, text & image solution for The graph between potential energy and displacement of a particle performing S.H.M. is by Physics experts to help you in doubts & scoring excellent marks in Class 12 exams.
Updated on:21/07/2023Topper's Solved these Questions
Similar Questions
A graph between velocity and displacement of a particle performing SHM is shown. Find the acceleration when the particle is at half of maximum displacement from mean position.

View SolutionWhat is the nature of the graph between the potential energy and total energy of a particle performing a linear S.H.M. ?
View Solution
Knowledge Check
The graph between total energy and displacement of a particle performing S.H.M. is
AparabolaBstraight lineCellipseDcircleThe graph between kinetic energy and displacement of a particle performing S.H.M. is
AparabolaBstraight lineCellipseDcircleThe graph between instantaneous velocity and displacement of a particle performing S.H.M.with period 2πsecorω=1 is
AparabolaBstraight lineCellipseDcircle
Kinetic energy of a particle performing S.H.M.
View SolutionThe amplitude of particle performing S.H.M. is
View SolutionWhat is the relation between the potential energy and total energy (E ) of a particle performing a S.H.M., when it is at half way between the mean and extreme positions ?
View SolutionKinetic energy of the particle performing S.H.M. is
View SolutionThe graph between velocity and displacement of a particle executing S.H.M. of angular frequency 1 rad/s can be (where A is the amplitude of displacement)
View Solution

