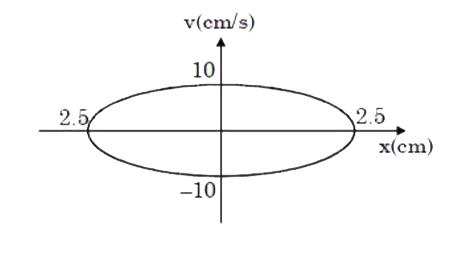
The graph between total energy and displacement of a particle performing S.H.M. is
A
parabola
B
straight line
C
ellipse
D
circle
Video Solution
Text Solution
The correct Answer is:B
|
Answer
Step by step video, text & image solution for The graph between total energy and displacement of a particle performing S.H.M. is by Physics experts to help you in doubts & scoring excellent marks in Class 12 exams.
Updated on:21/07/2023Topper's Solved these Questions
Similar Questions
Knowledge Check
The graph between potential energy and displacement of a particle performing S.H.M. is
AparabolaBstraight lineCellipseDcircleThe graph between kinetic energy and displacement of a particle performing S.H.M. is
AparabolaBstraight lineCellipseDcircleThe graph between instantaneous velocity and displacement of a particle performing S.H.M.with period 2πsecorω=1 is
AparabolaBstraight lineCellipseDcircle
The graph between velocity and displacement of a particle executing S.H.M. of angular frequency 1 rad/s can be (where A is the amplitude of displacement)
View SolutionKinetic energy of a particle performing S.H.M.
View SolutionThe amplitude of particle performing S.H.M. is
View SolutionWhat is the nature of the graph between the potential energy and total energy of a particle performing a linear S.H.M. ?
View SolutionKinetic energy of the particle performing S.H.M. is
View Solution


