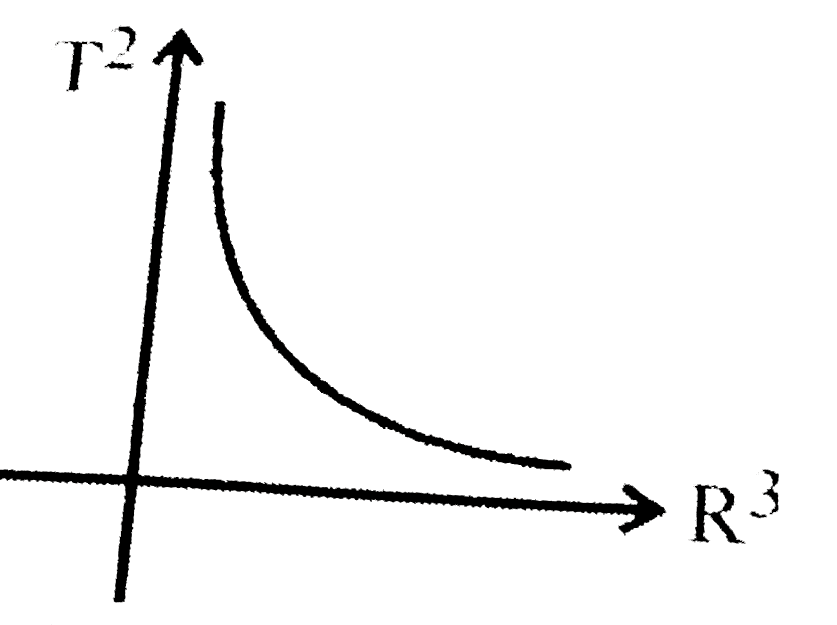
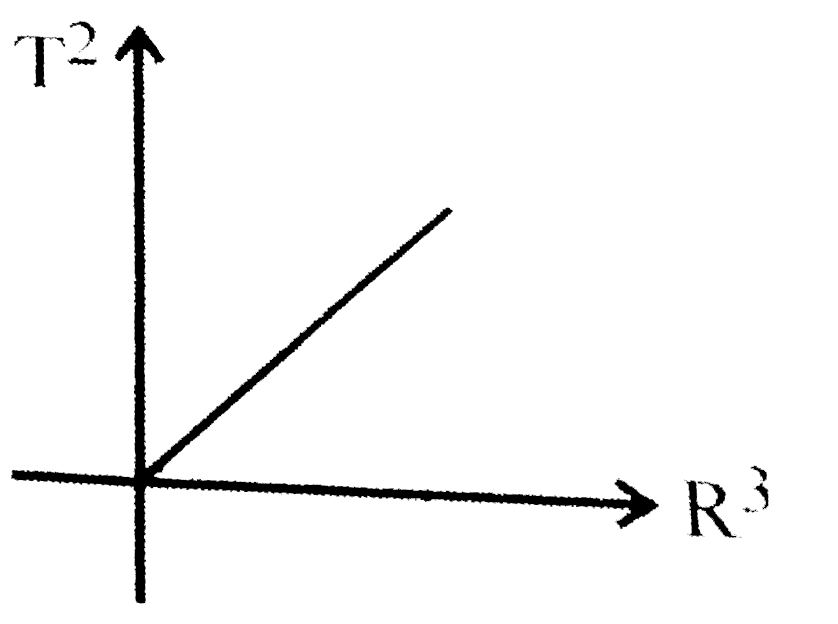
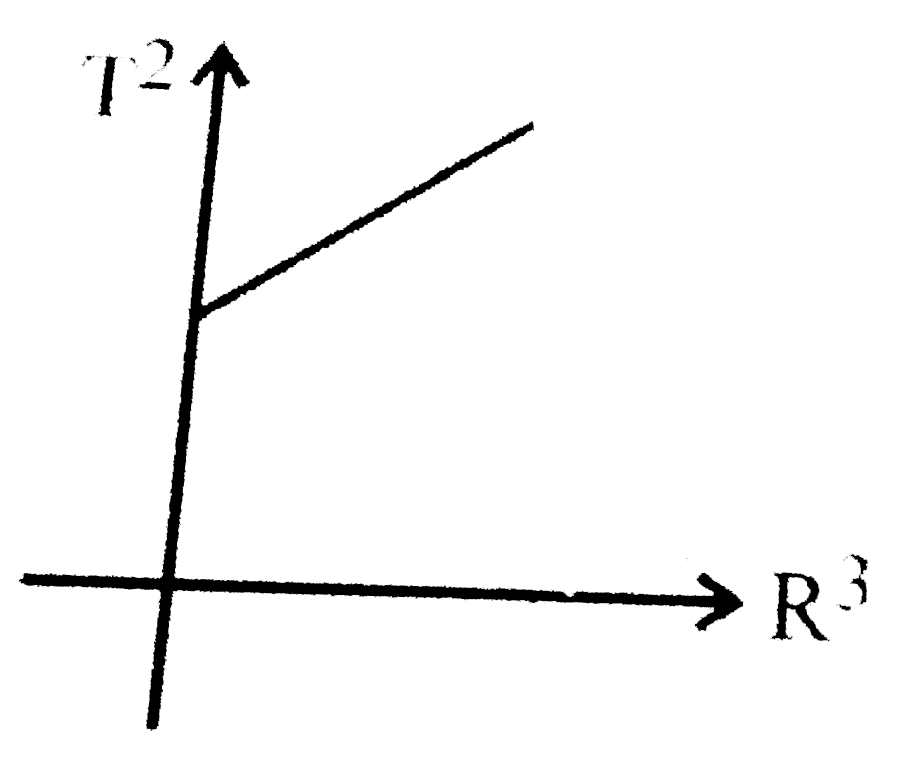
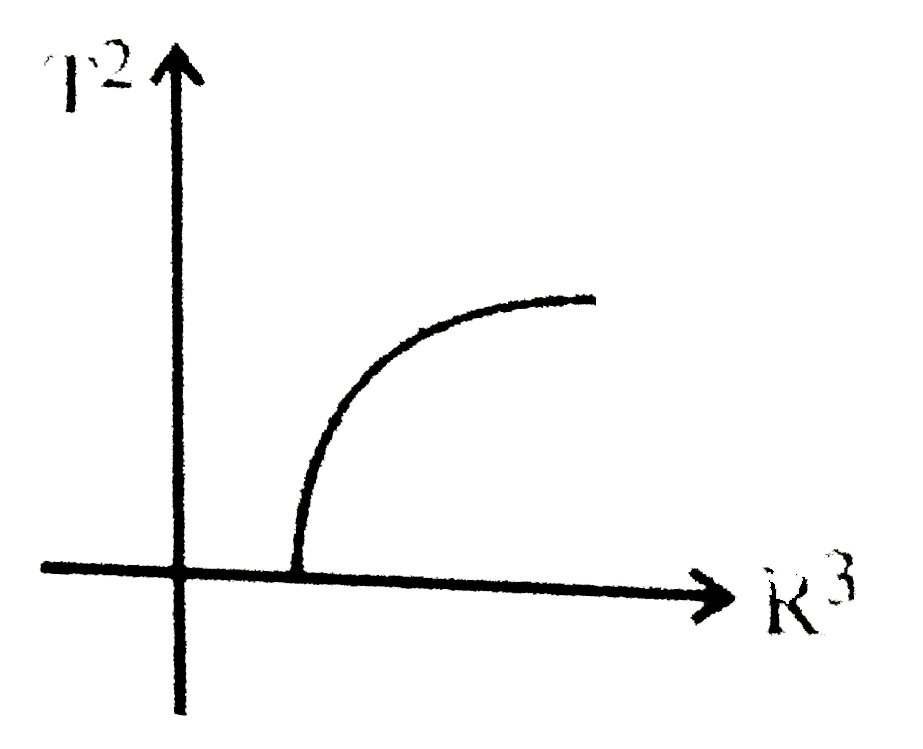
Which of the following graph depicts relation between time period (T) and radius of orbit (r) of a planet ?
A
B
C
D
Video Solution
Text Solution
The correct Answer is:B
For a satellite T2∝R3 (Kepler's law)
∴ The graph of T2 against R3 is a straight line passing through the origin.
|
Topper's Solved these Questions
- GRAVITATION Book:MARVEL PUBLICATIONChapter:GRAVITATION Exercise:TEST YOUR GRASP -2
Explore 20 Videos
- ELECTROSTATICSBook:MARVEL PUBLICATIONChapter:ELECTROSTATICSExercise:TEST YOUR GRASP
Explore 20 Videos
- INTERFERENCE AND DIFFRACTIONBook:MARVEL PUBLICATIONChapter:INTERFERENCE AND DIFFRACTIONExercise:TEST YOUR GRASP
Explore 20 Videos
Similar Questions
Knowledge Check
Relation between time period (T) and frequency (V)
AV=1TBV=TCV=1T2DVT=1Which of the following graphs between the square of the time period and cube of the distance of the planet from the sun is correct ?
A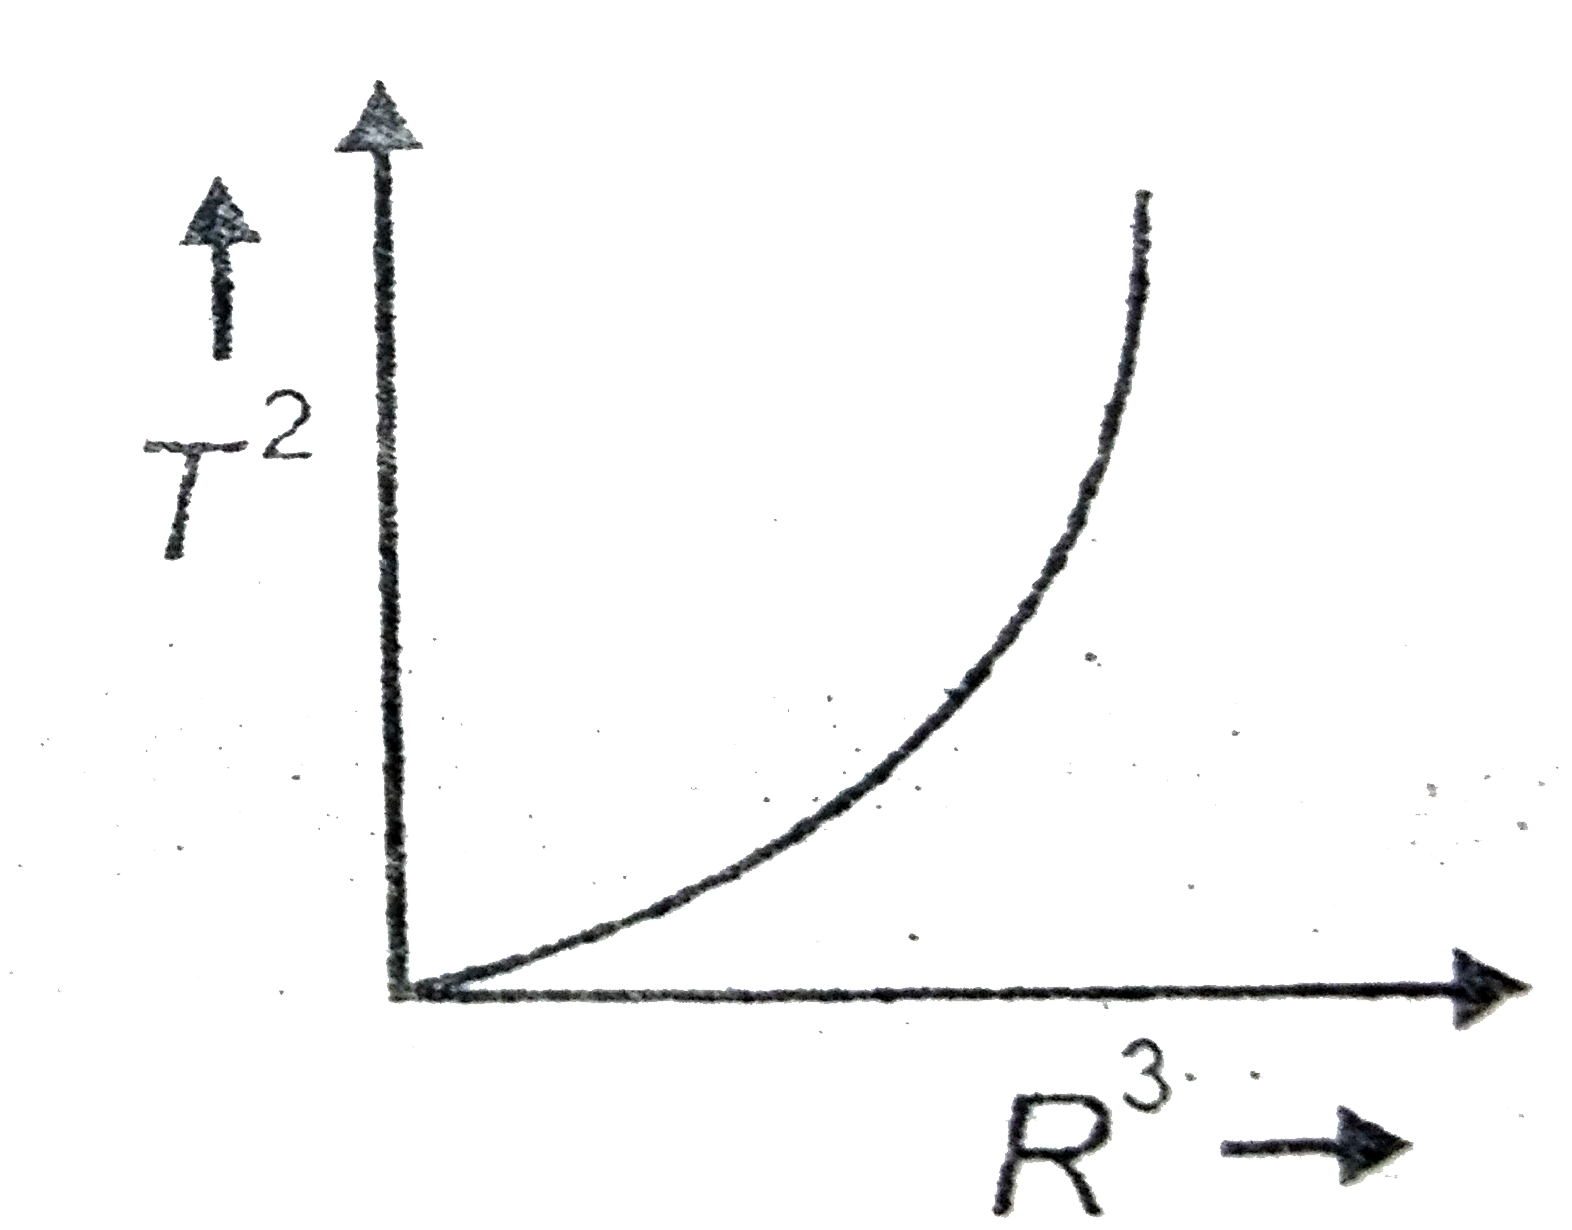 B
B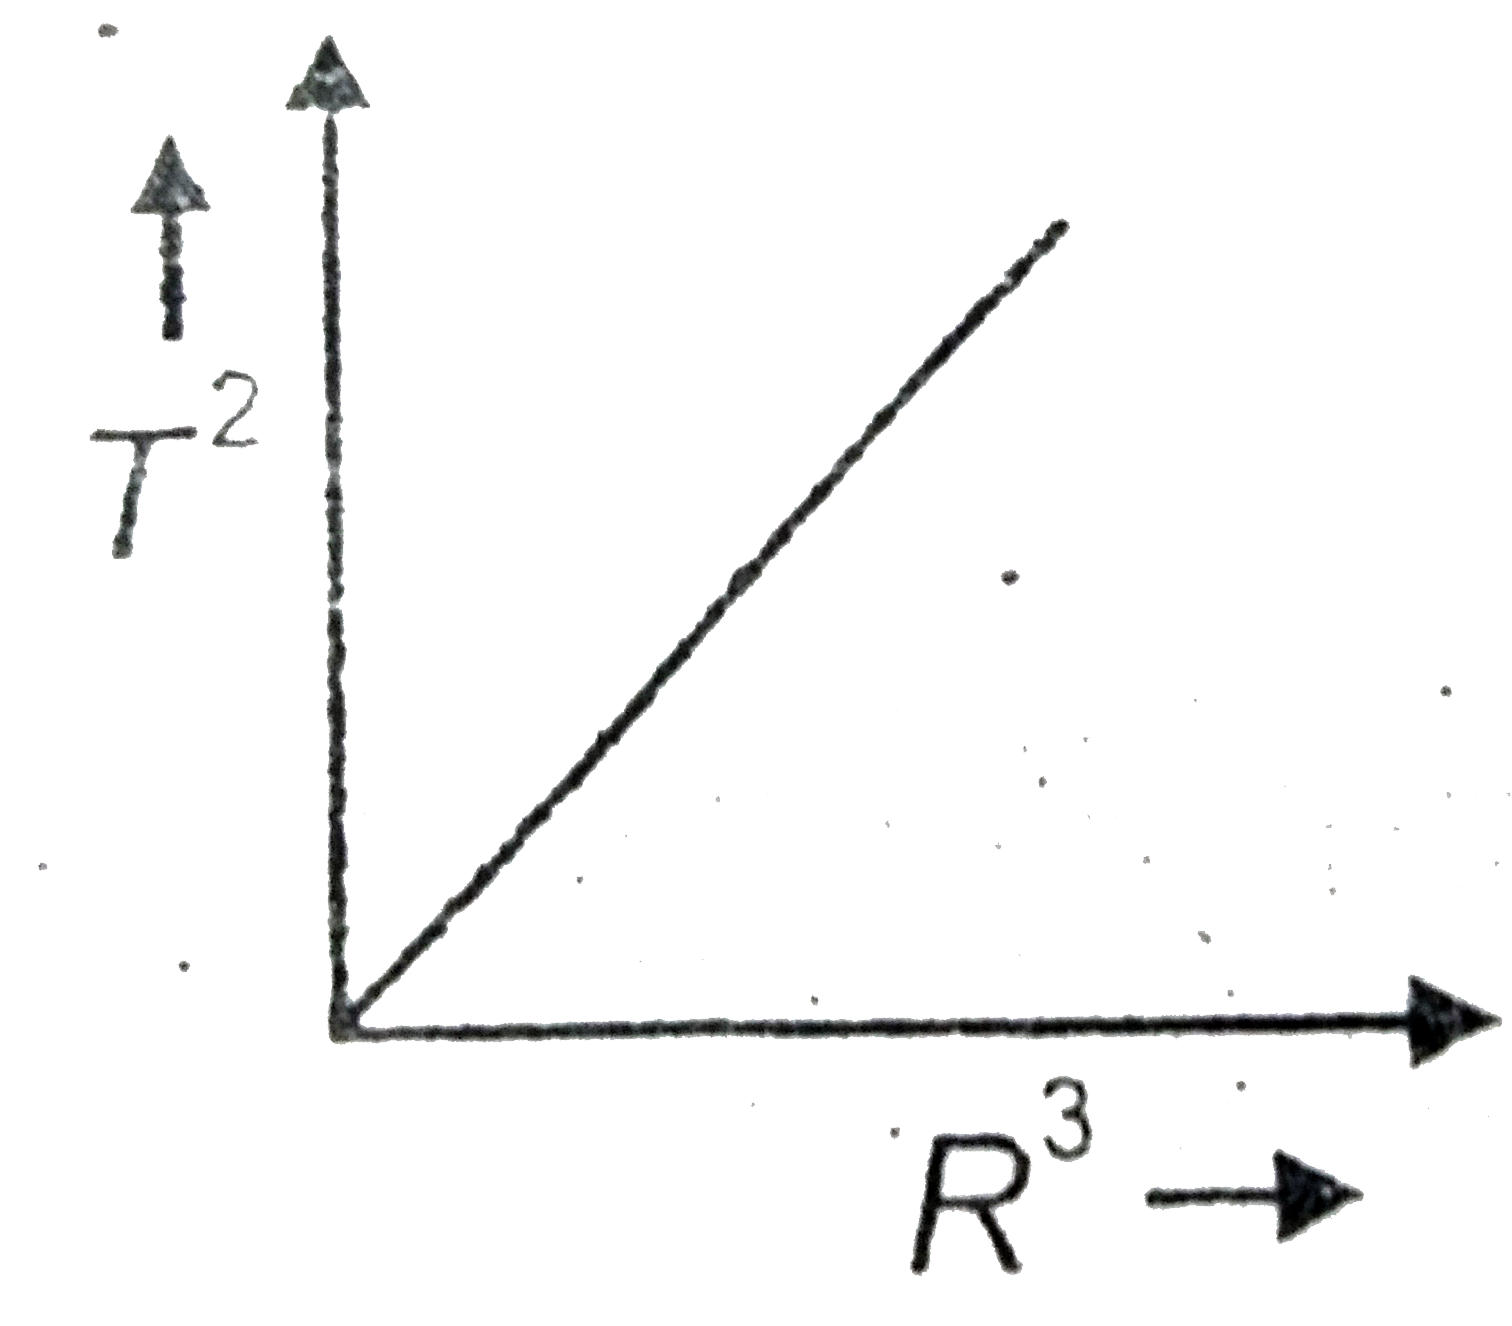 C
C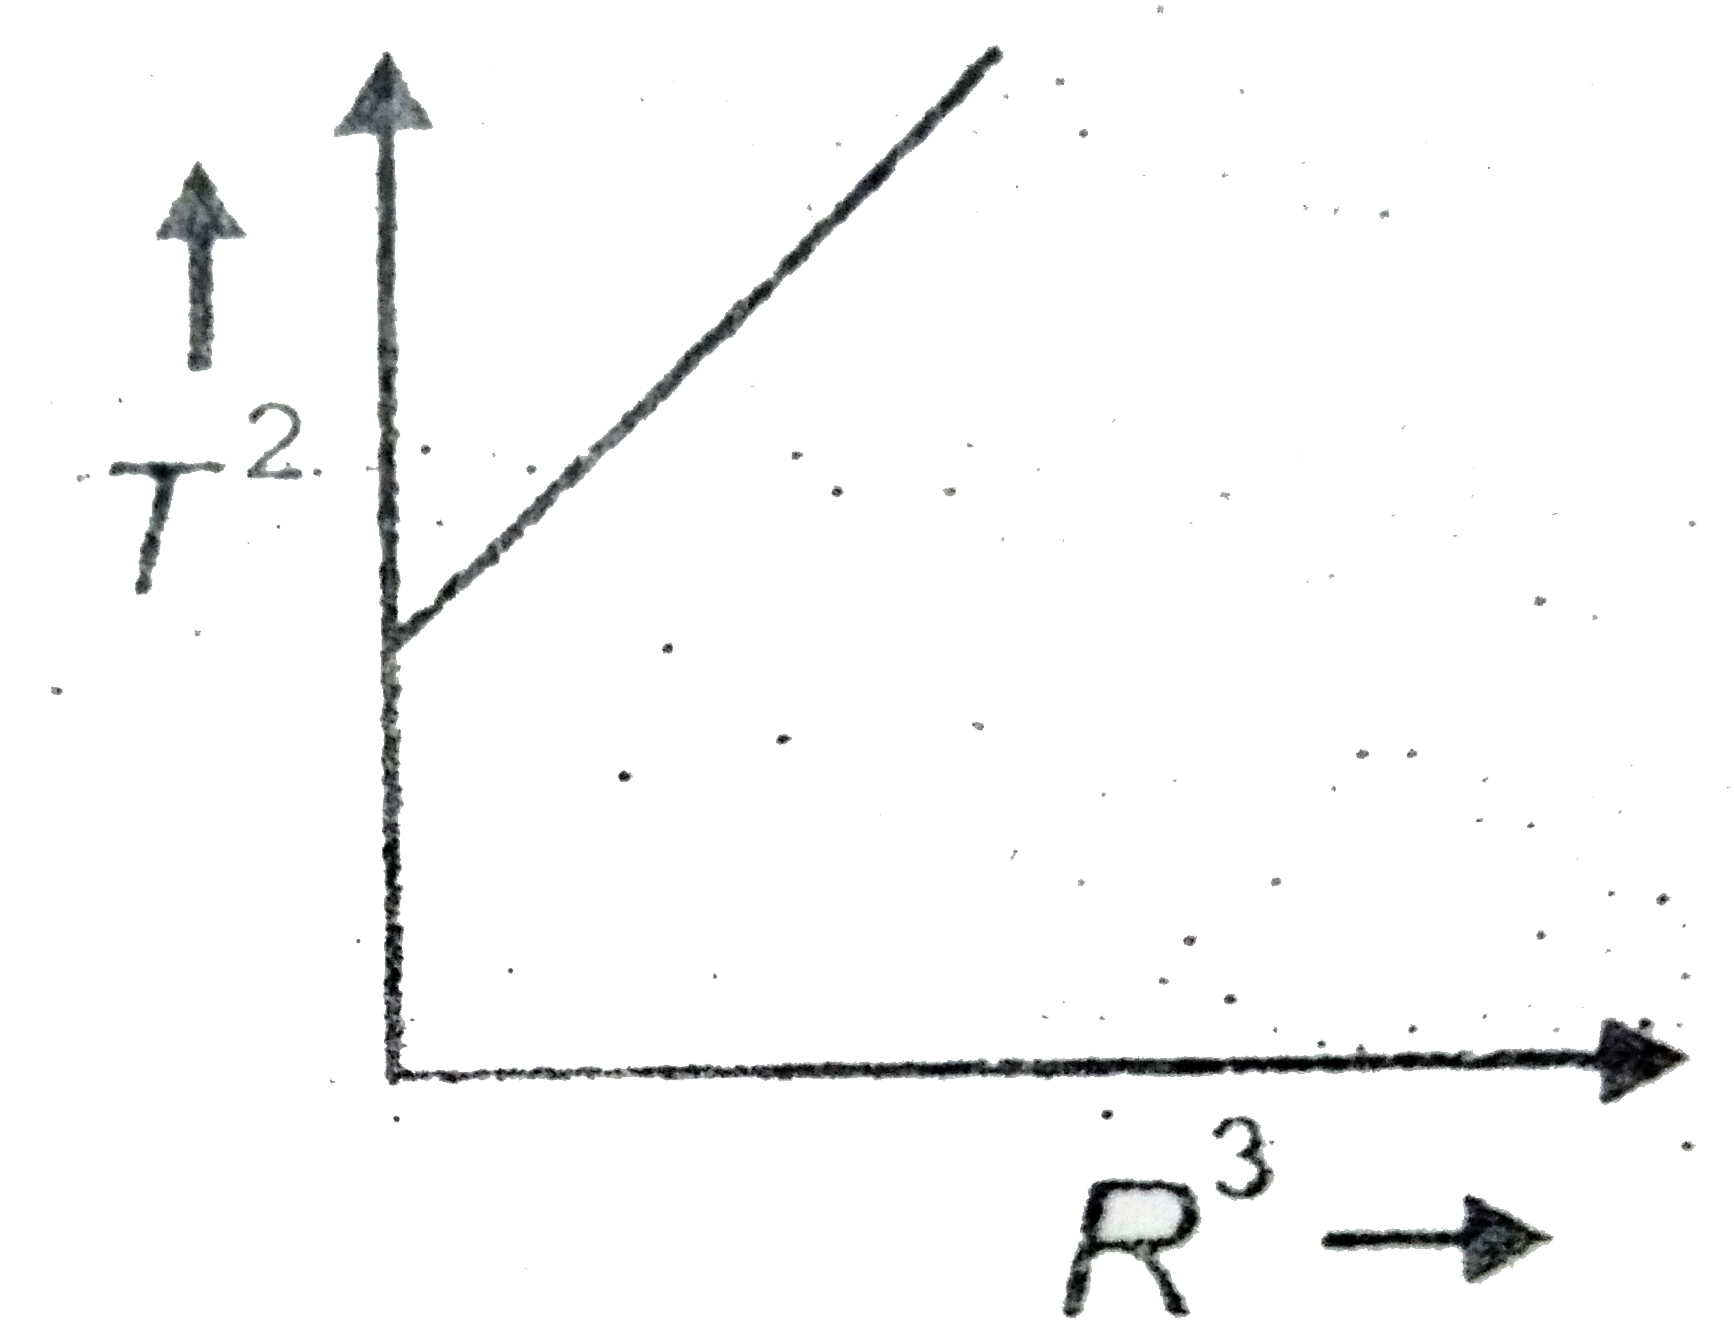 D
D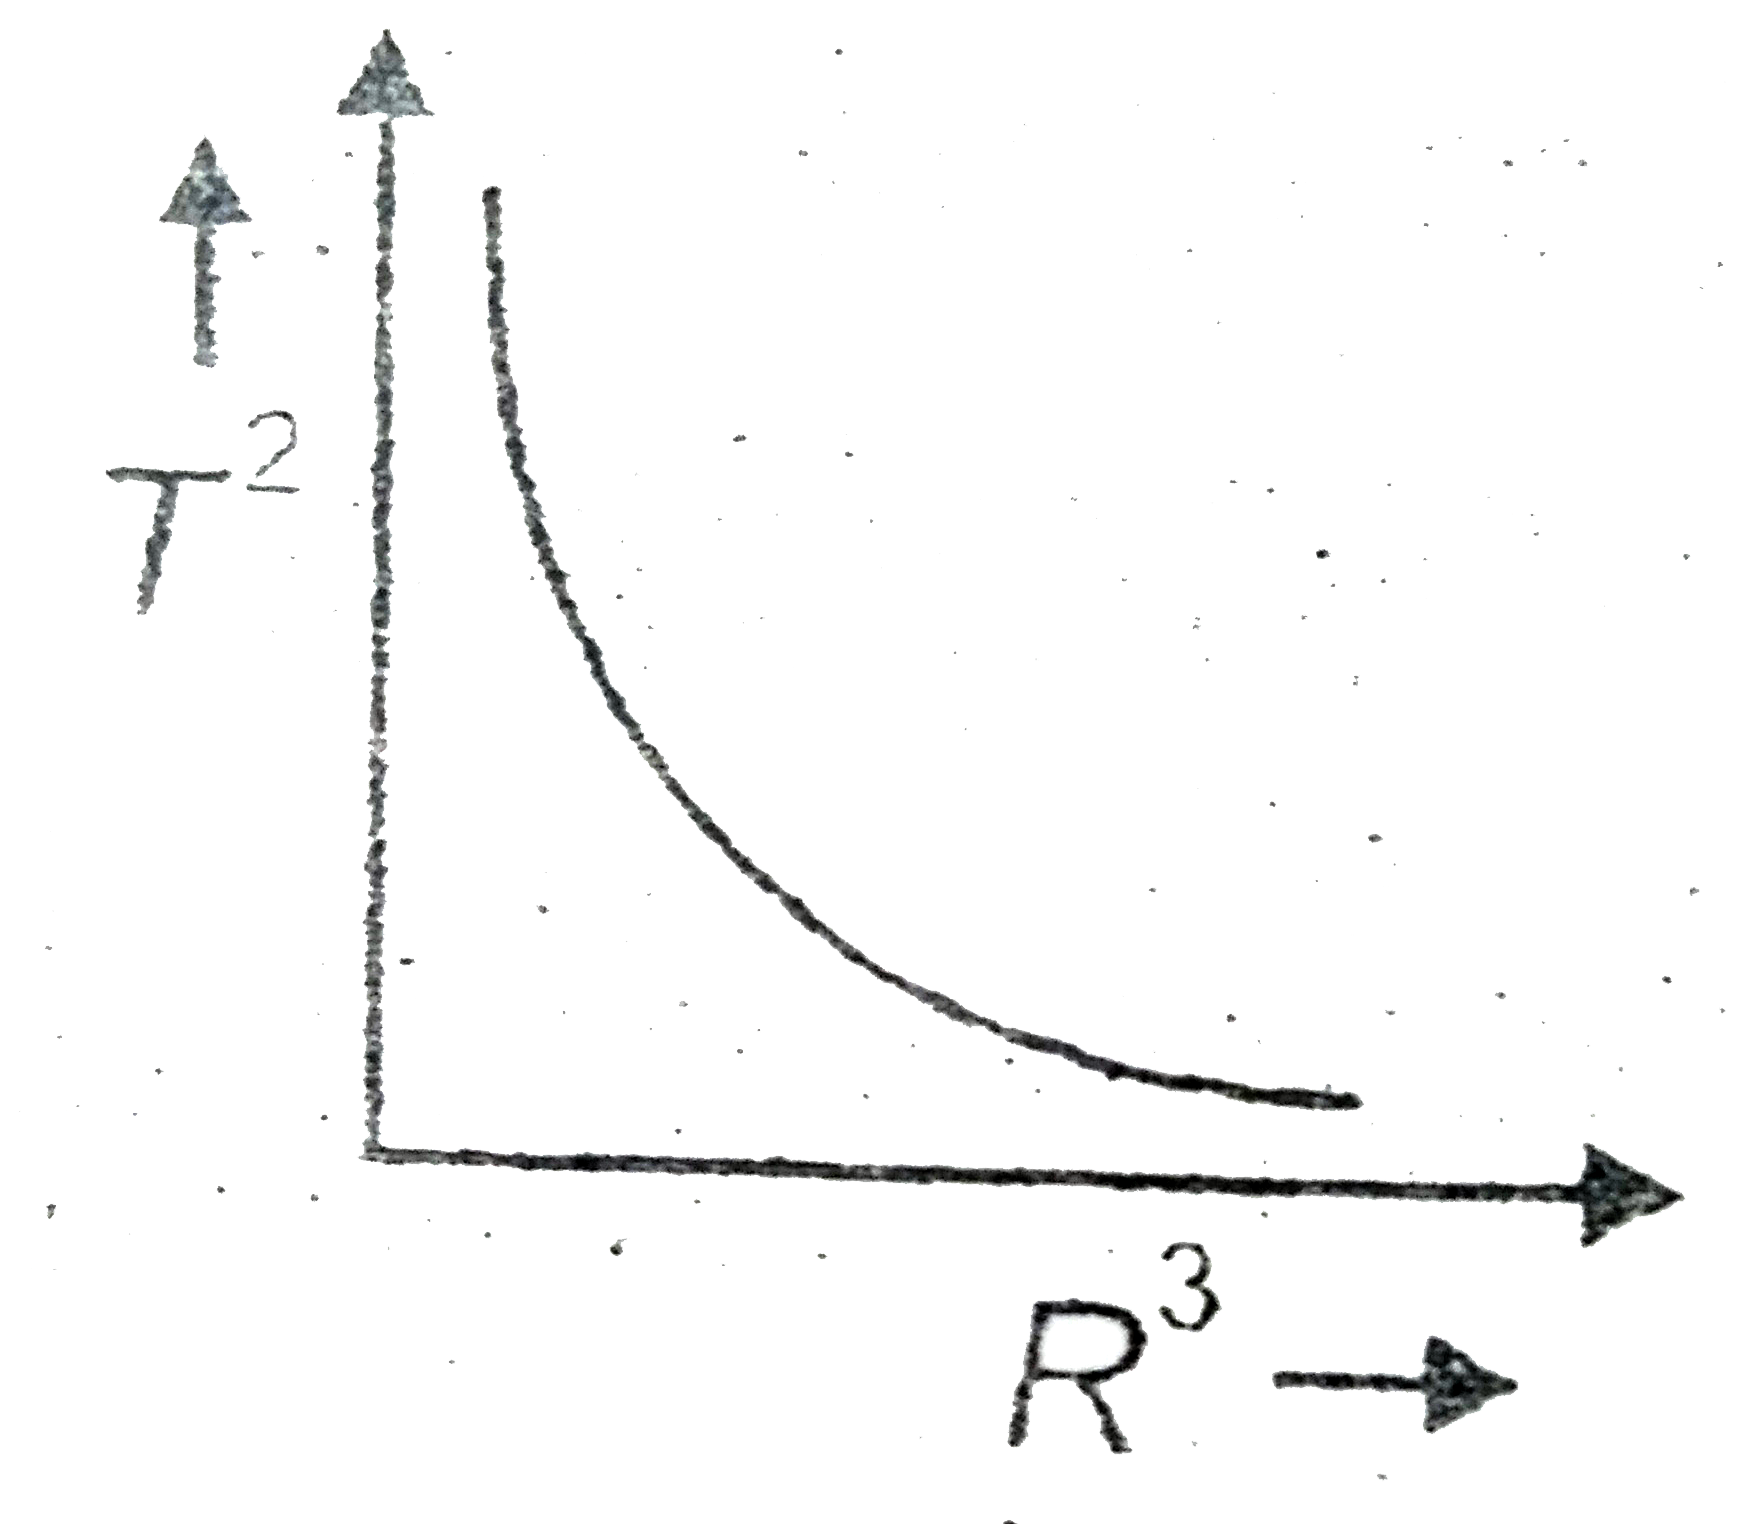
Which of the following graphs may represent the relation between capillary rise h and the radius r of the capillary
A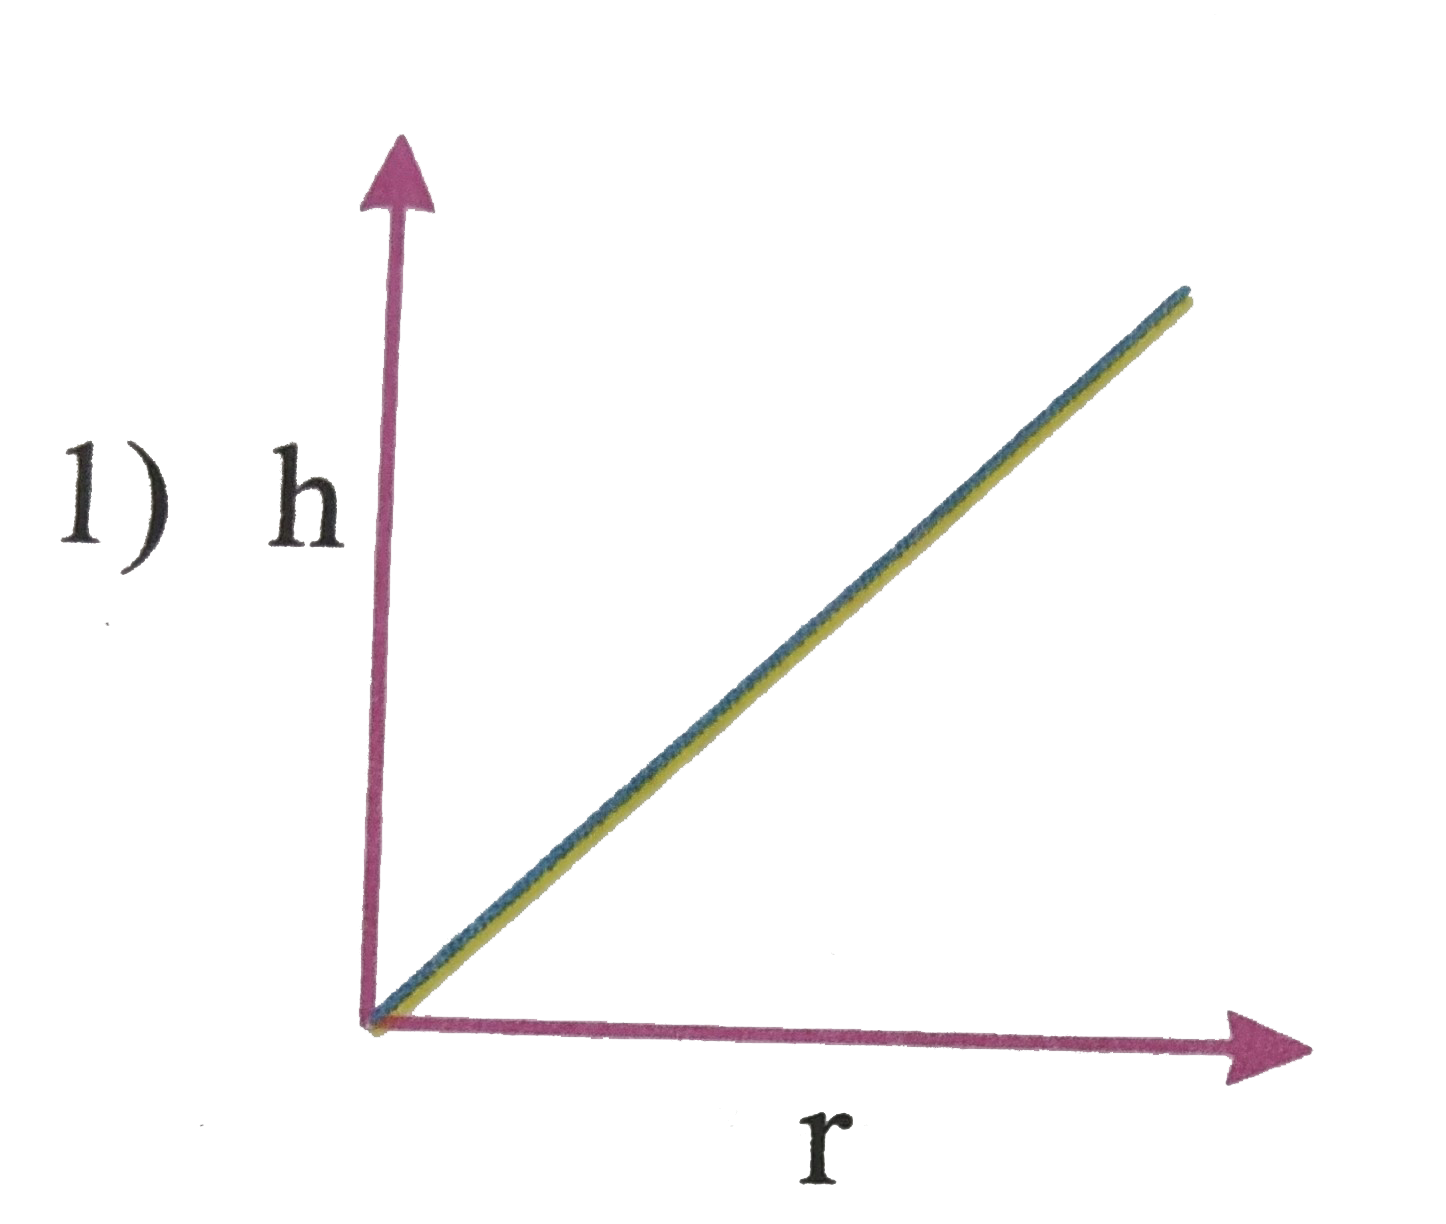 B
B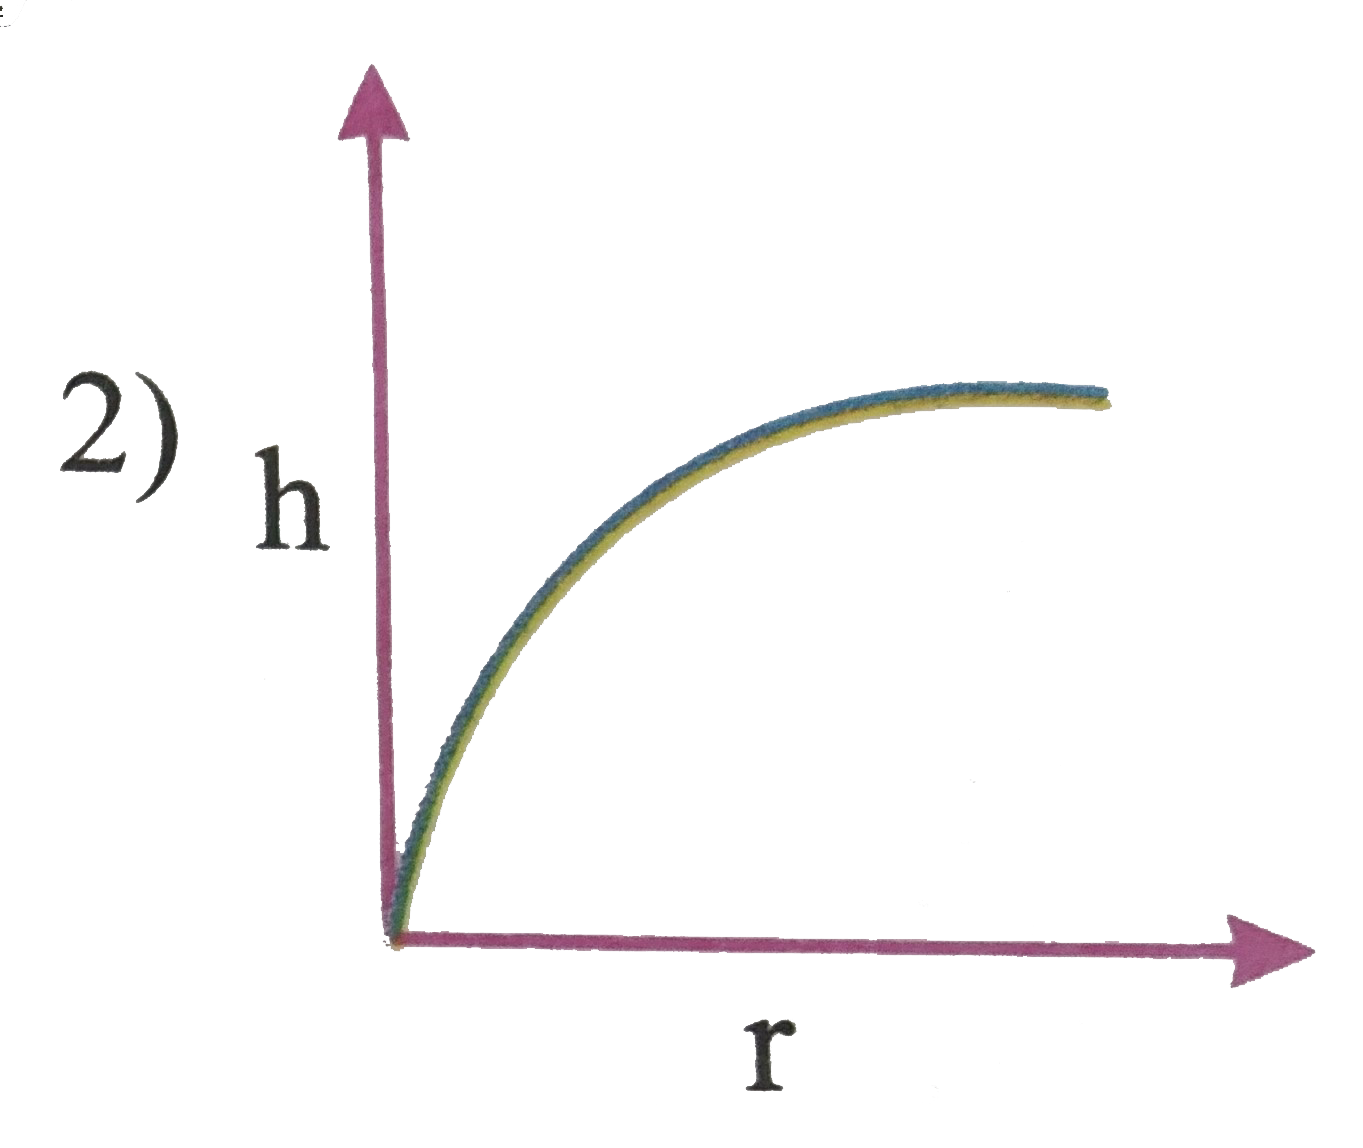 C
C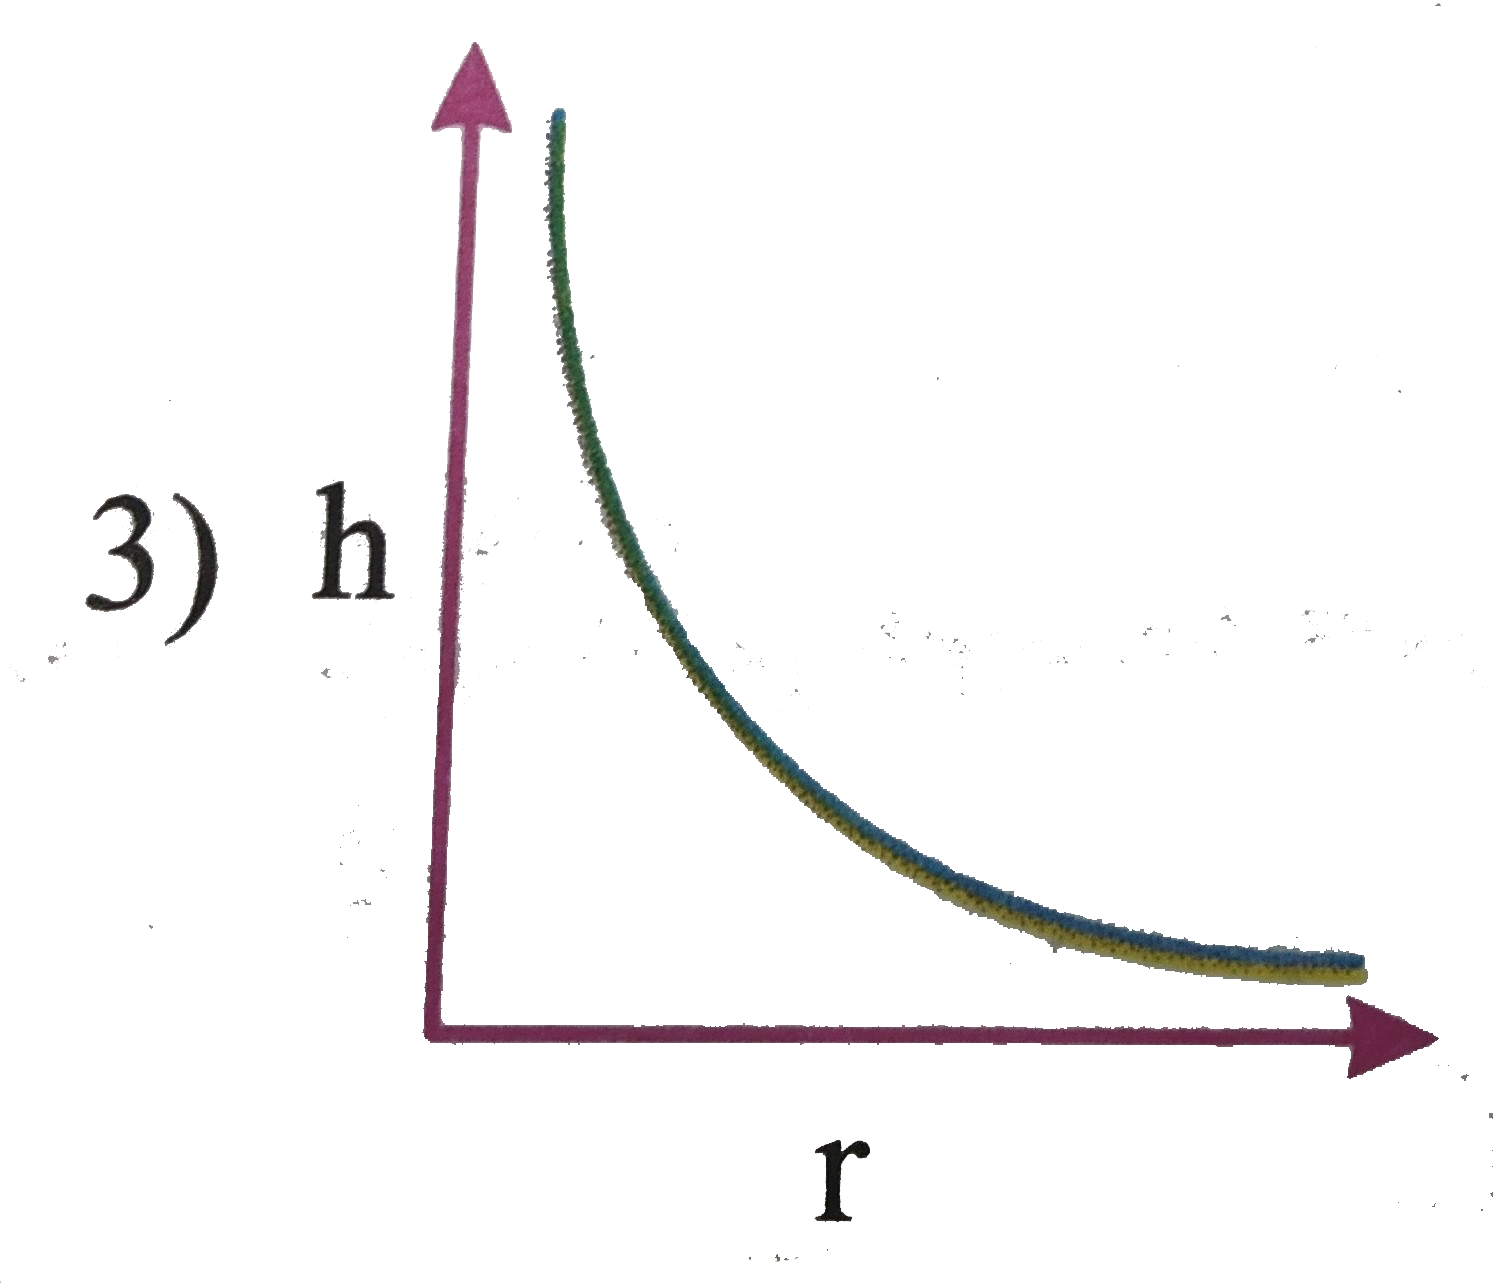 D
D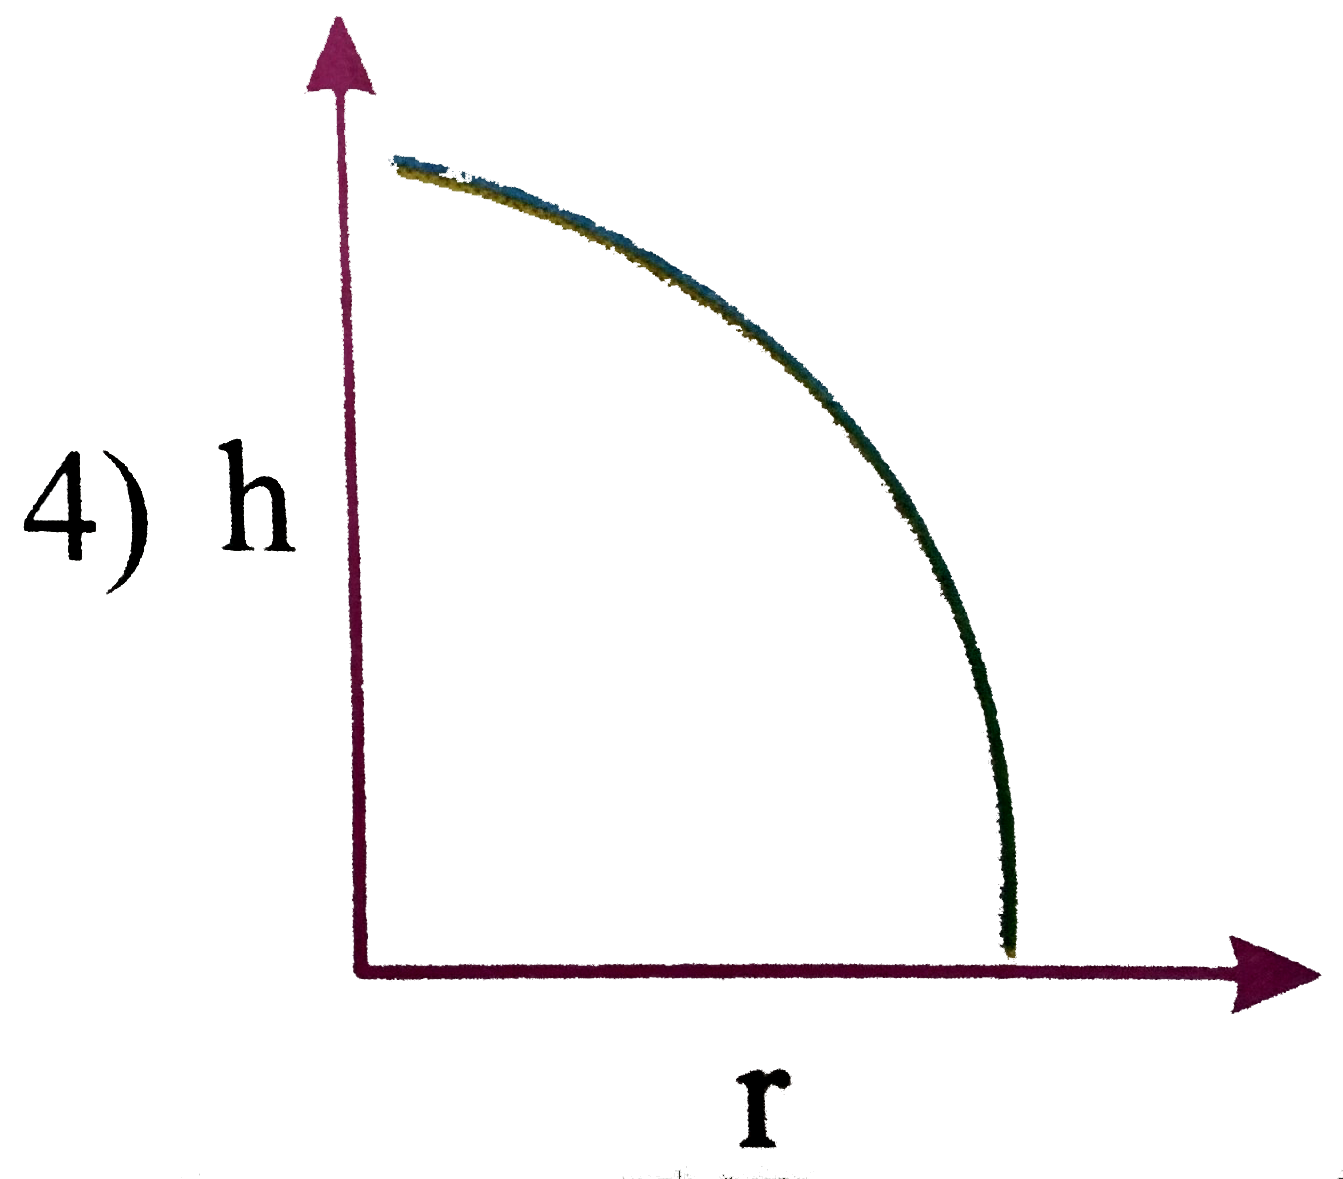
If P to T are second period p-block elements then which of the following graph show corrrect relation between valence electrons in P2→T2
View SolutionThe graph between time period (T) and length (l) of a simple pendulum is
View SolutionWhich one of the relation is correct between time period and number of orbits while an electron is revolving in a orbit
View SolutionThe relation between radius of third orbit r3 and radius of first orbit r1 in hydrogen atom would be
View SolutionWhich of the following graphs represents the motion of the planet moving about the Sun. T is the periode of revolution and r is the average distance (from centre to centre) between the sun and the planet
View Solution
