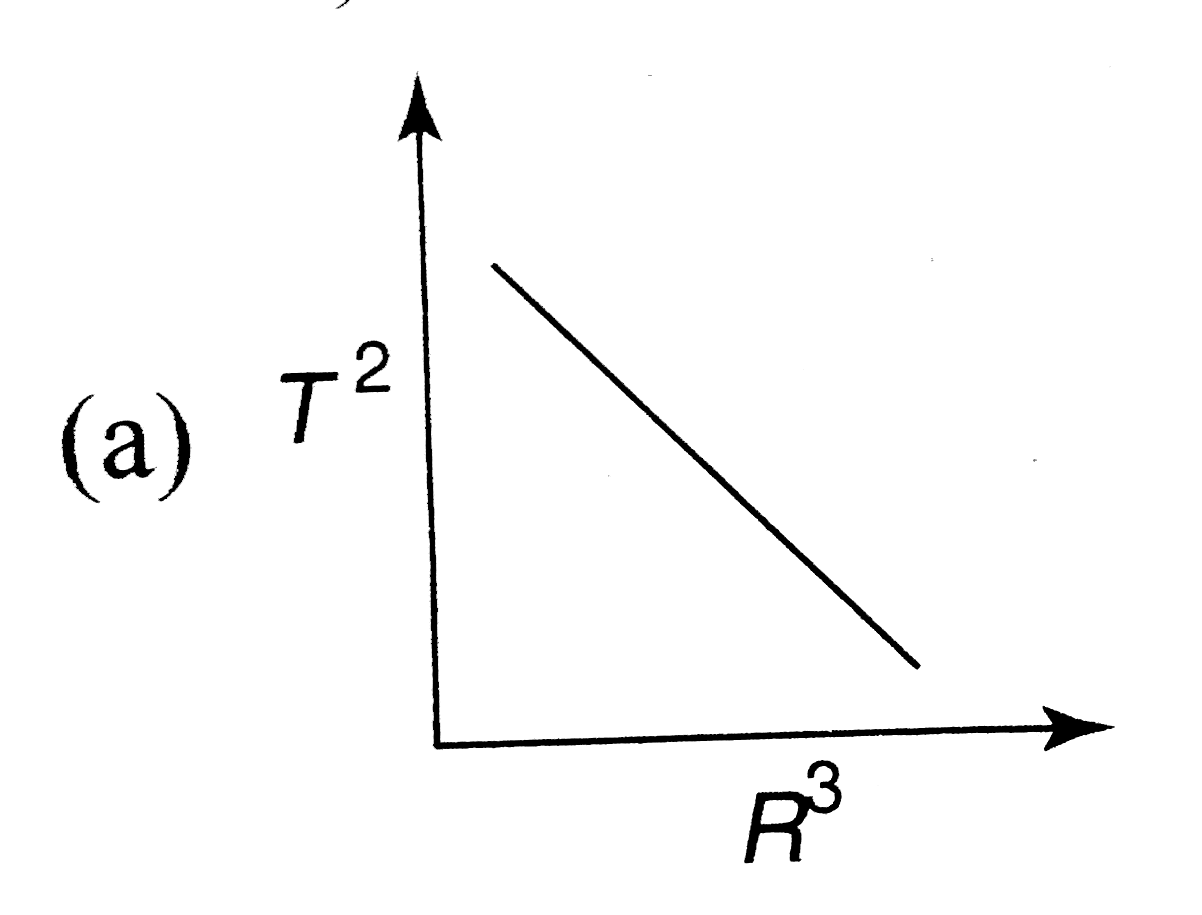
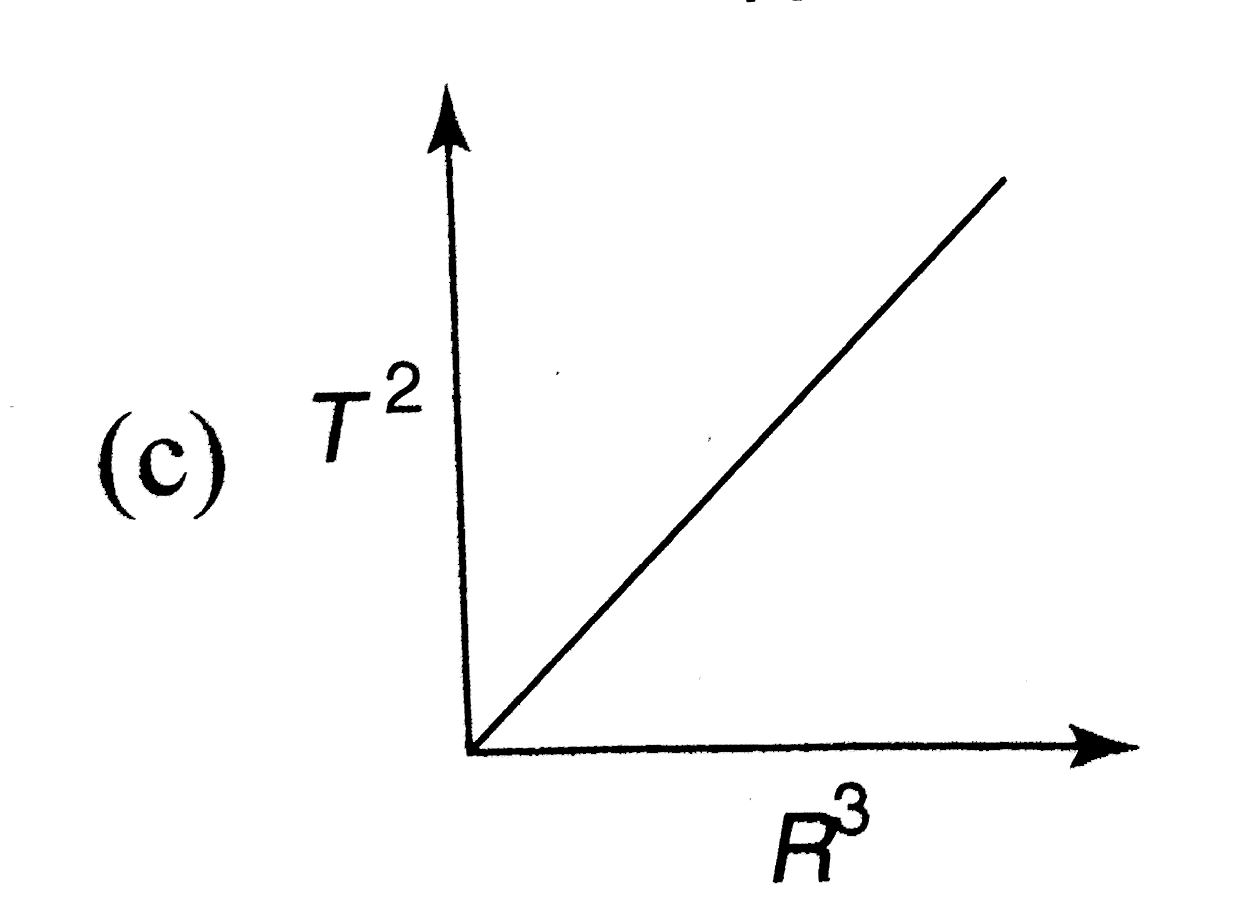
Which of the following graphs represents the motion of the planet moving about the Sun. T is the periode of revolution and r is the average distance (from centre to centre) between the sun and the planet


The correct Answer is:C
To solve the problem of determining which graph represents the motion of a planet moving about the Sun, we can follow these steps:
1. Understand the Relationship: We know from Kepler's Third Law of Planetary Motion that the square of the period of revolution (T) of a planet is directly proportional to the cube of the average distance (r) from the Sun. This can be mathematically expressed as:
T2∝r3
2. Convert to Equation Form: To express this relationship in a more usable form, we can introduce a constant of proportionality (k):
T2=k⋅r3
3. Identify Variables: In this equation, T2 is the dependent variable (y-axis), and r3 is the independent variable (x-axis).
4. Graph Characteristics: The equation T2=k⋅r3 can be rearranged to fit the linear equation format y=mx+b, where:
- y=T2
- x=r3
- m=k (the slope)
- b=0 (the y-intercept)
5. Conclusion on the Graph: Since the equation represents a straight line that passes through the origin (0,0), the graph of T2 versus r3 will be a straight line with a slope k and no y-intercept.
6. Select the Correct Option: Based on the characteristics of the graph we derived, we need to identify which of the provided options matches this description. The correct graph will be a straight line passing through the origin.
Final Answer:
The correct answer is Option C, which represents a straight line graph passing through the origin, indicating the relationship T2=k⋅r3.
T2∝r3
T2=k⋅r3
- y=T2
- x=r3
- m=k (the slope)
- b=0 (the y-intercept)
The correct answer is Option C, which represents a straight line graph passing through the origin, indicating the relationship T2=k⋅r3.
Topper's Solved these Questions
- GRAVITATIONBook:A2ZChapter:GRAVITATIONExercise:Gravitational Field And Acceleration Due To Gravity
Explore 34 Videos
- GRAVITATIONBook:A2ZChapter:GRAVITATIONExercise:Gravitational Potential, Energyand Escape Velocity
Explore 32 Videos
- GENERAL KINEMATICS AND MOTION IN ONE DIMENSIONBook:A2ZChapter:GENERAL KINEMATICS AND MOTION IN ONE DIMENSIONExercise:Chapter Test
Explore 30 Videos
- KINETIC THEORY OF GASES AND THERMODYNAMICSBook:A2ZChapter:KINETIC THEORY OF GASES AND THERMODYNAMICSExercise:Chapter Test
Explore 29 Videos
Similar Questions
Knowledge Check
Which of the following is not a planet of the Sun ?
ASiriusBMercuryCSaturnDEarthWhich of the following planet is farthest from Sun?
ASaturnBJupiterCNeptuneDUranusWhich of the following is the farthest planet to the Sun?
AMarsBJupiterCVenusDEarth
Which of the following is not a planet of the Sun ?
View SolutionWhich of the following is NOT a planet of the sun?
View SolutionThe torque on a planet about the centre of sun is
View SolutionWhich of the following graphs between the square of the time period and cube of the distance of the planet from the sun is correct ?
View SolutionIf r denotes the mean distance of a planet from the sun and T is the time period of planet, then
View Solution

