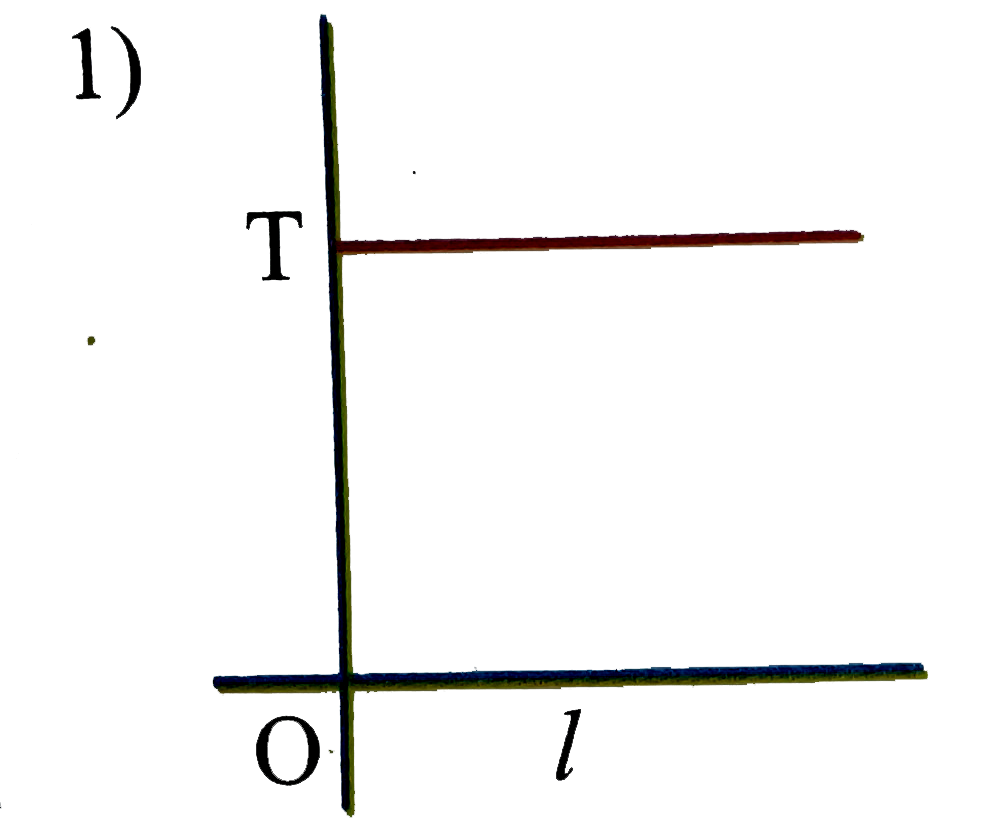
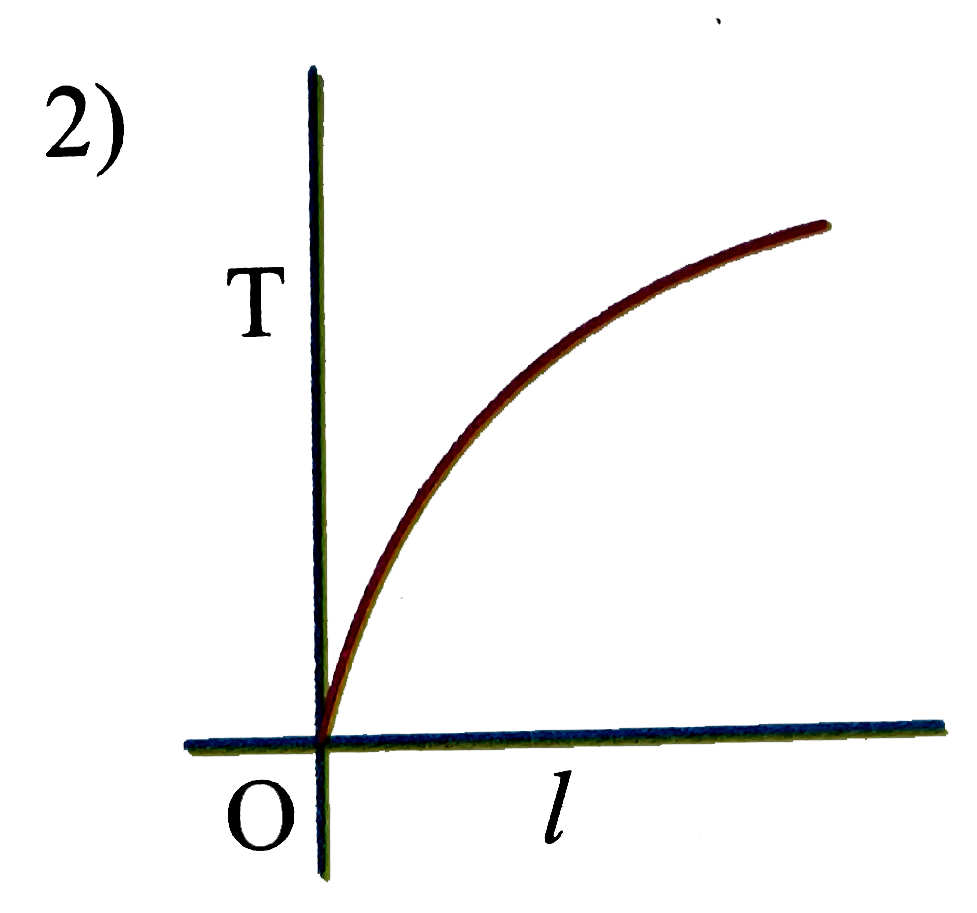
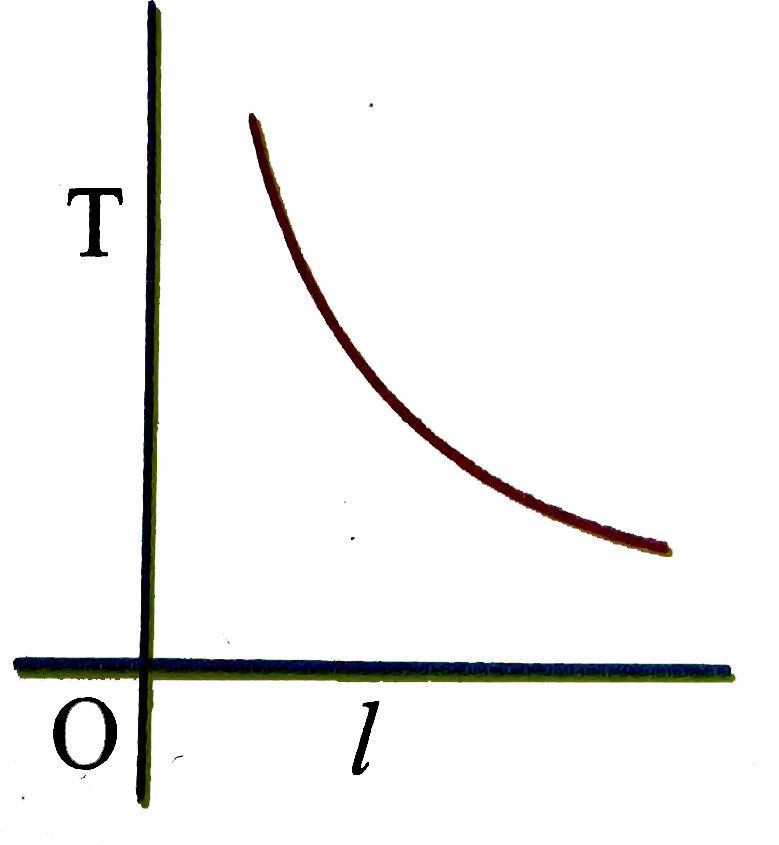
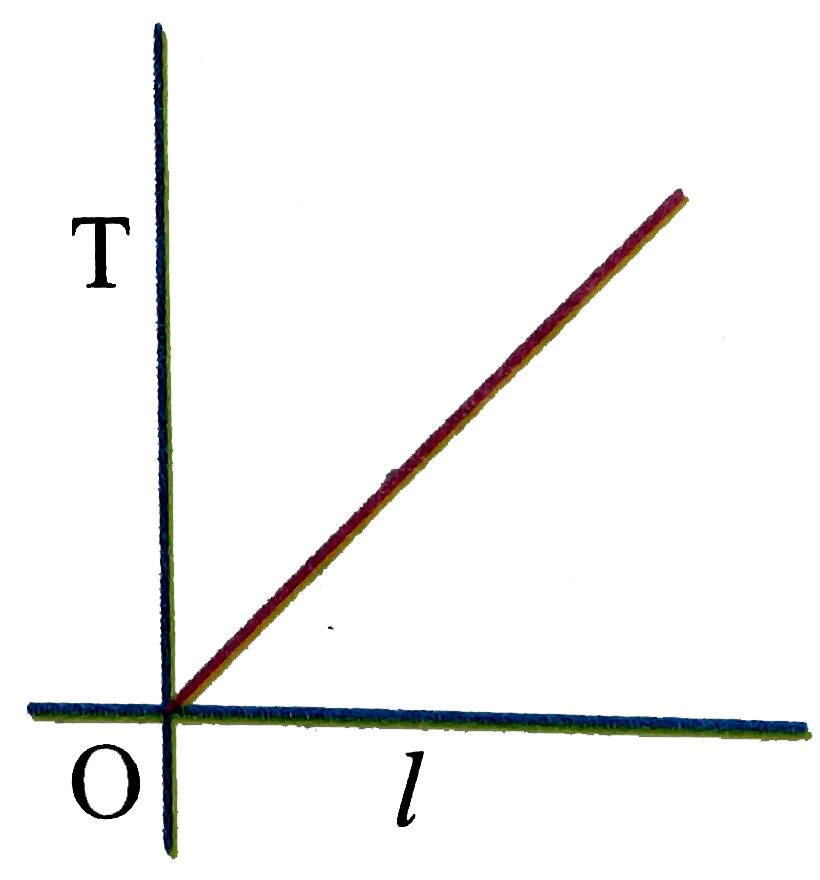
The graph between time period (T) and length (l) of a simple pendulum is


The correct Answer is:B
Step by step video, text & image solution for The graph between time period (T) and length (l) of a simple pendulum is by Physics experts to help you in doubts & scoring excellent marks in Class 12 exams.
Updated on:21/07/2023Topper's Solved these Questions
- EXPERIMENTAL PHYSICSBook:NARAYNAChapter:EXPERIMENTAL PHYSICSExercise:Level-v(Single answer)
Explore 23 Videos
- EXPERIMENTAL PHYSICSBook:NARAYNAChapter:EXPERIMENTAL PHYSICSExercise:Multiple answer
Explore 6 Videos
- ELECTROSTATICS AND GAUSS LAWBook:NARAYNAChapter:ELECTROSTATICS AND GAUSS LAWExercise:Intergers type question
Explore 11 Videos
- MAGNETISMBook:NARAYNAChapter:MAGNETISMExercise:LEVEL-II (H.W)
Explore 24 Videos
Similar Questions
Knowledge Check
What is the relation between the period TsandTe of a simple pendulum and a conical pendulum respectively, if they have the same length ?
ATe=TsBTe>TsCTe/2TsDTe<TsThe graph between the length and square of the period of a simple pendulum is a
AcircleBparabolaCstraight lineDhyperbolaTime period of simple pendulum is
AT=2π√lgBT=2π√glCT=√2πlgDT=12π√gl
What is the time period of a simple pendulum if length of the pendulum is equal to the radius of Earth ?
View SolutionWhat is a simple pendulum? Find an expression for the time period and frequency of a simple pendulum.
View SolutionThe graph of l against T for a simple pendulum is
View SolutionThe error in the measurement of length (L) of time simple pendulum is 0.1% and the error in the period (T) is 3%. The maximum possible error in the measurement of LT2 is
View SolutionThe graph of time period (T) of simple pendulum versus its length (l) is
View Solution

