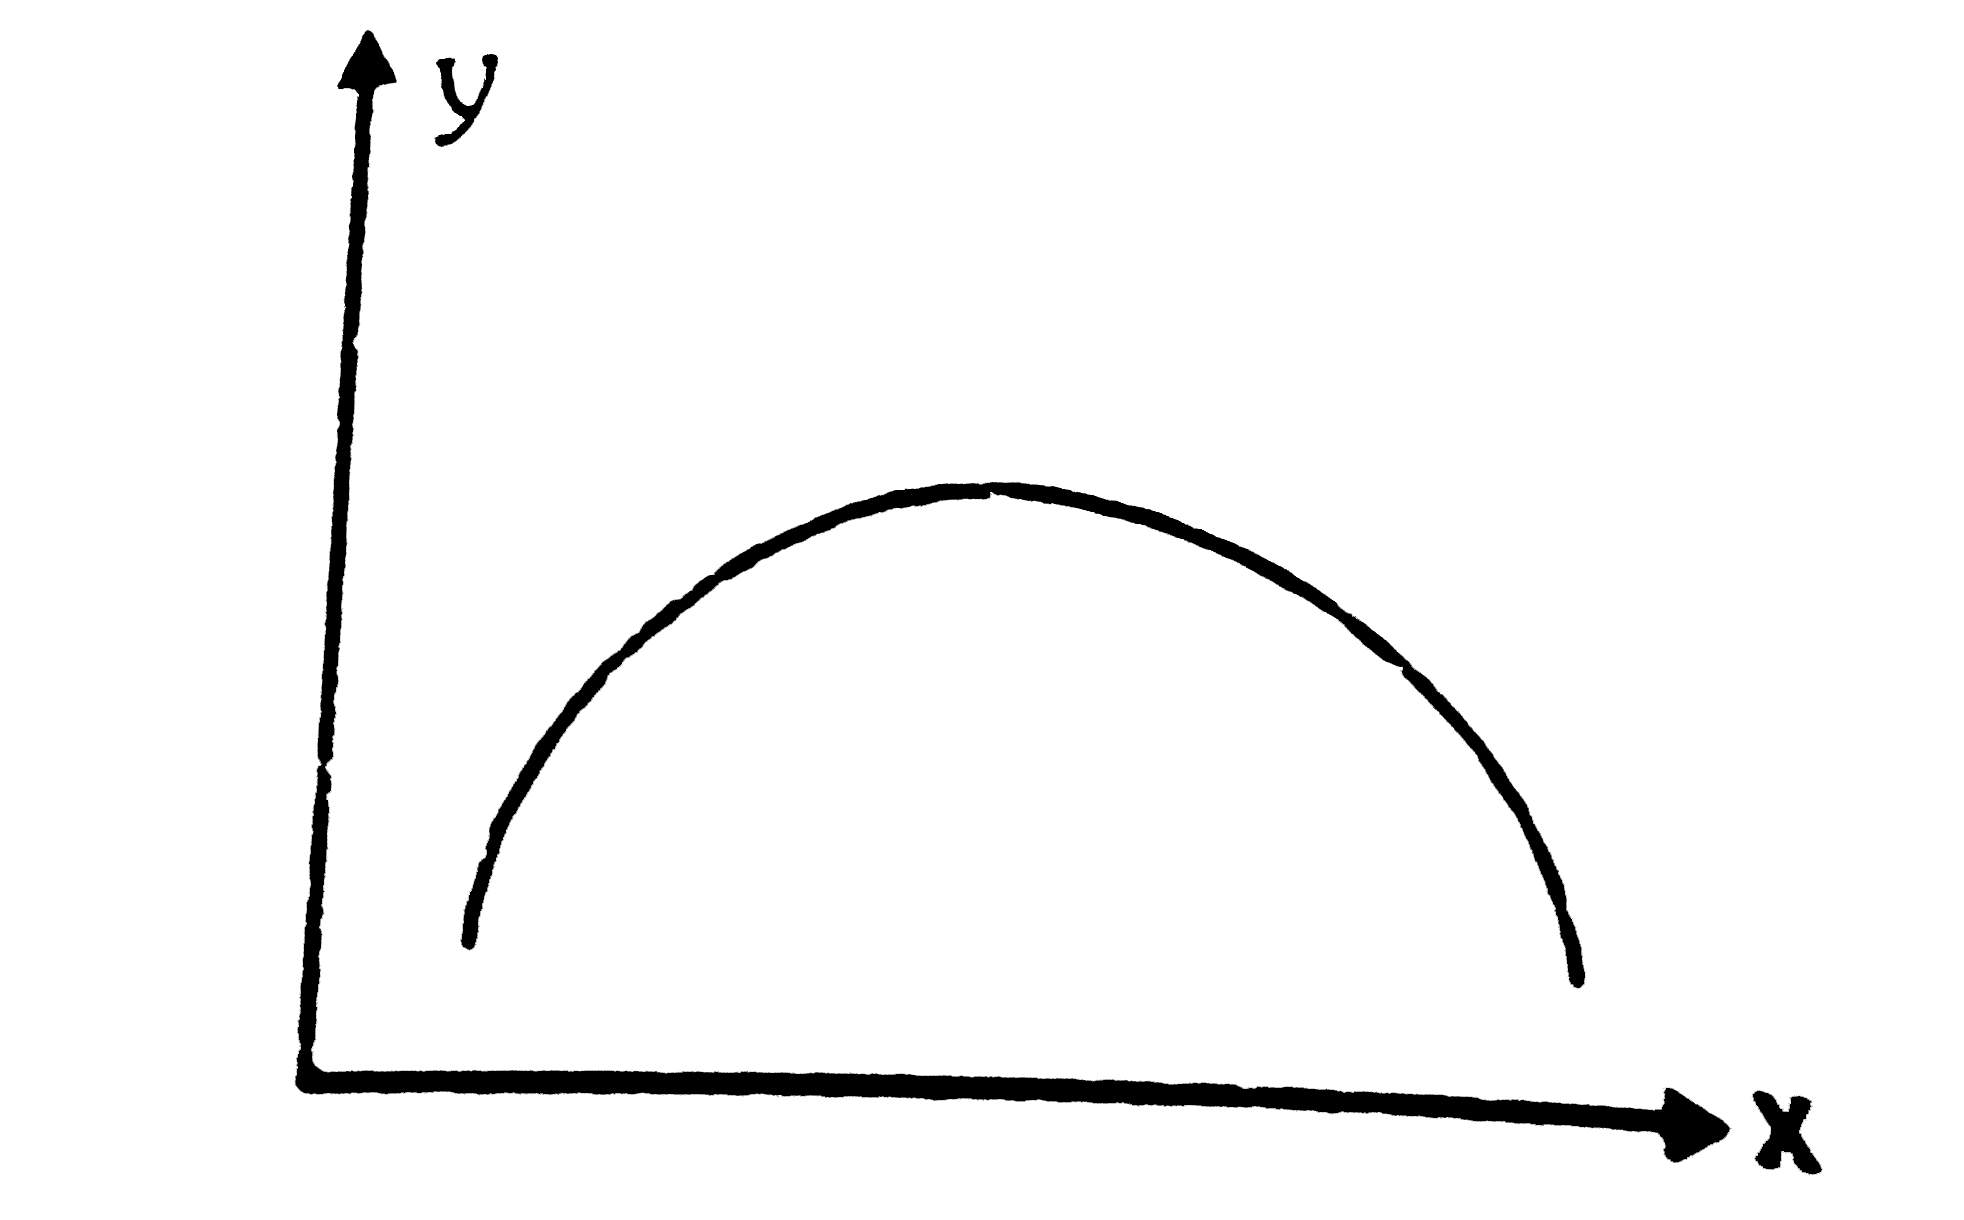
For a planet, the graph of T2 against r3 is plotted. The slope of the graph is
4πGM
4π2GM
GM4π2
GM4π
The correct Answer is:B
The graph of T2 against r3 is a straightline.
∵T2=4π2r3GM∴T2r3= Slope =4π2GM
Topper's Solved these Questions
- GRAVITATION Book:MARVEL PUBLICATIONChapter:GRAVITATION Exercise:TEST YOUR GRASP -2
Explore 20 Videos
- ELECTROSTATICSBook:MARVEL PUBLICATIONChapter:ELECTROSTATICSExercise:TEST YOUR GRASP
Explore 20 Videos
- INTERFERENCE AND DIFFRACTIONBook:MARVEL PUBLICATIONChapter:INTERFERENCE AND DIFFRACTIONExercise:TEST YOUR GRASP
Explore 20 Videos
Similar Questions
A tungsten filament bulb is connected to a variable voltage supply. The potential difference, V is varied and the current, I and steady temperature T of the filament is recorded. A graph is plotted for ln (VI)Vsln(T). Find the slope of the graph. Assume that temperature of filament T>>T0= atmospheric temperature

View SolutionFor a first order reaction, the plot of log k against 1/T is a straight line. The slope of the line is equal to
View Solution
Knowledge Check
The periodic time T of a simple pendulum are observed , for different length L if a graph of 'log T' against 'log L' is plotted , the slope of the graph at T = 2 s is
A2B1/2C√2D√2Magnitude of slope of the shown graph.
 AFirst increases then decresesBFirst decrease then increasesCIncreasesDDecreases
In accordance to Arrhenius equation, the plot of log k against 1T is a straight line. The slope of the line is equal to
A−EaRB−2.303Ea.RC−Ea2.303RD−Ea2.303
The susceptibility of a paramagnetic substance was found for different temperatures and a graph of χ against 1T was plotted. From the graph, it was found that when χ=0.5, 1T=5×10⁻³/K. What is the curie constant for the substance ?
View SolutionThe graph of l against T for a simple pendulum is
View SolutionA graph of force against extension of a wire is plotted. The area under the curve is
View SolutionIf the distance is plotted on the x-axis and kinetic energy is plotted on the y-axis, then the slope of the graph so obained is proportional to
View SolutionFor a radioactive element, a graph of log N against time has a slope equal to:
View Solution

