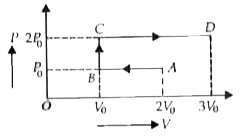
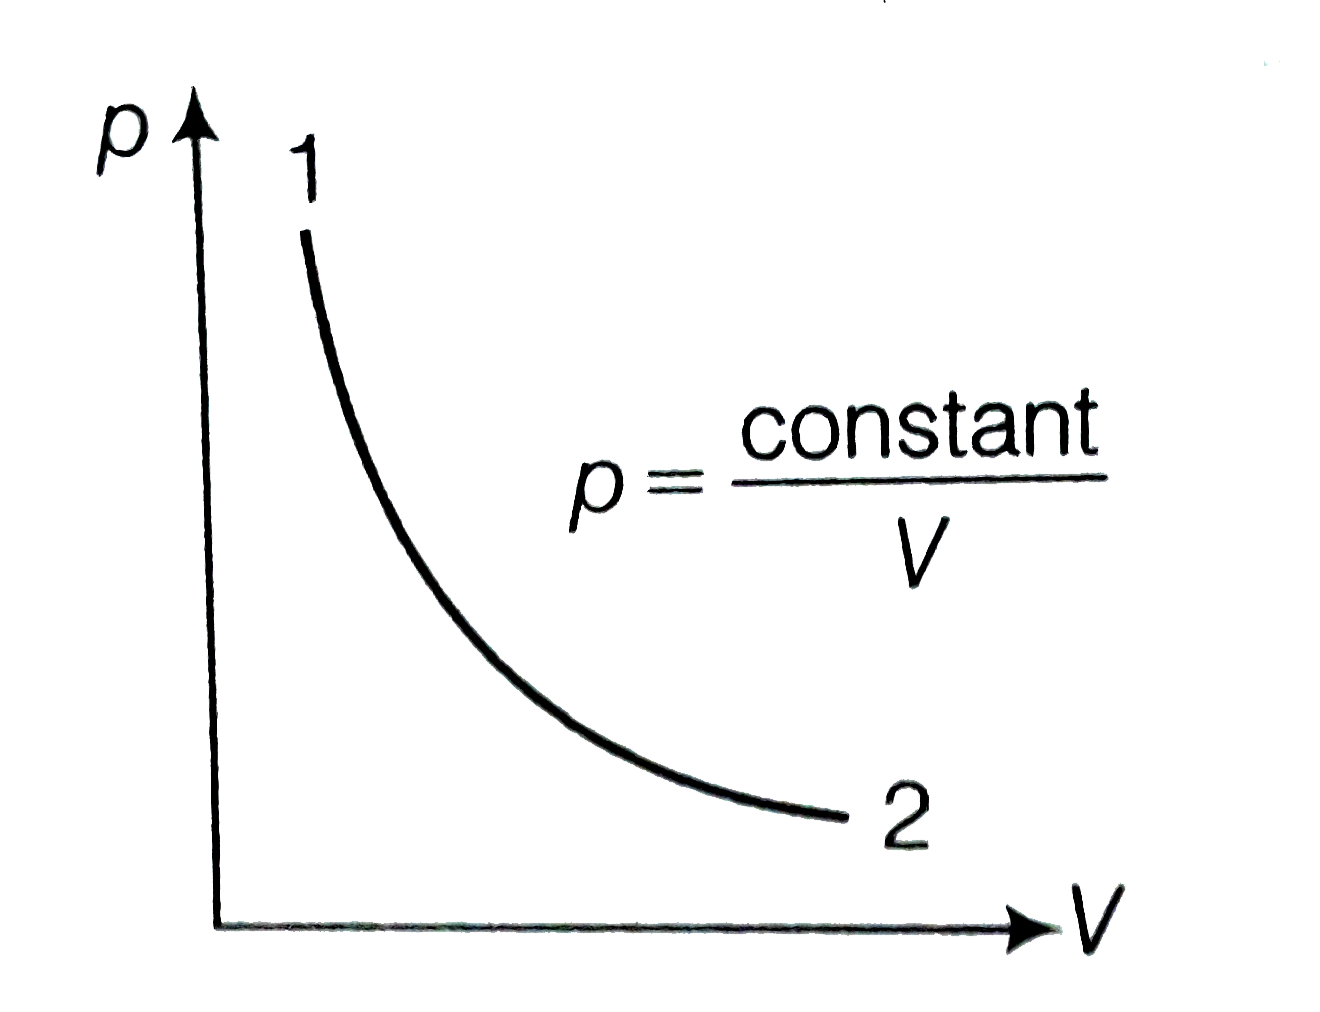
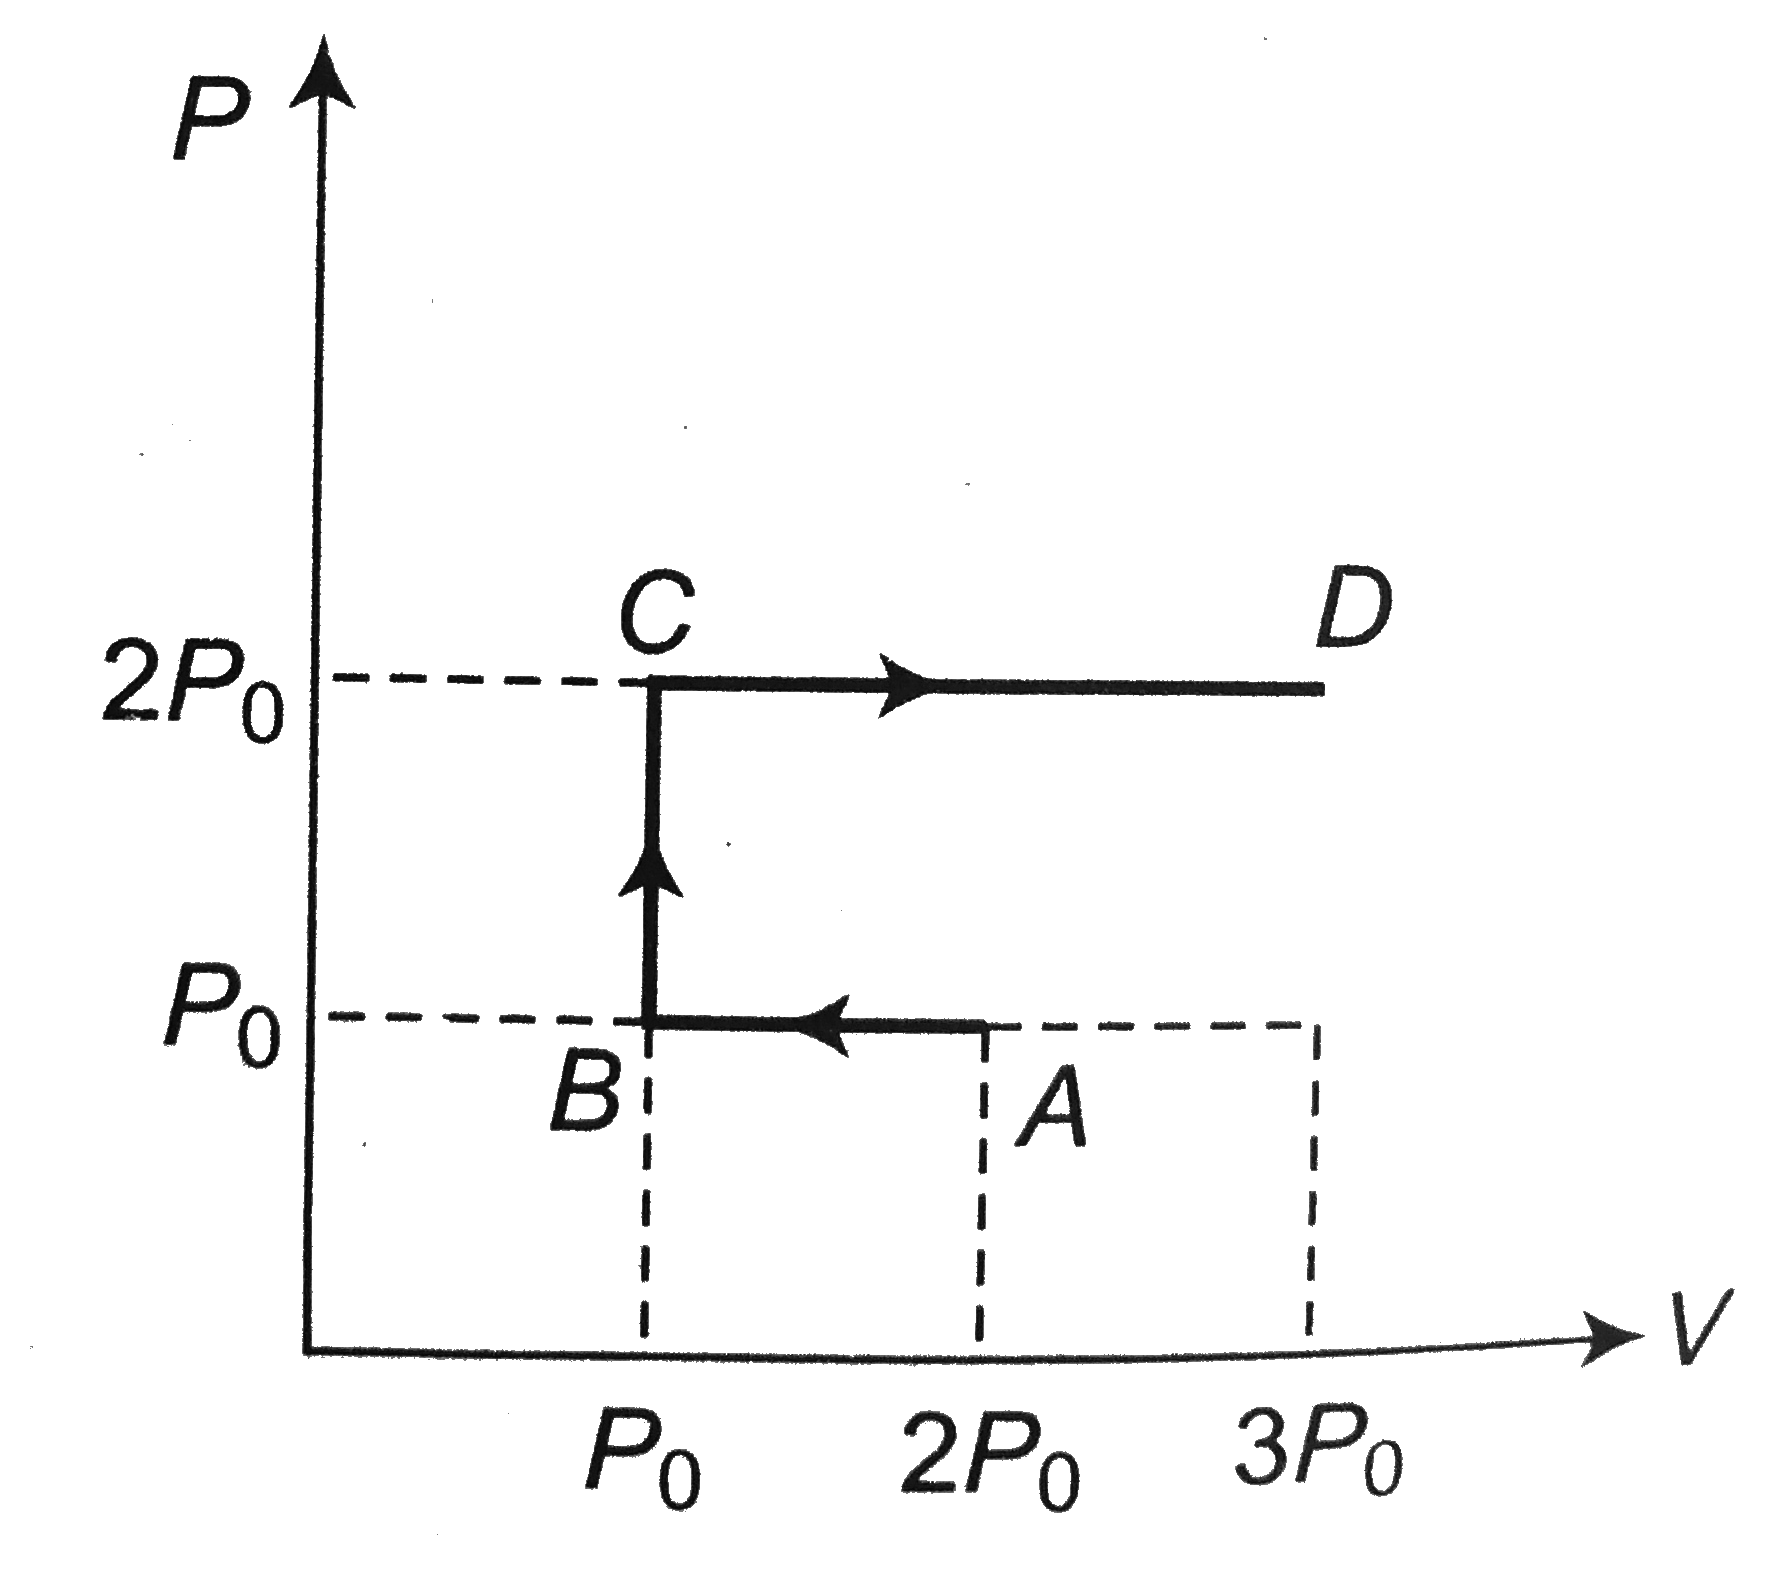
Consider P−V diagram for an ideal gas shown in figure.
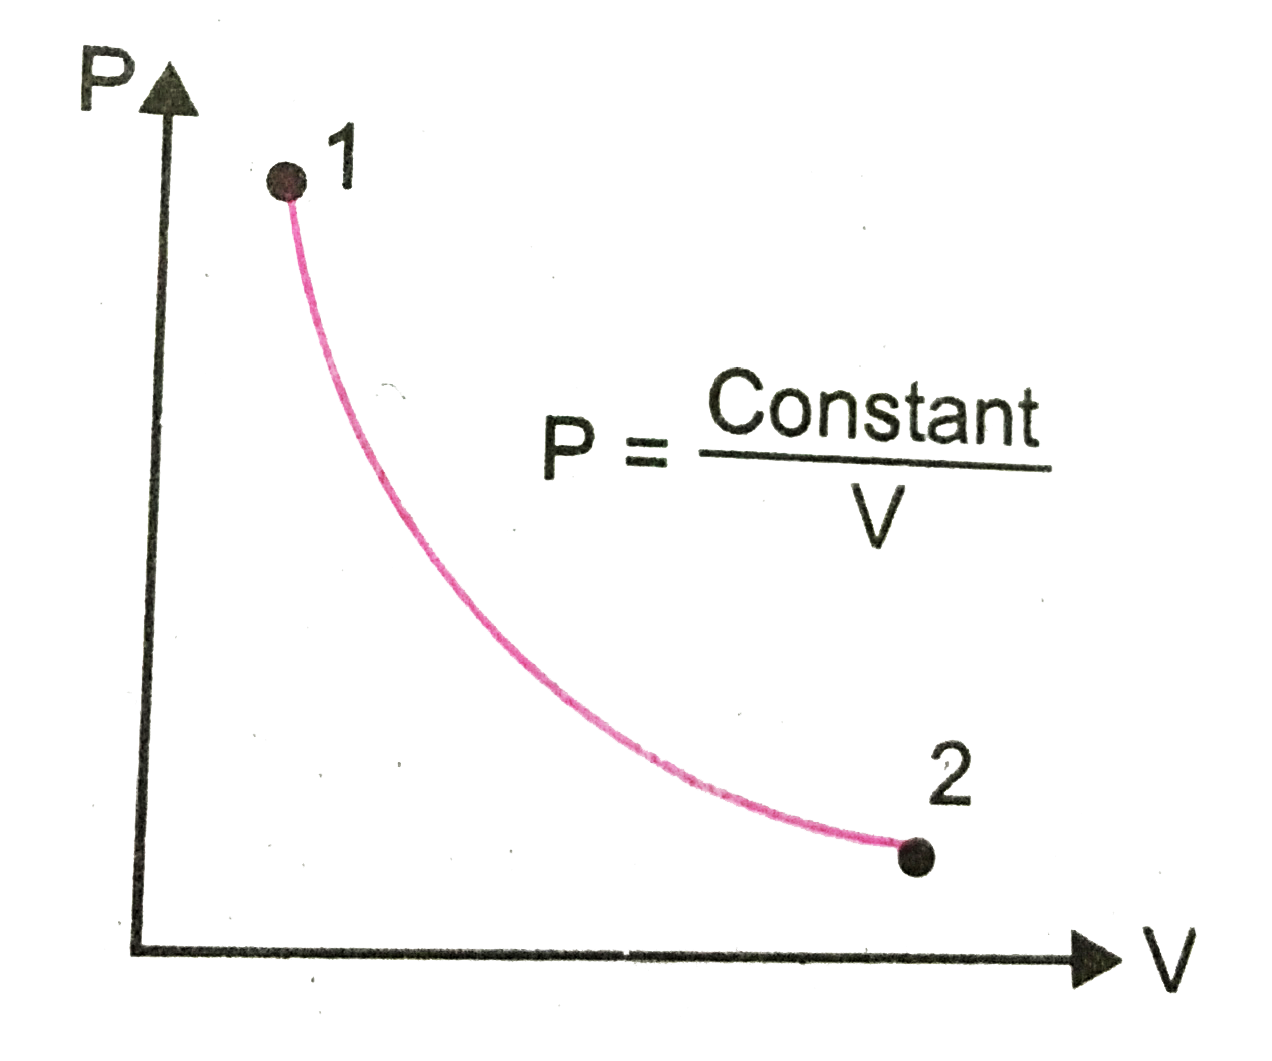
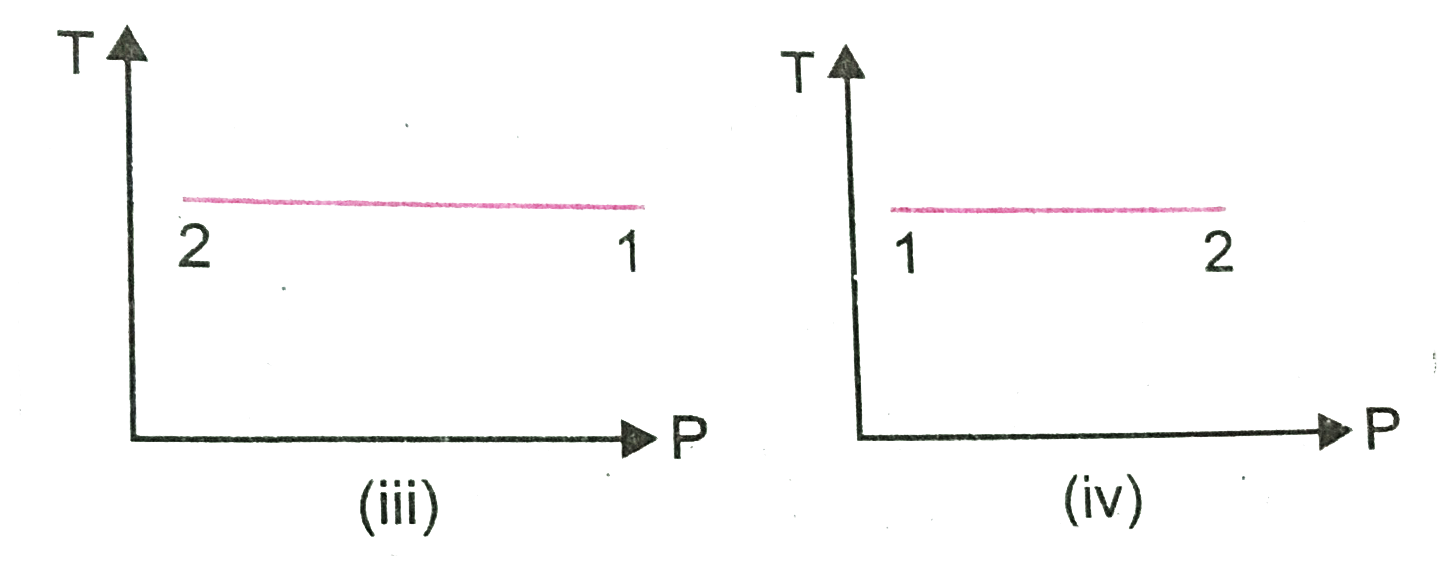
Out of following diagrams(figure). Which represents the T−P diagram?
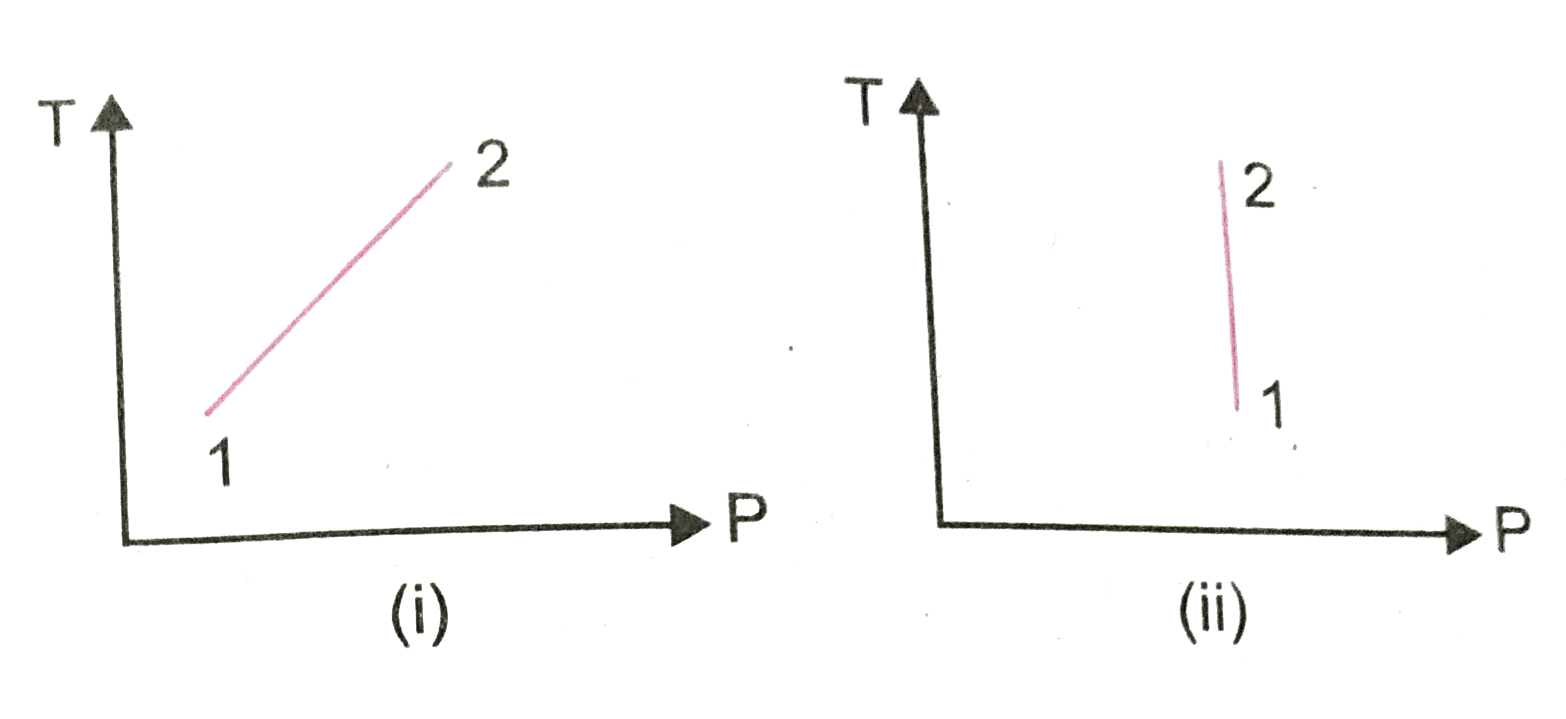
A
(iv)
B
(ii)
C
(iii)
D
(iv)
Video Solution
Text Solution
The correct Answer is:C
In (figure) T is constant and P1>P2. This situation is represented by curve (iii) in (figure). 3 in which P1>P2 and straight line graph is prallel to pressure axis indicating constant temperature. Choice (c ) is correct.
|
Topper's Solved these Questions
- THERMODYNAMICSBOOK - PRADEEPCHAPTER - THERMODYNAMICSEXERCISE - Multiple choice questions.
96 Videos
- THERMODYNAMICSBOOK - PRADEEPCHAPTER - THERMODYNAMICSEXERCISE - Interger Type questions
11 Videos
- THERMODYNAMICSBOOK - PRADEEPCHAPTER - THERMODYNAMICSEXERCISE - Problems for practice
54 Videos
- SYSTEMS OF PARTICLES AND ROTATIONAL MOTIONBOOK - PRADEEPCHAPTER - SYSTEMS OF PARTICLES AND ROTATIONAL MOTIONEXERCISE - Assertion- Reason Type questions
20 Videos
- WORK, ENERGY AND POWERBOOK - PRADEEPCHAPTER - WORK, ENERGY AND POWEREXERCISE - Assertion-Reason Type Questions
24 Videos
Similar Questions
Knowledge Check
The P-V diagram for an ideal gas is shown in figure.
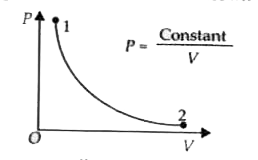
Out of the following diagrams which one represents the T-P diagram ?A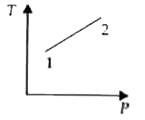 B
B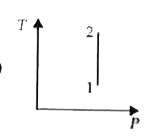 C
C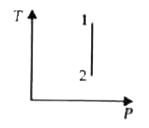 D
D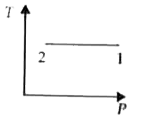
Consider p-V diagram for an ideal gas shown in figure.
Out of the following diagrams, which figure represents the T−p diagram ?
(i)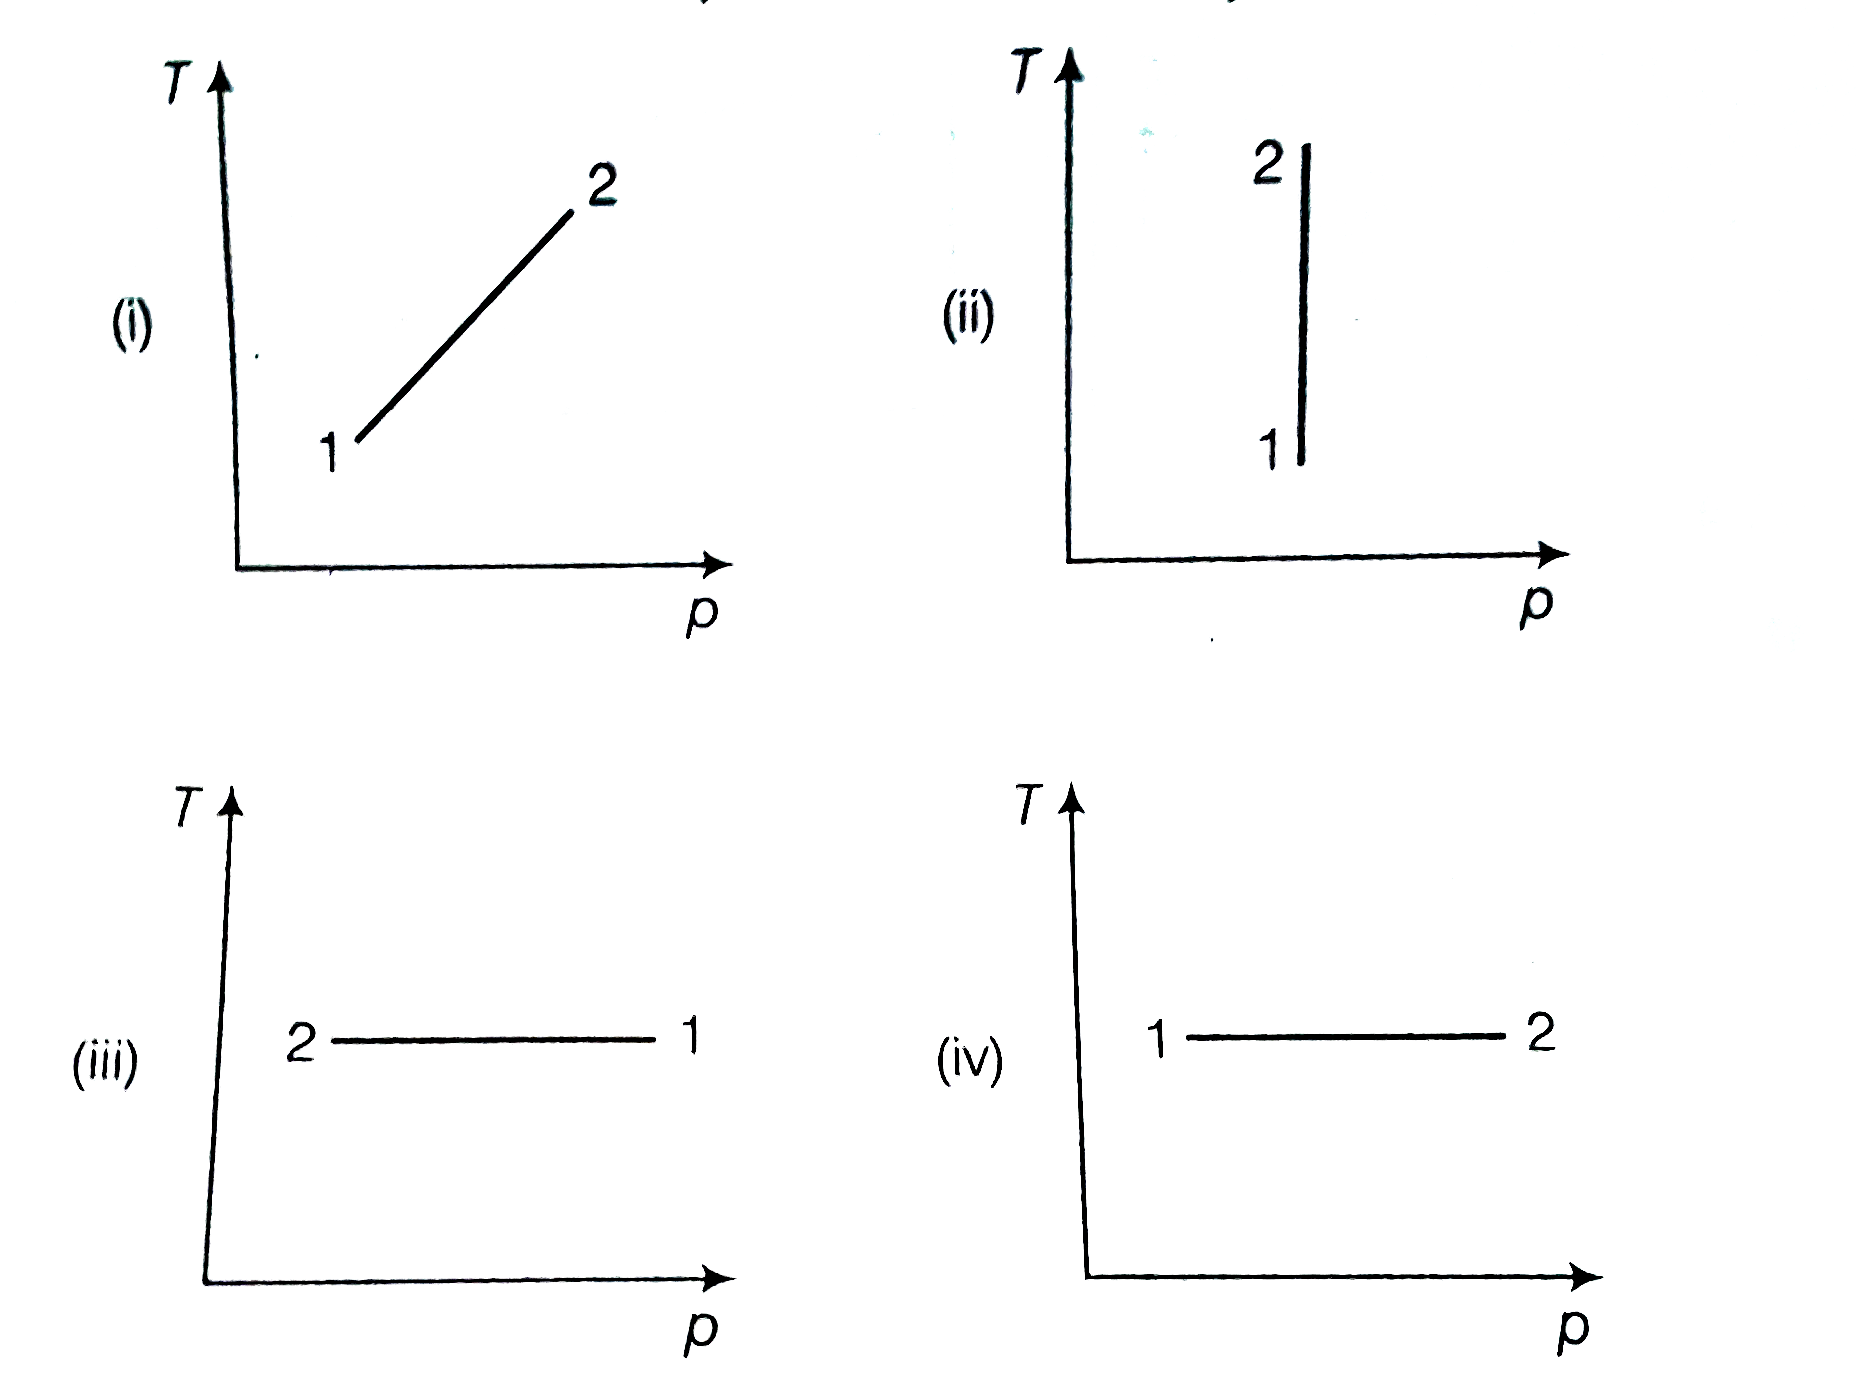 A(iv)B(ii)C(iii)D(i)
In P−V diagram shown below,
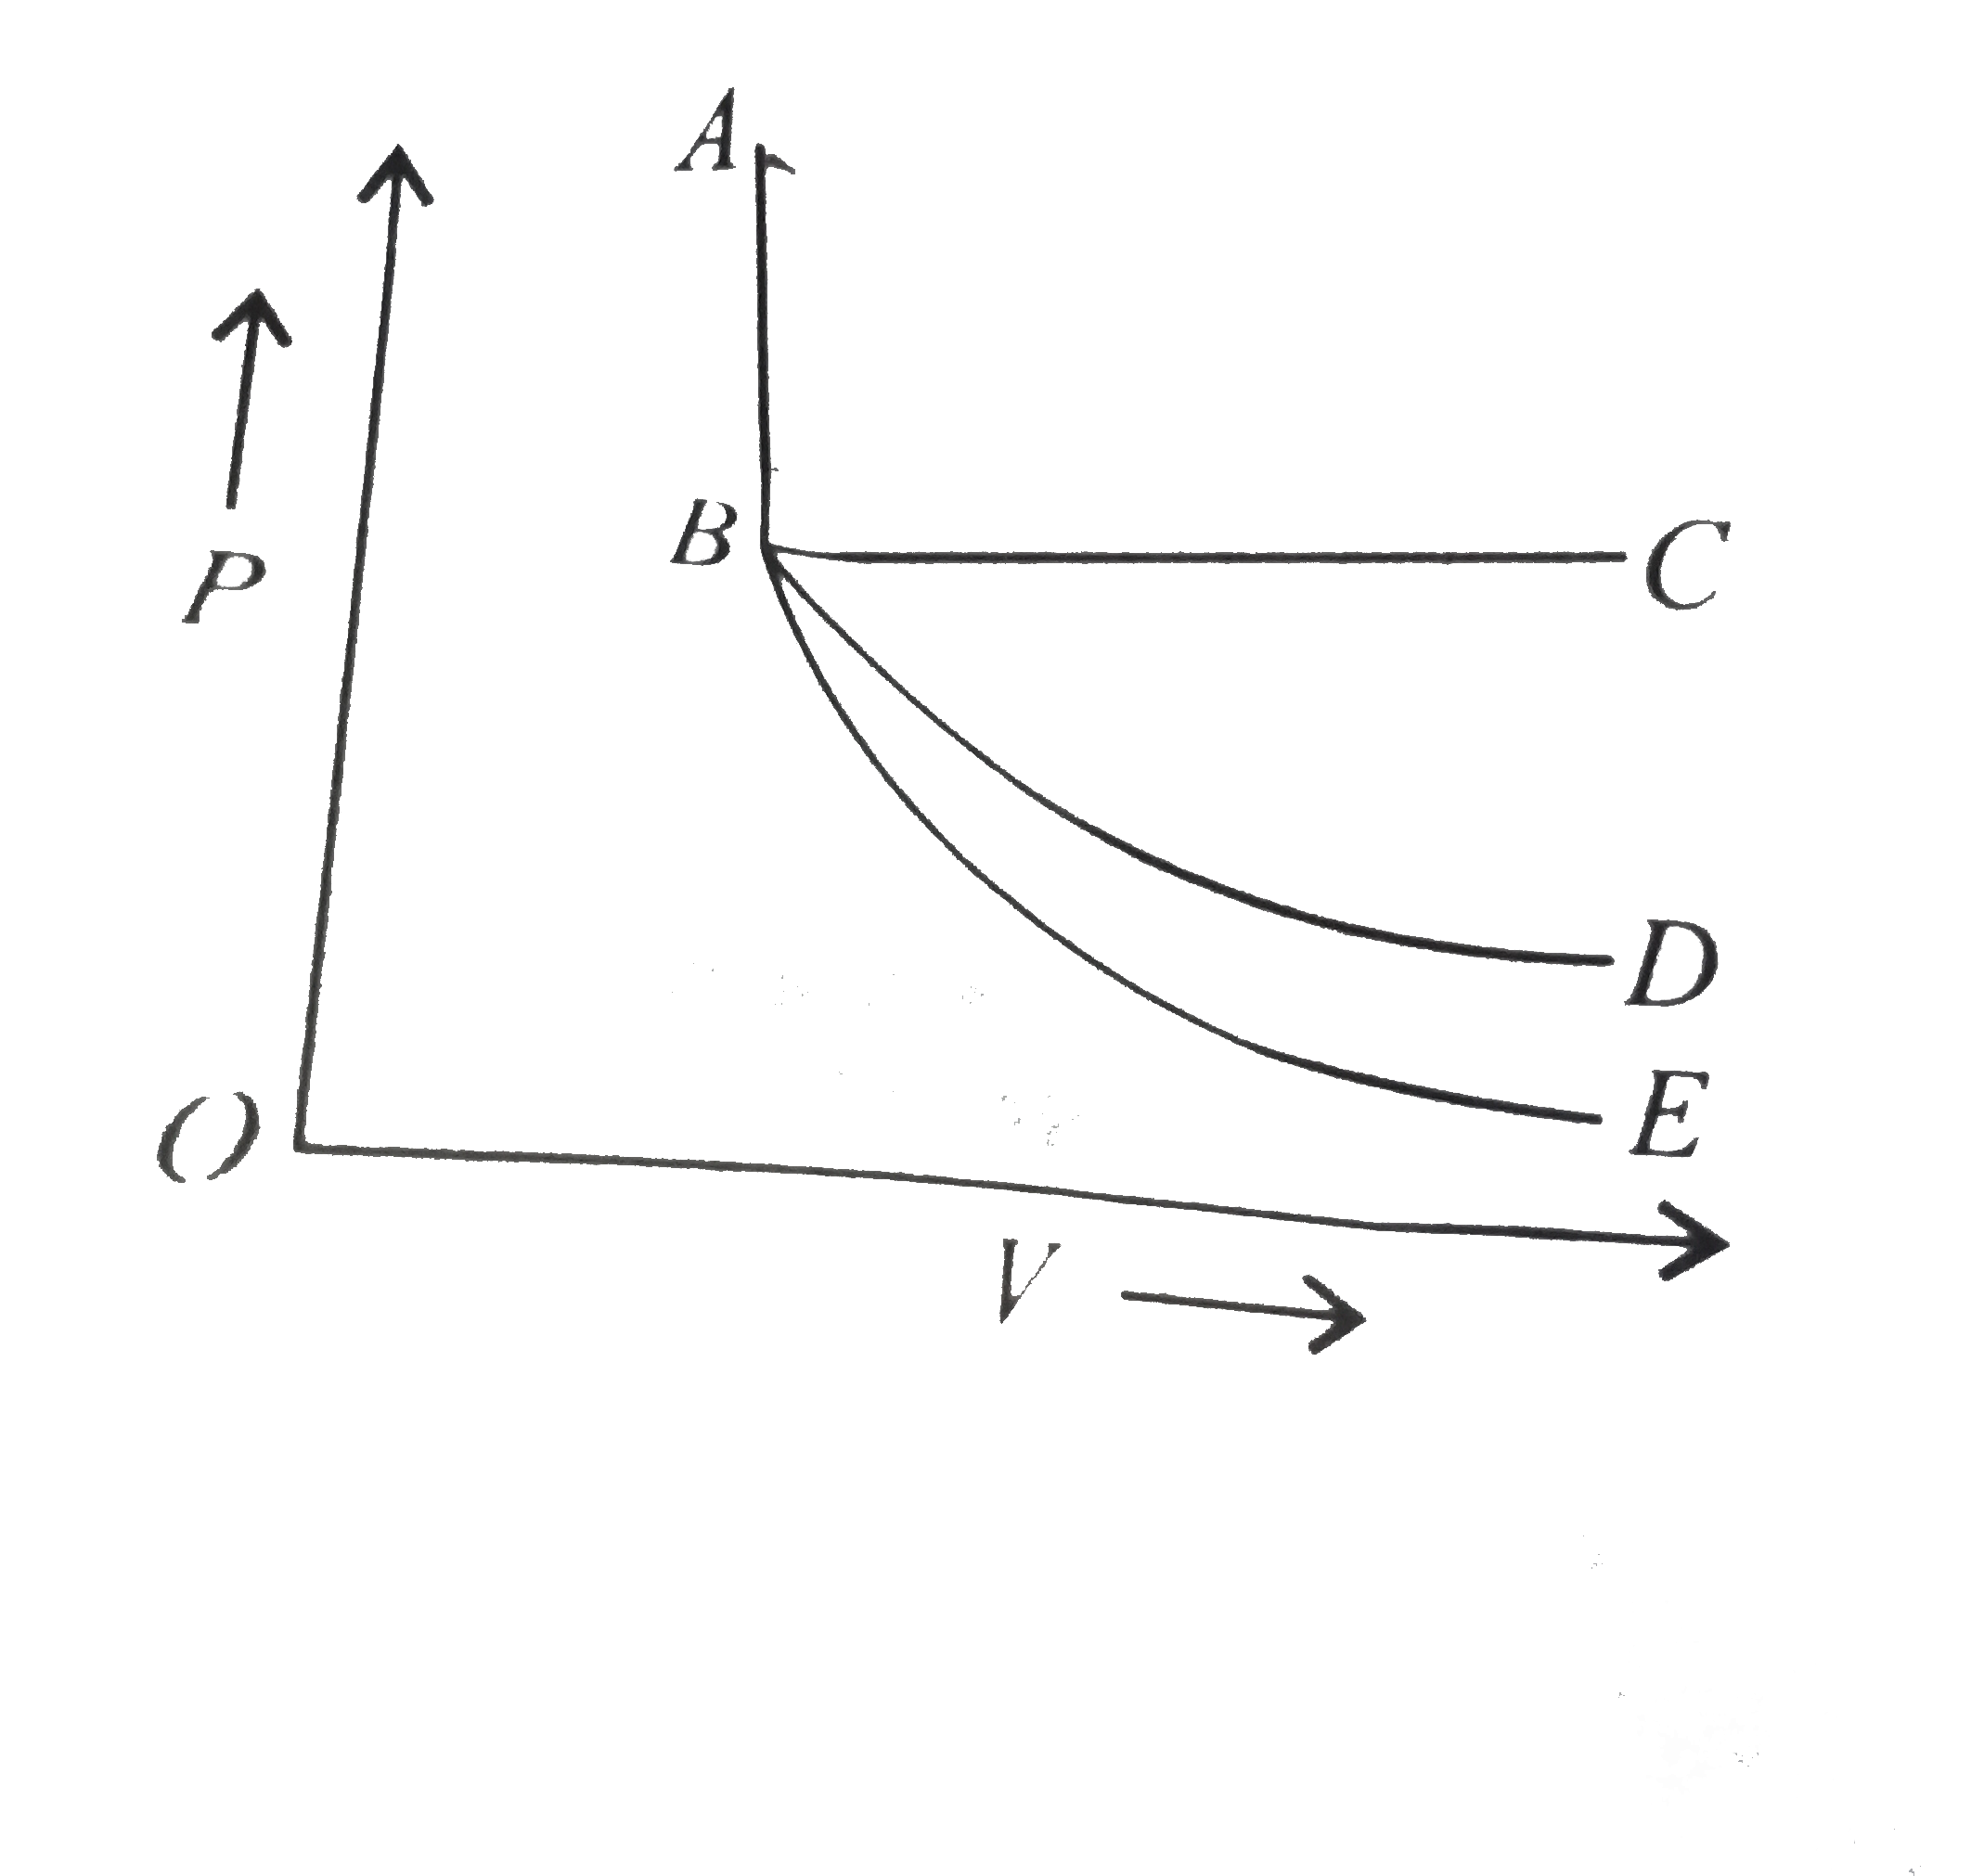 AAB represents adiabatic process.BAB represents isothermal process.CAB represents isobaric process.DAB represents isochoric process.
P−V diagram of an ideal gas is as shown in figure. Work done by the gas in process ABCD is
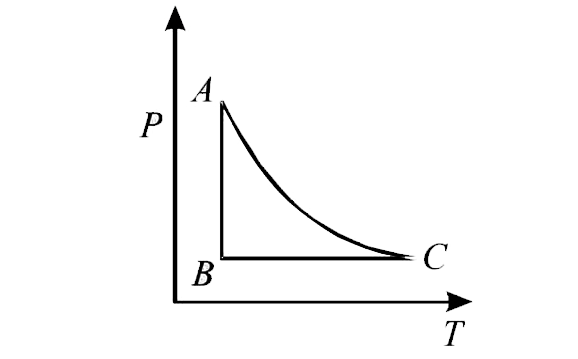
View SolutionThe PT diagram for an ideal gas is shown in the figure, where AC is an adiabatic process, find the corresponding PV diagram.
View SolutionWhich of the following diagrams (figure) depicts ideal gas behaviour?
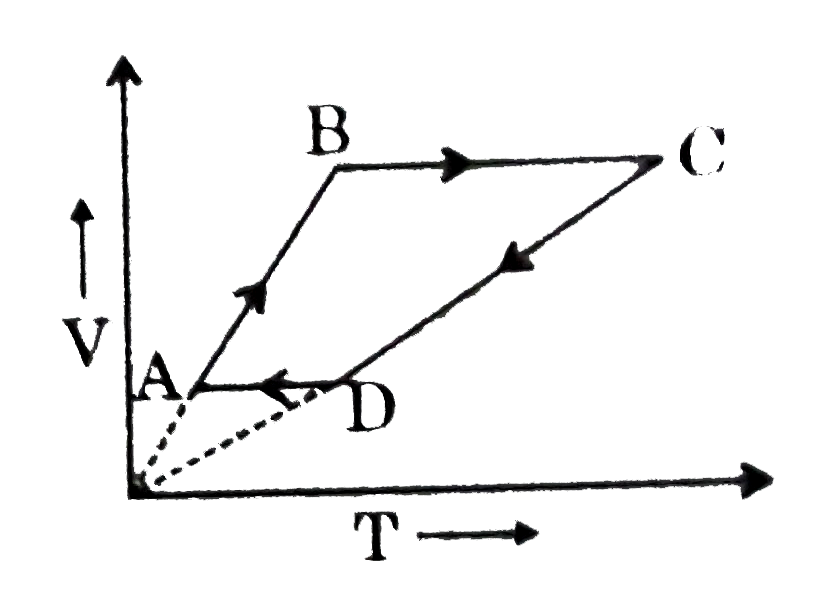
View SolutionA cyclic process ABCD is shown in VT diagram for an ideal gas. Which of the following diagram represents the same process ?
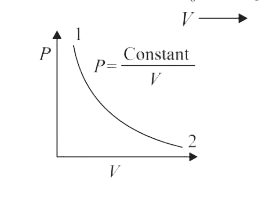
View SolutionFor the diagram given for an ideal gas, out of the following which one correctly represent the diagram?
View Solution

