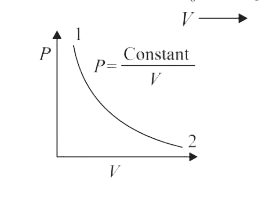
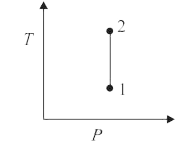
For the diagram given for an ideal gas, out of the following which one correctly represent the diagram?
A
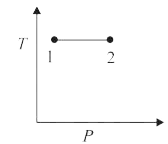
B
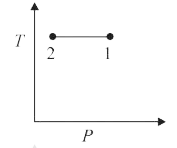
C
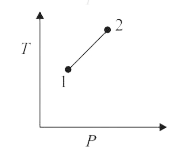
D
Video Solution
Text Solution
The correct Answer is:B
P∝1V T⇒ constant.
|
Similar Questions
Knowledge Check
The P-V diagram for an ideal gas is shown in figure.
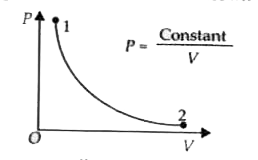
Out of the following diagrams which one represents the T-P diagram ?A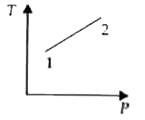 B
B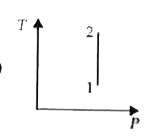 C
C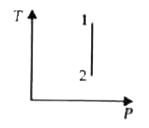 D
D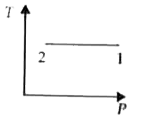
Consider p-V diagram for an ideal gas shown in figure.
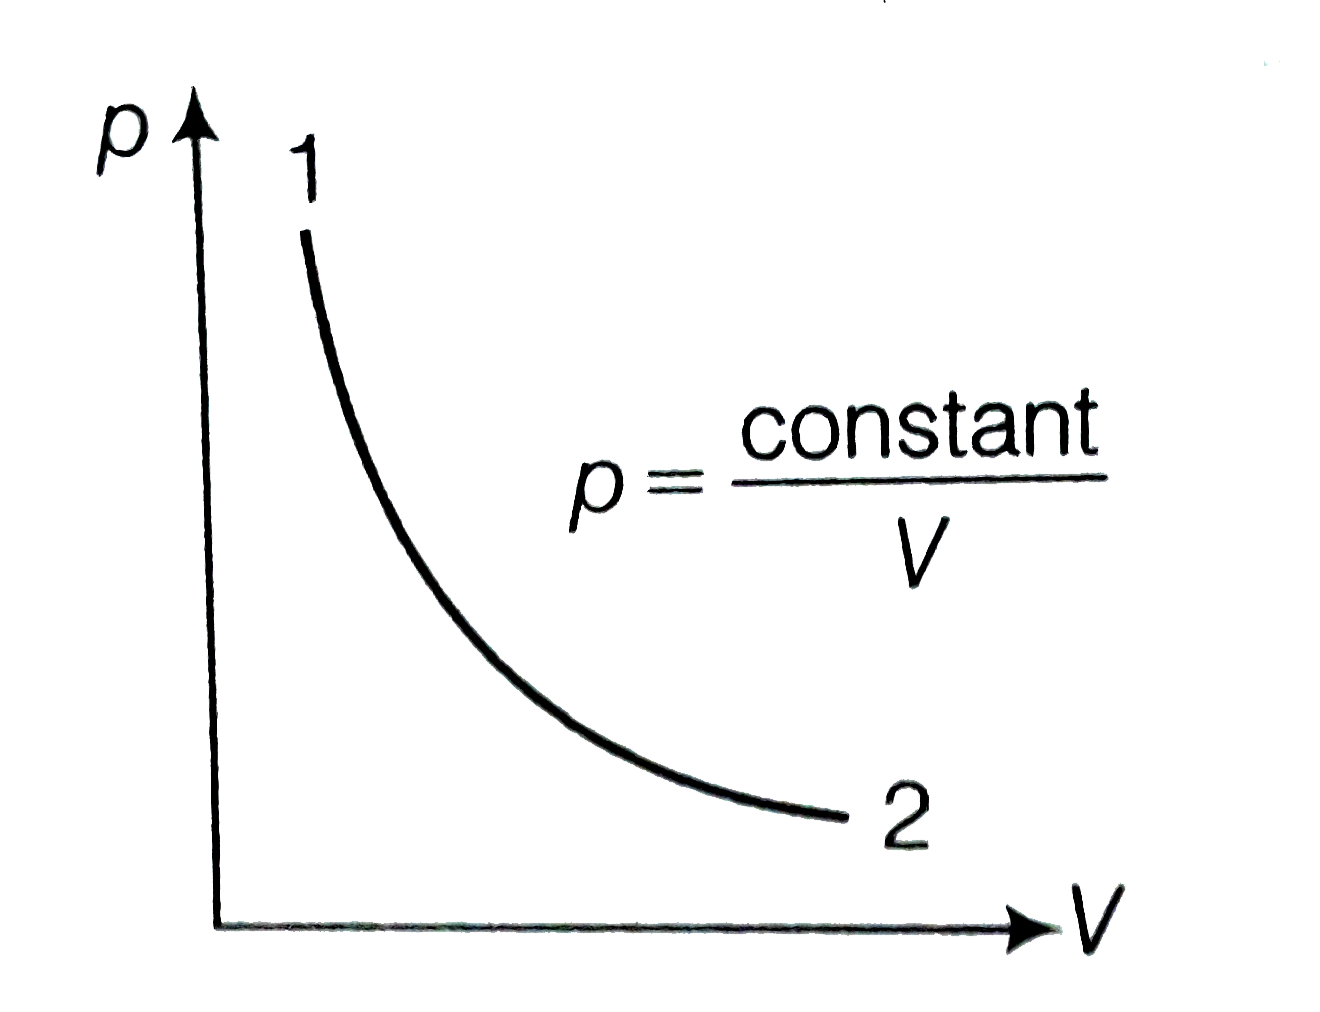
Out of the following diagrams, which figure represents the T−p diagram ?
(i)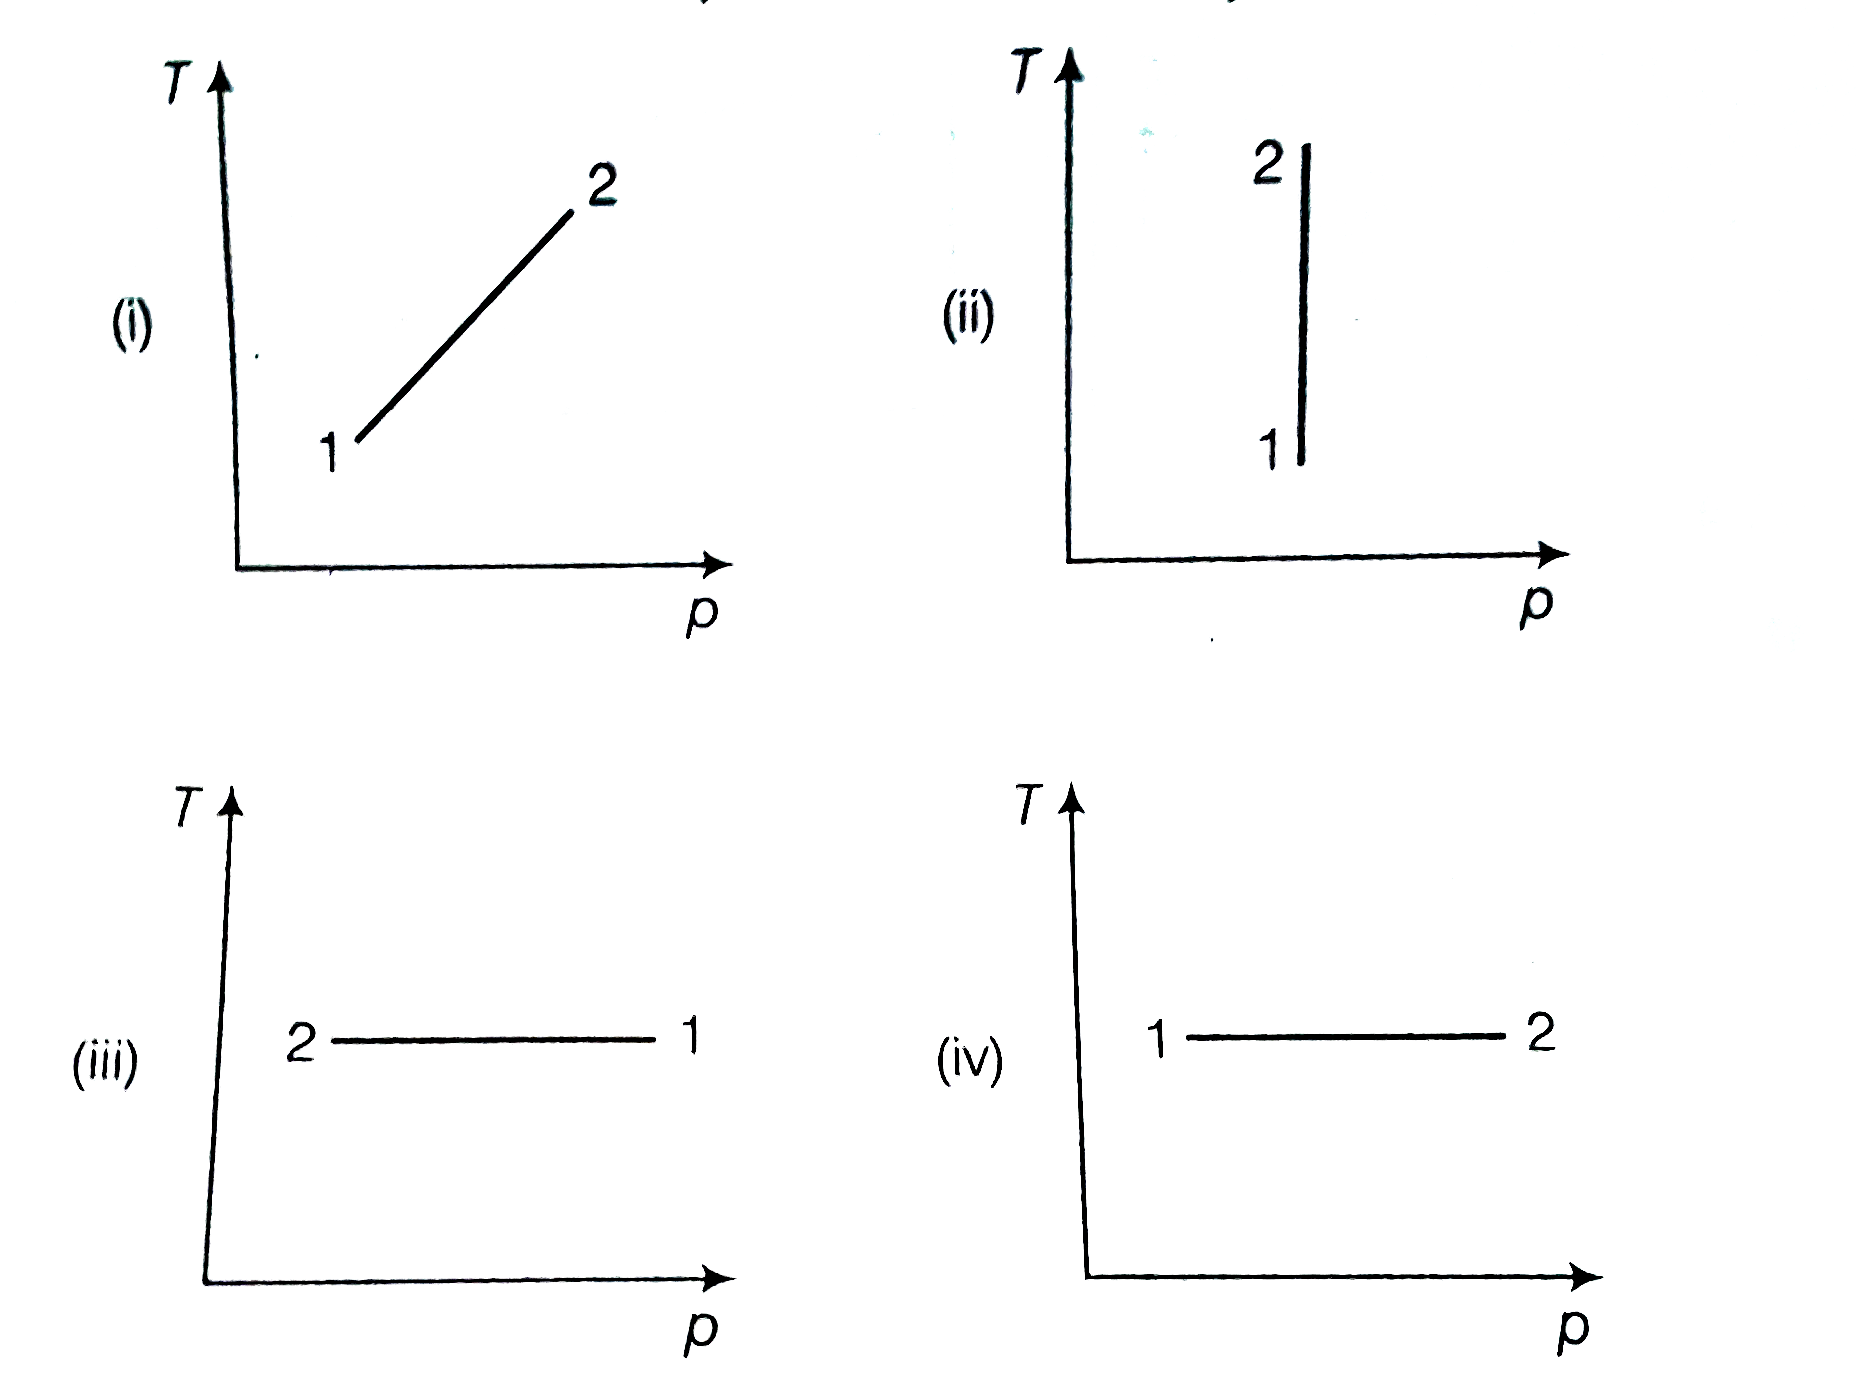 A(iv)B(ii)C(iii)D(i)
Which of the following diagrams correctly represents the counter pattern ?
A B
B C
C D
D
Which of the following sets is best represented by the given Venn diagram.

View SolutionA cyclic process ABCD is shown in VT diagram for an ideal gas. Which of the following diagram represents the same process ?
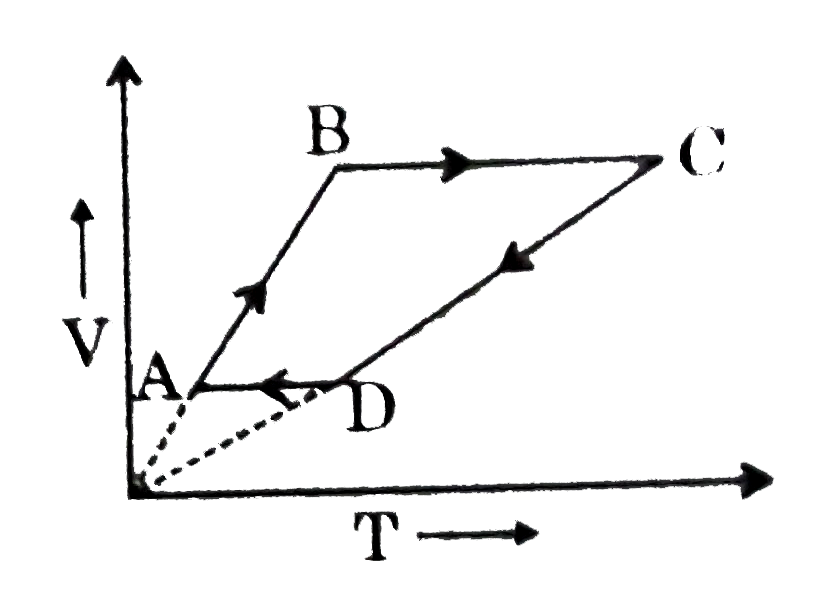
View SolutionCircular Flow of income is correctly represented in the diagram :
View SolutionWhich one of the following sets is best represented in the adjoining diagram?
View SolutionIn the given diagram, which of the following is not correctly labeled ?
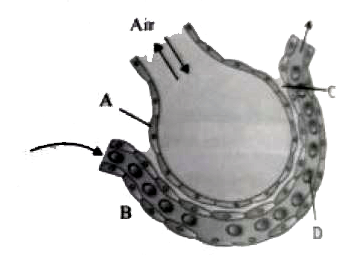
View Solution


