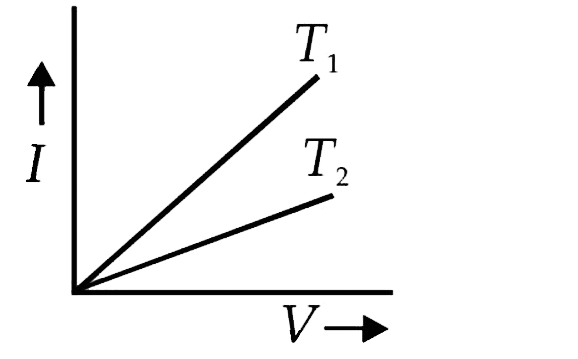
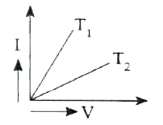
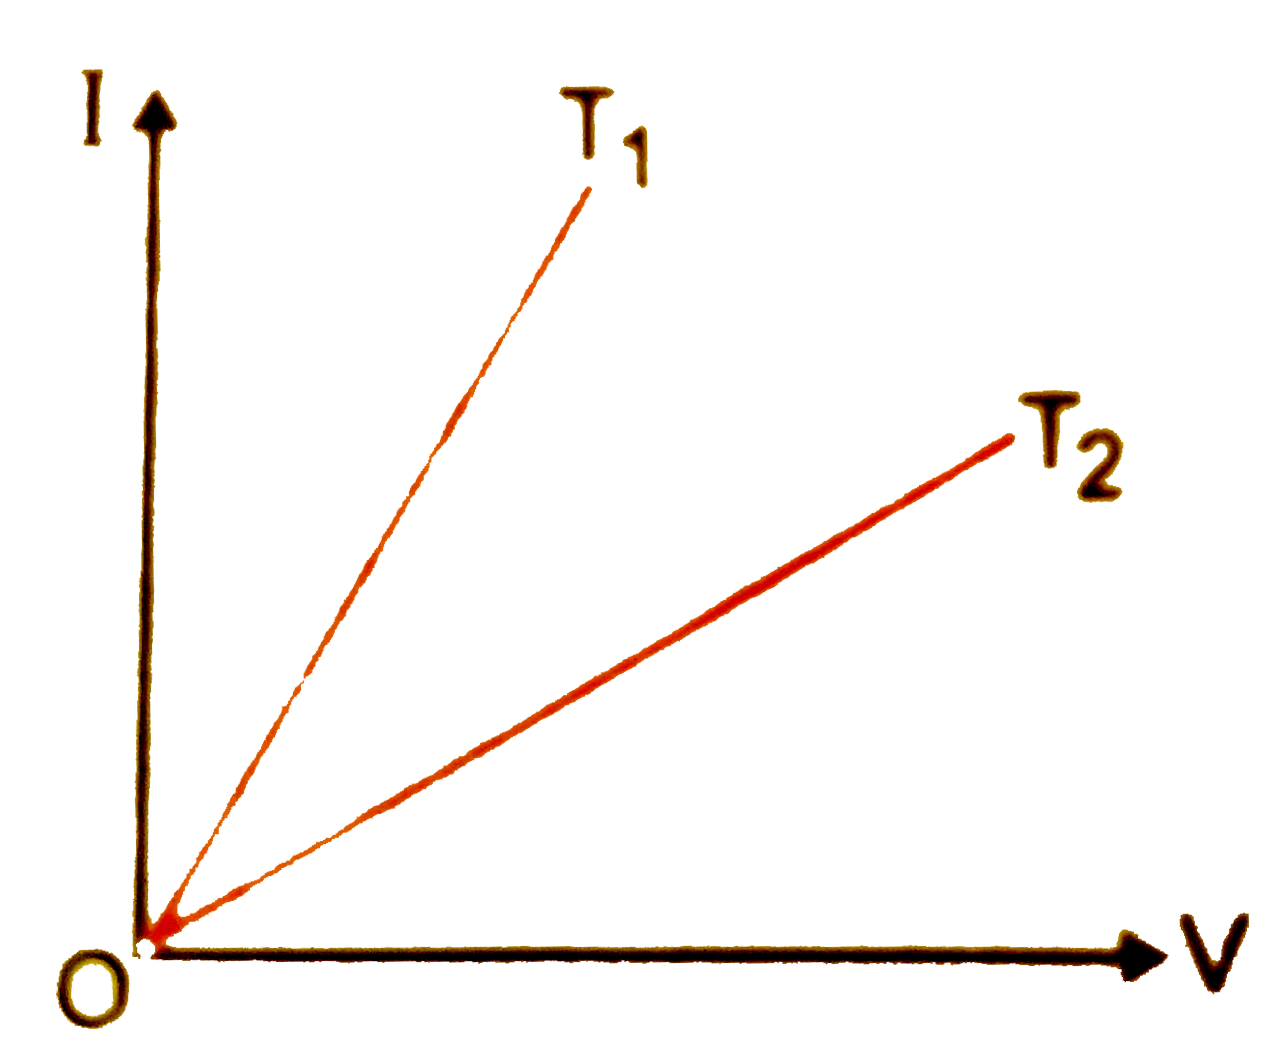
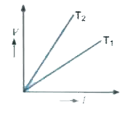
The current - voltage graphs for a given metallic wire at two different temperatures T1andT2 are shown in the figure.
The temperature T2 is greater than T1.
T1>T2
T1<T2
T1=T2
T1=T2
The correct Answer is:A
Slope of graph will give us reciprocal of resisatnce.
(as1V=1R)
Here resistance at temperatre T1 is greater than that at T2.
Since resistance of metallic wire is max at higher temperature than at lower temperaure, hence T1>T2.
Topper's Solved these Questions
- MOCK TESTBOOK - A2ZCHAPTER - MOCK TESTEXERCISE - Mock Test 3
44 Videos
- MOCK TESTBOOK - A2ZCHAPTER - MOCK TESTEXERCISE - Mock Test 3
44 Videos
- MAGNETISM AND MATTERBOOK - A2ZCHAPTER - MAGNETISM AND MATTEREXERCISE - Section D - Chapter End Test
30 Videos
- NUCLEAR PHYSICSBOOK - A2ZCHAPTER - NUCLEAR PHYSICSEXERCISE - Section D - Chapter End Test
29 Videos
Similar Questions
The current voltage graphs for a given metalic wire two different temperature T1 and T2 are shown in figure The temperature T2 is greater than T1. Is this statement true or false?
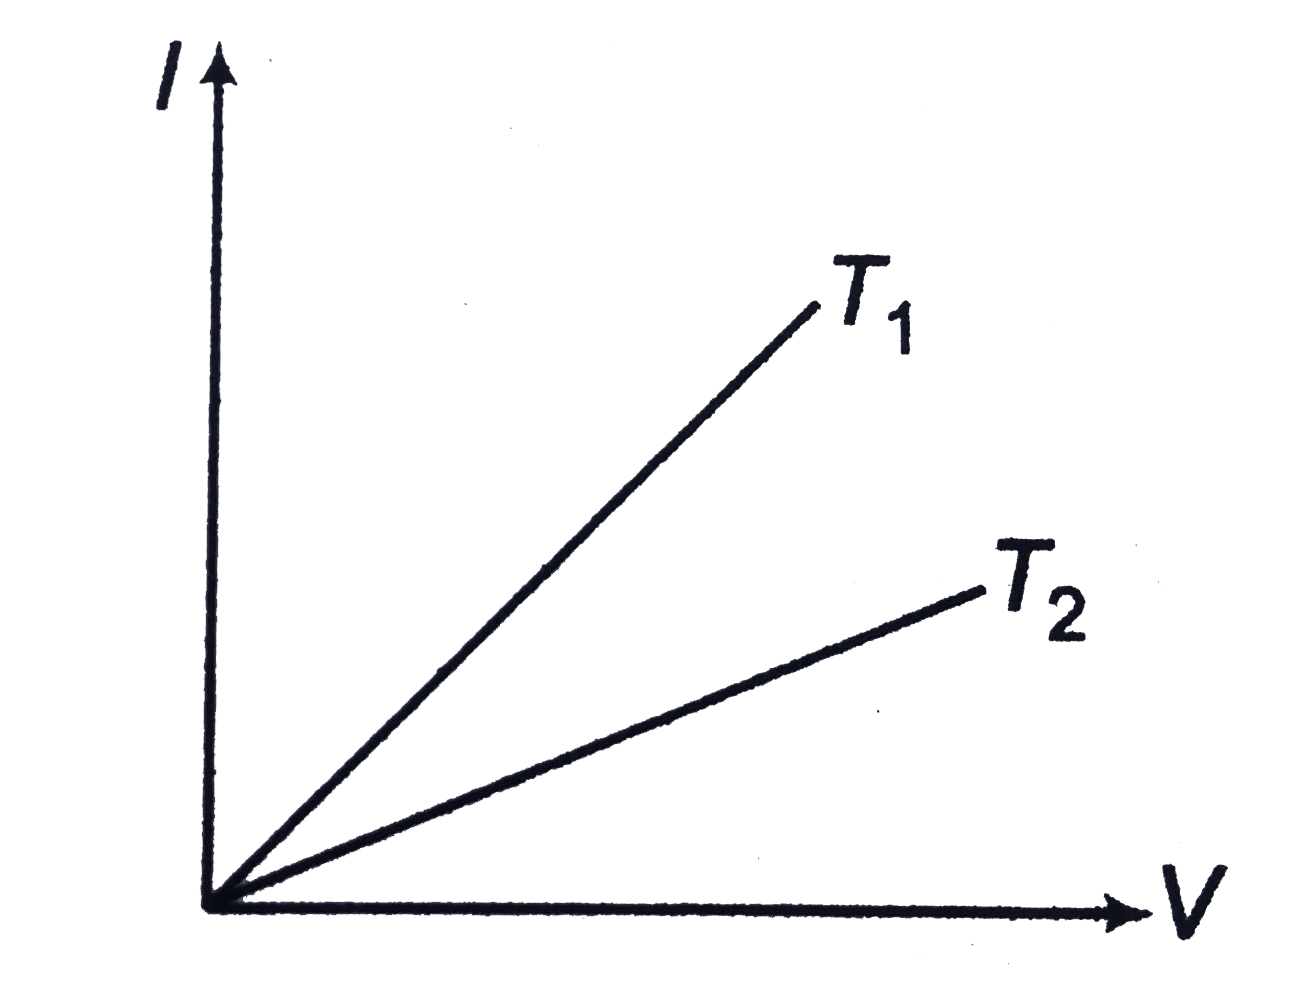
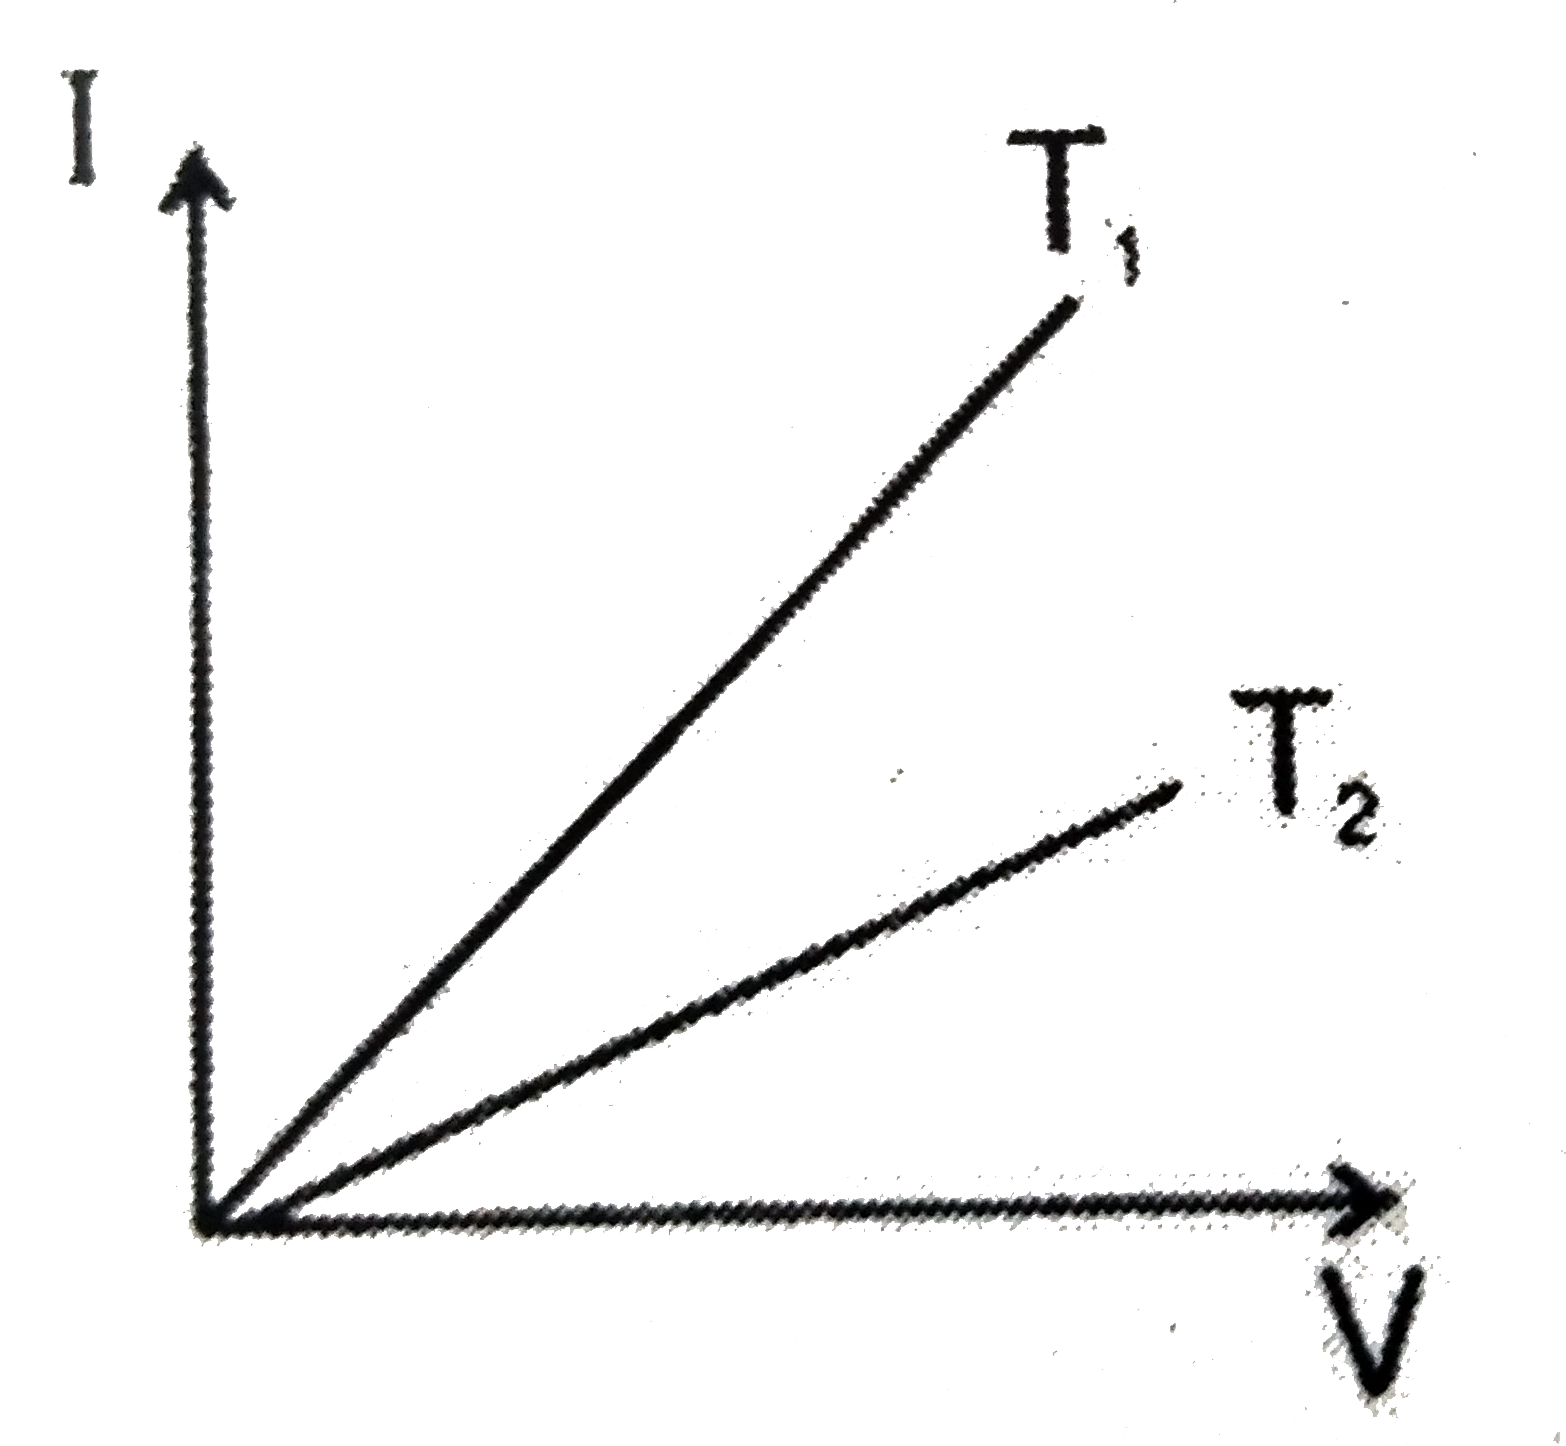
View SolutionThe current-coltage graphs for a given metallic wire at two differenct tempeature T1 and T2 are shown in the figure. Which one is higher, T1 or T2
View Solution
Knowledge Check
The current (I) and voltage (V) graphs for a given metallic wire at two different temperature (T1) and (T2) are shown in fig. It is concluded that
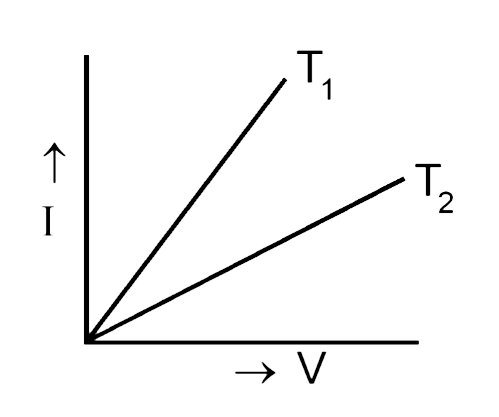 AT1=T2BT1>T2CT1<T2DNone of these
The current (I) and voltage (V) graphs for a given metallic wire at two different temperature (T1) and (T2) are shown in fig. It is concluded that
 AT1>T2BT1<T2CT1=T2DT1=2T2
The current I and voltage V variations for a given metallic wire at tow different temperature T1andT2 are shown in the figure. Then which one of the following is correct
 AT1>T2BT1<T2CT1=T2DT1=2T2
V- I graph for a metallic wire at two different temperature T1 and T2 is shown in figure. Which of the two temperature is higher and why?
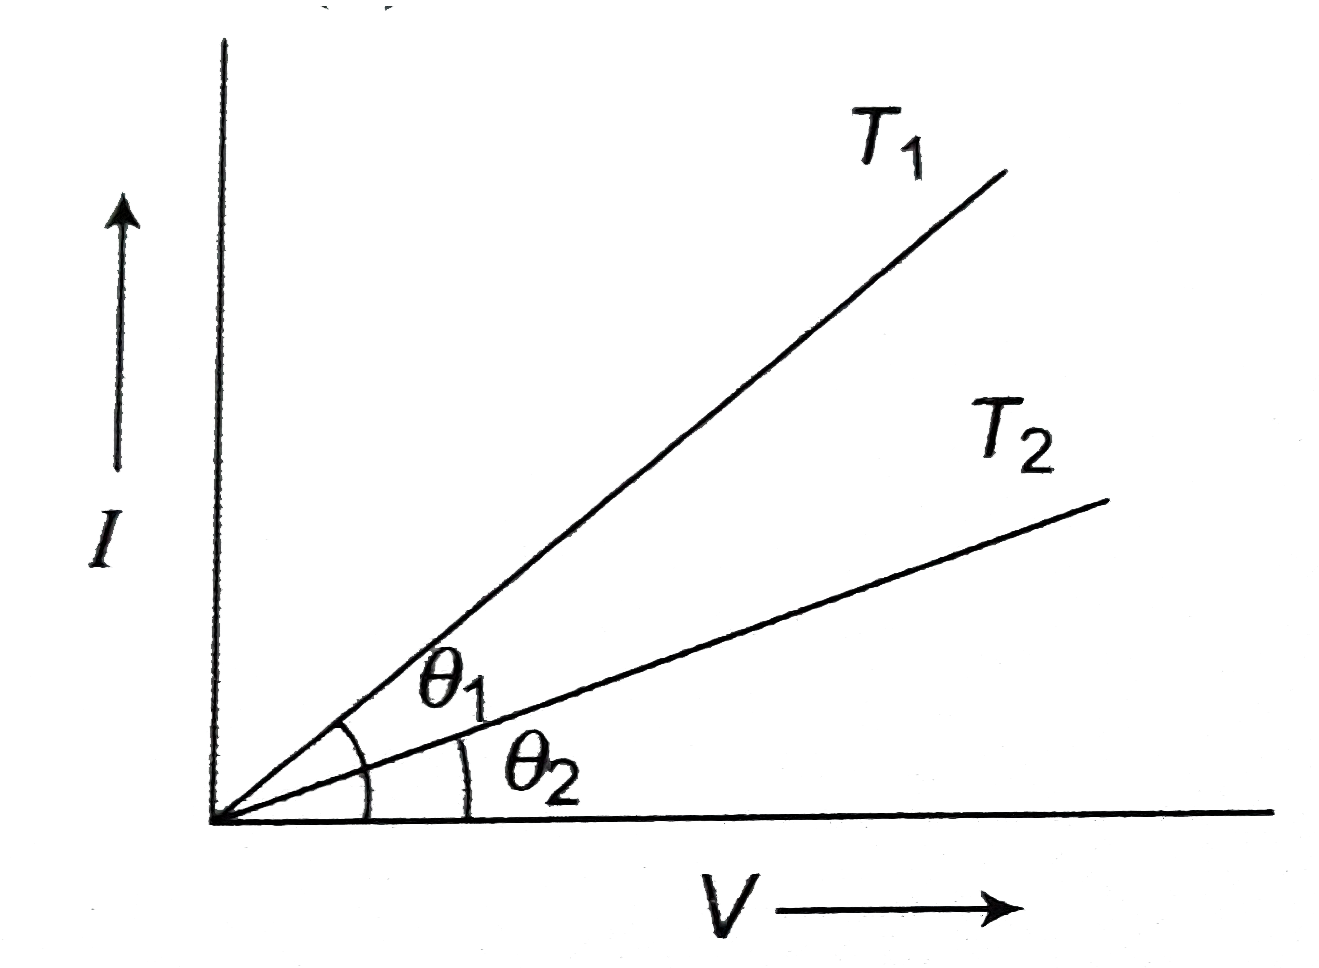
View SolutionThe current-voltage graph for a given speciment at two different temperatures T1 and T2 are shown in the figure. Is the specimen ohmic ?
(b) At which temperature resistance is greater ?
( c) Which temperature is higher ?
 .
.
View SolutionI-V graph for a metallie wire at two different tempearture, T1andT2 is as shown in the figure. Which of the two temperatures is lower and why ?

View SolutionI-V graph for a given metallic wire at two temperatures T1 and T2 is as shown in Fig. Which of the two temperatures is lower and why?
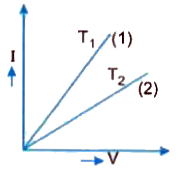
View SolutionThe voltage-current (V-I) graph of a metallic conductor at two different temperature T1 and T2 is shown in figure. At which temperature is the resistance higher?
View Solution
