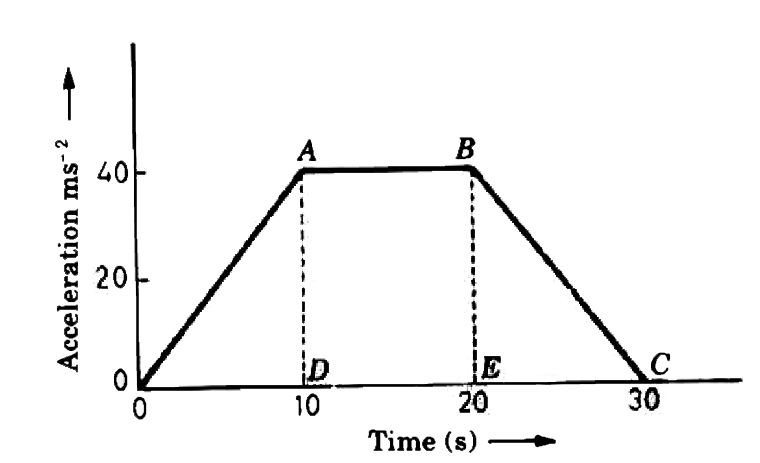
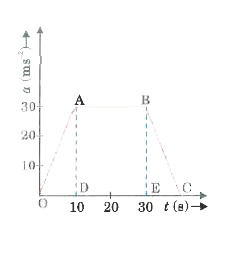
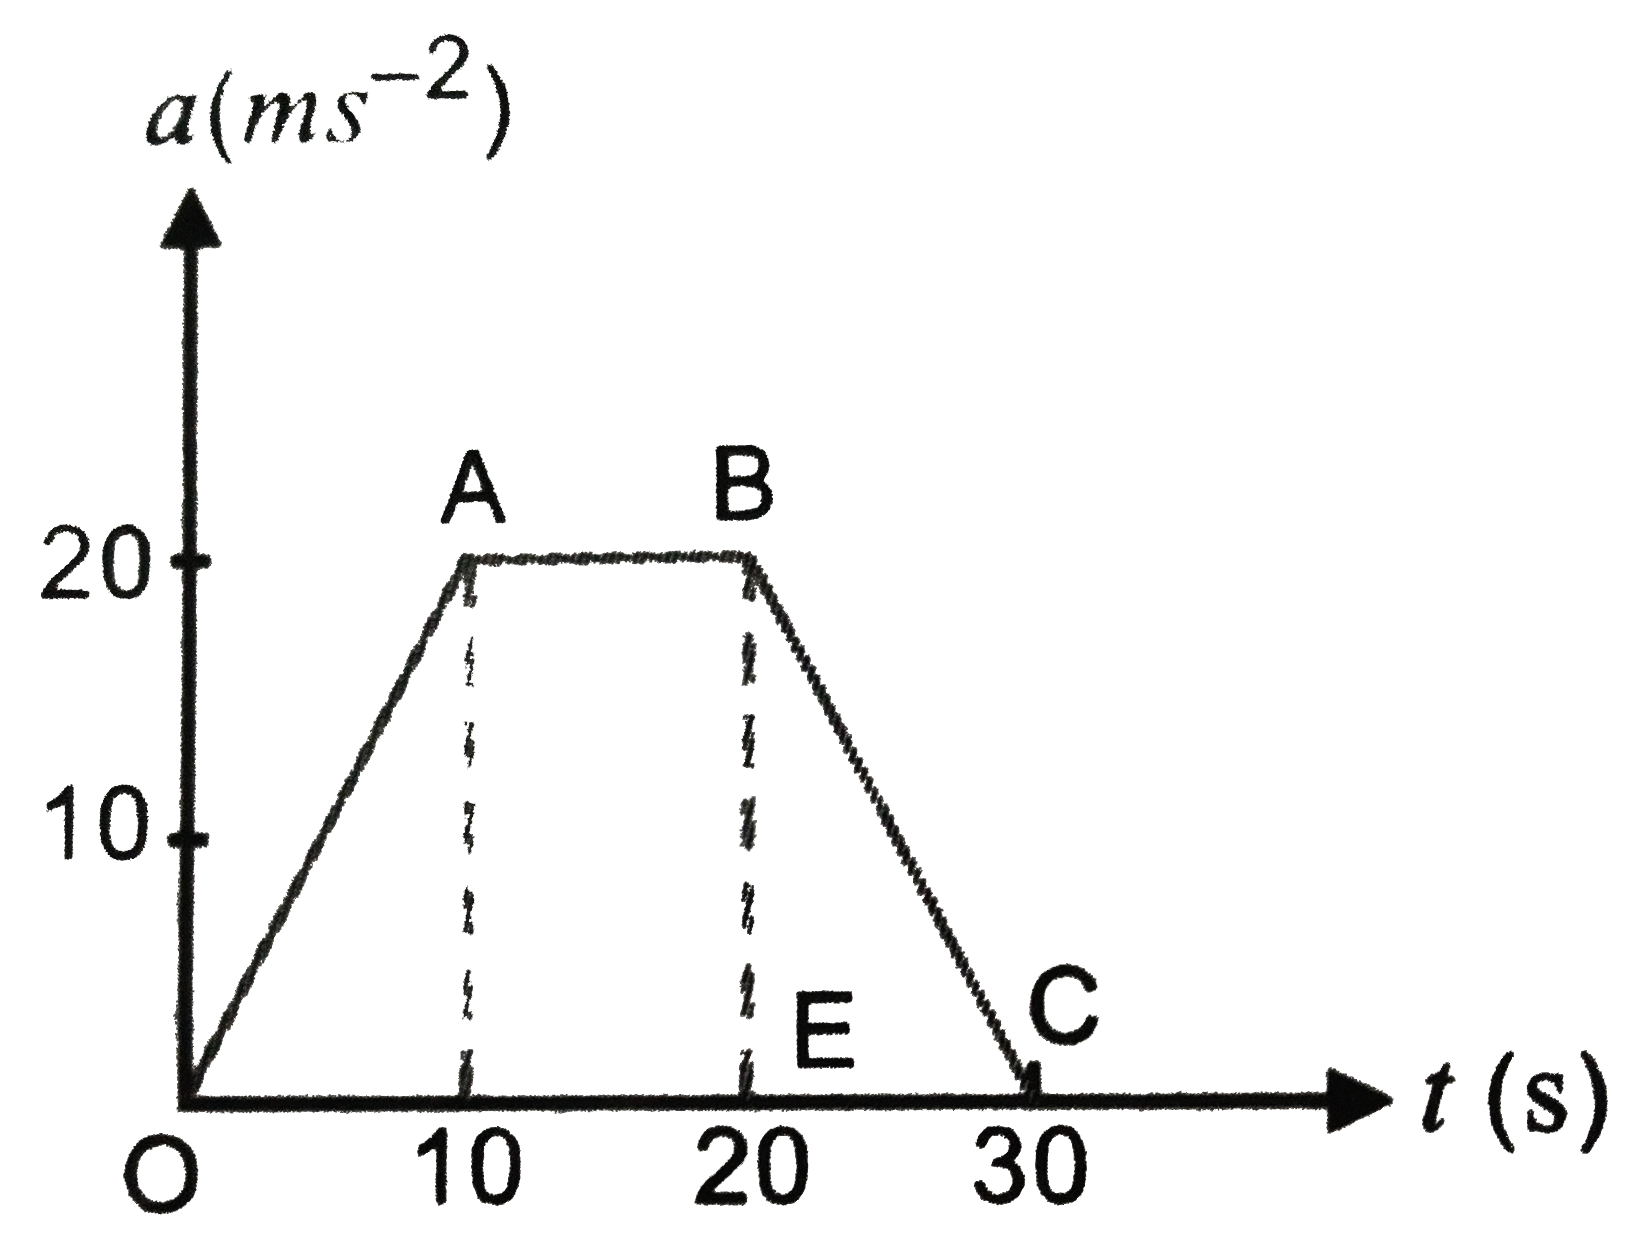
Fig. 2 (b) .16 shows the time-acceleration graph for a particle in rectillinear motion. Find the averate acceleration in first twenty seconds.
 .
.
Video Solution
Text Solution
Average acceleration (a)
=(change in velocity)/(time taken)
:. Change in velocity
=average acceleration (x) time taken
=area of acceleration-time graph
:. Average acceleration
=(area of accleration-time graph )/(time taken )
=(areafoae≤ration−timegraph0timetaken
=areaOABE20=30020=15ms−2 .
|
Topper's Solved these Questions
- KINEMATICSBook:PRADEEPChapter:KINEMATICSExercise:3 SolvedExamples
Explore 46 Videos
- KINEMATICSBook:PRADEEPChapter:KINEMATICSExercise:4 SolvedExamples
Explore 31 Videos
- KINEMATICSBook:PRADEEPChapter:KINEMATICSExercise:1 SolvedExamples
Explore 17 Videos
- GRAVIATIONBook:PRADEEPChapter:GRAVIATIONExercise:Assertion-Reason Type Questions
Explore 19 Videos
- LAWS OF MOTIONBook:PRADEEPChapter:LAWS OF MOTIONExercise:Assertion- Reason Type Questions
Explore 17 Videos
Similar Questions
Knowledge Check
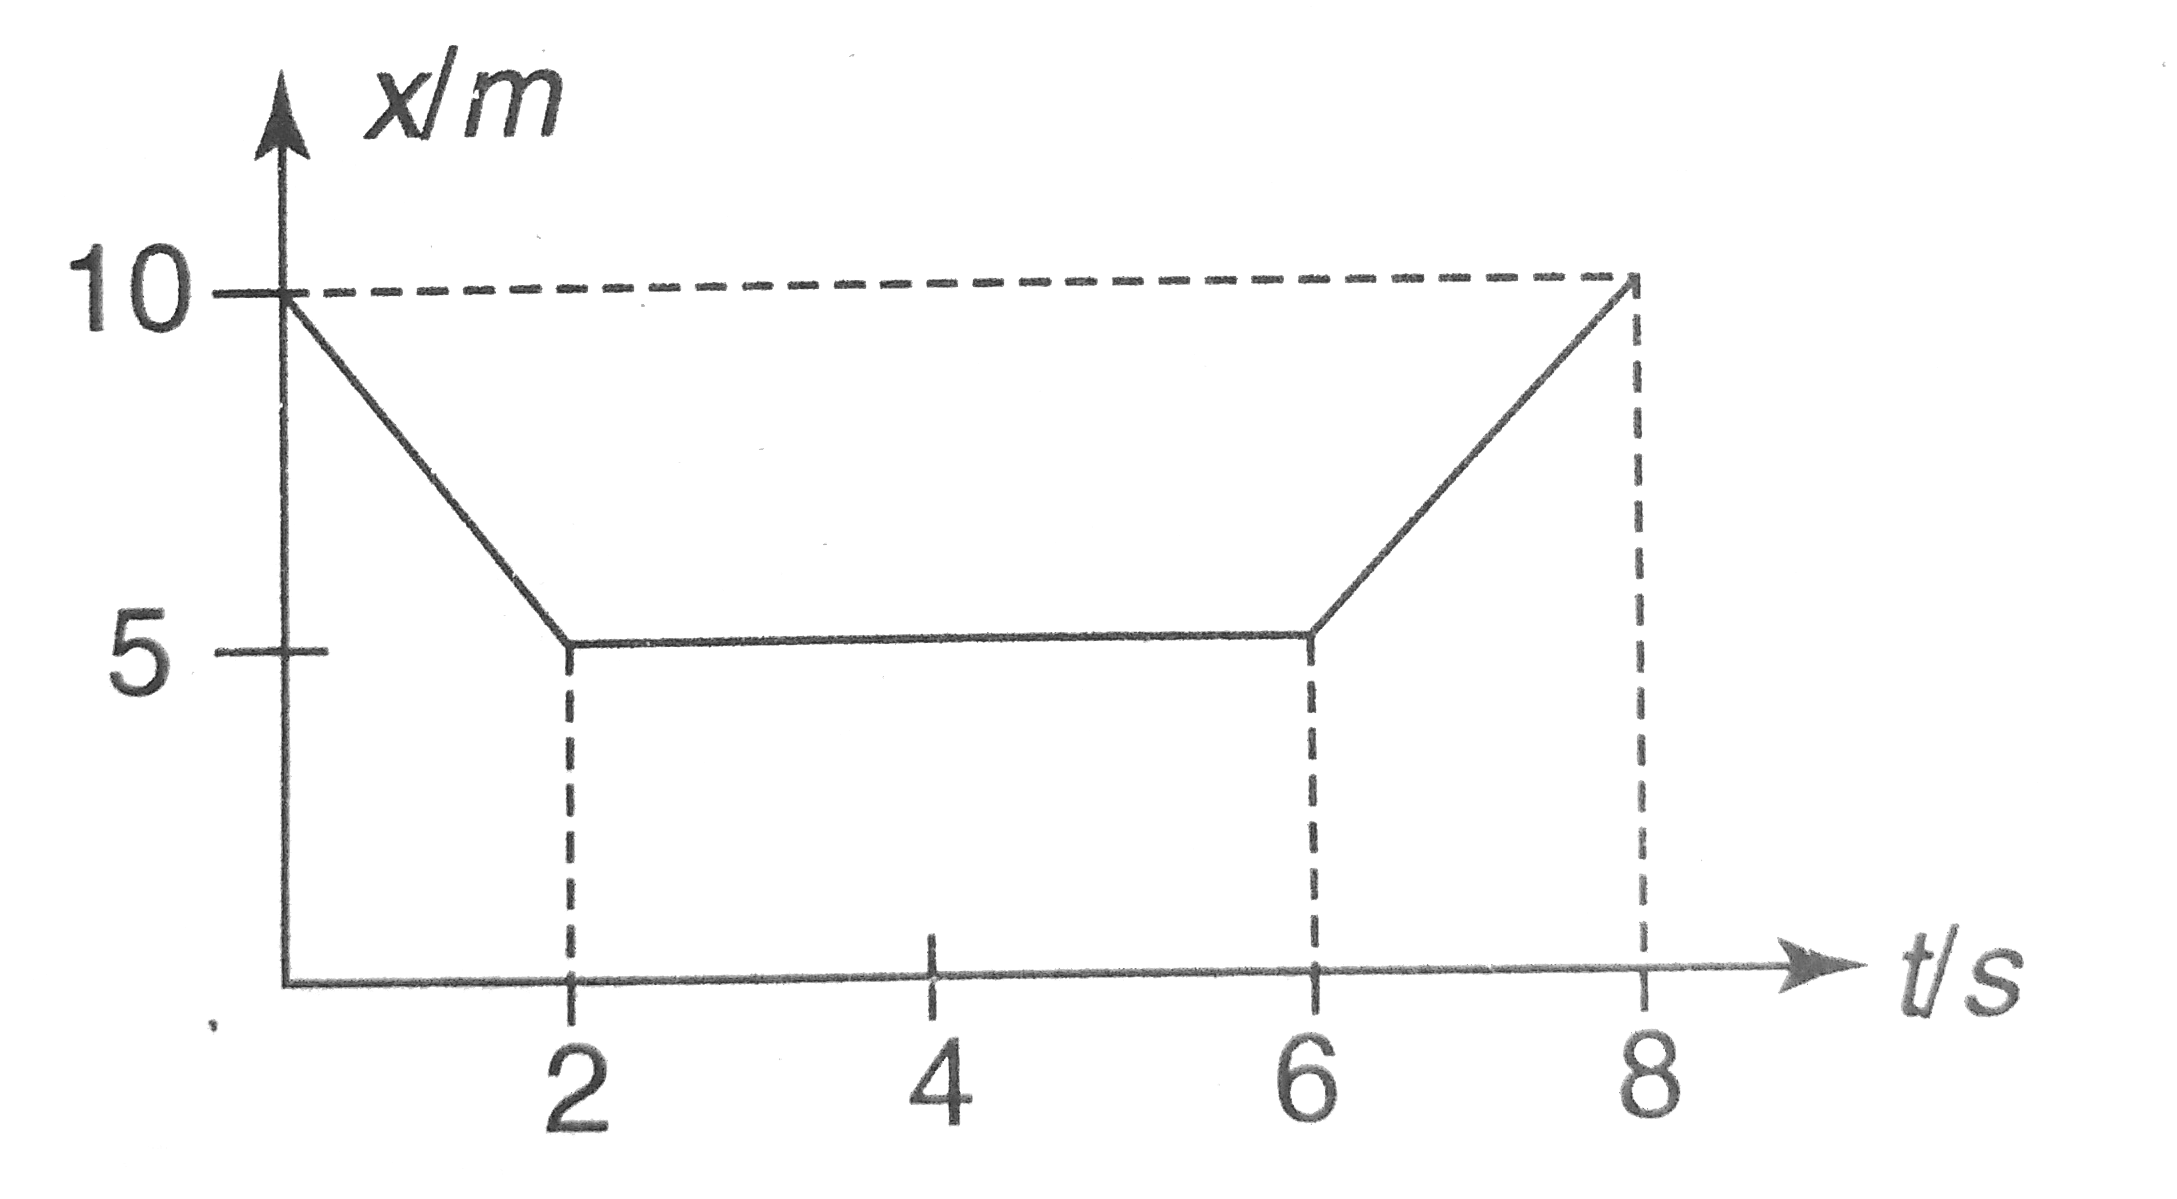
Figure shows the position time graph for a particle in one dimensional motion. What is the displacement of the particle in first 4 seconds ?
 A5 mB−5mCzeroD15 m
Position - time graph for motion with negative acceleration is
A B
B C
C D
D
Accleration vs time graph of a particle starting from rest is given. Find the displacement of particle in first 2 seconds.
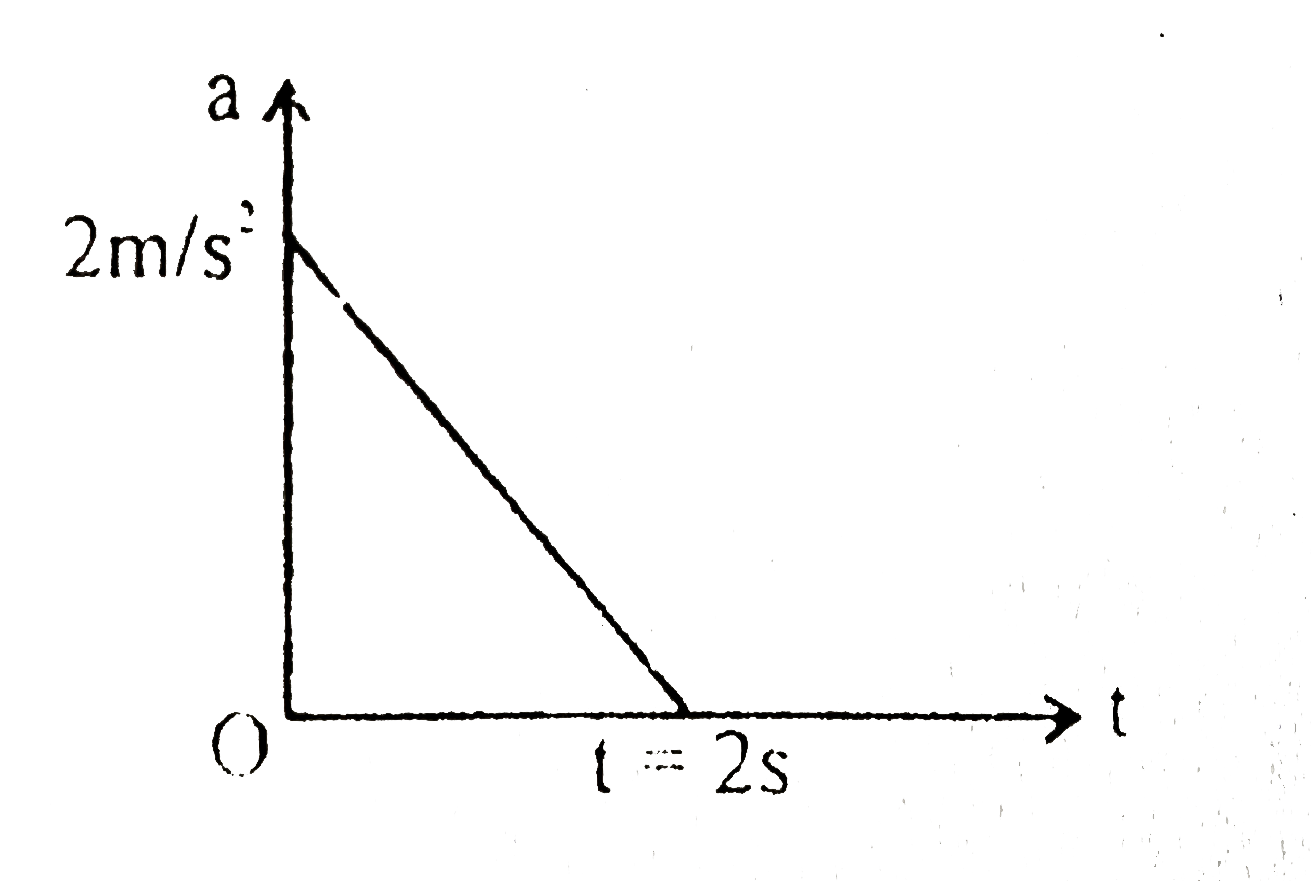 A38B83C43D316
Figure 3.E2 shows the velocity -time graph for a particle moving in a fixed direction. Find the acceleration of the particle.
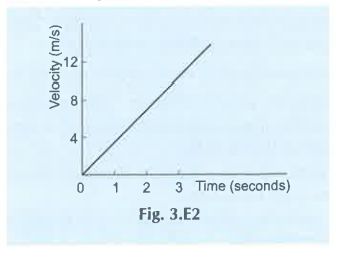
View SolutionPosition-time graph for motion with zero acceleration is
View SolutionAcceleration time graph of a particle moving along a straight line is given. Then average acceleration between t=0 & t=4 is :−
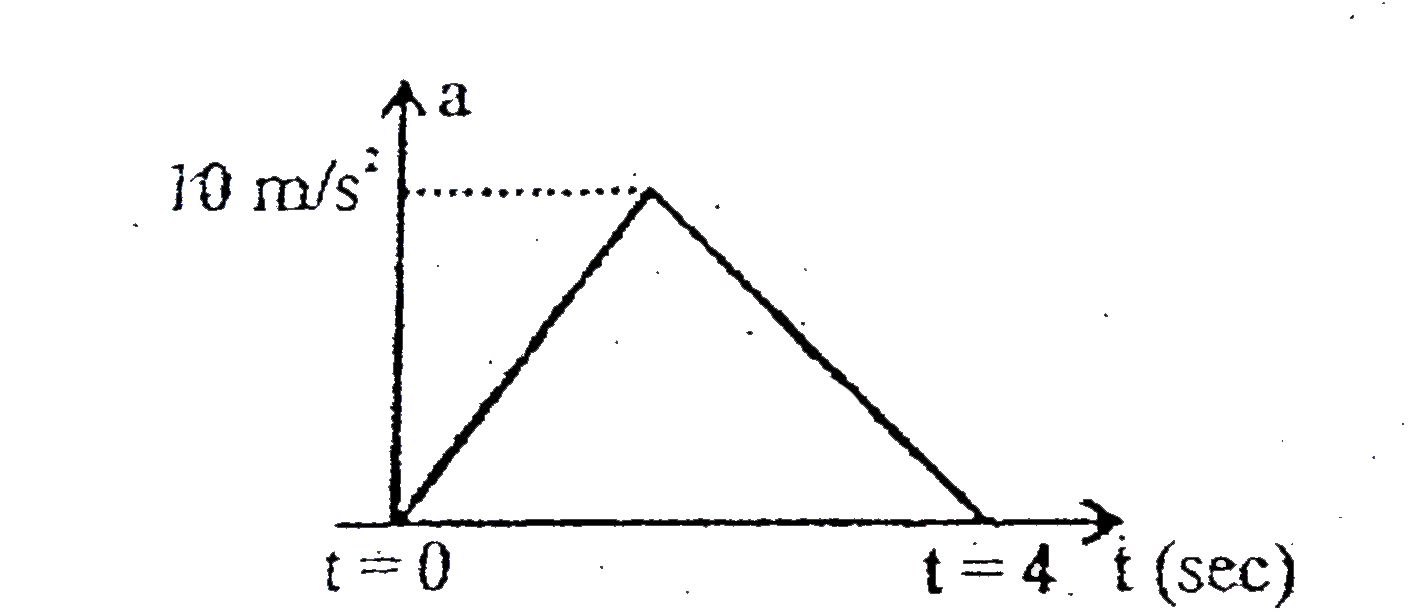
View SolutionThe velocity-time graph of a particle is not a straight line. Its acceleration is
View SolutionFigure shows the position the graph for a particle in one dimensional motion. Which of the graphs in fugure represent the variation in the velocity of the particle with time ?
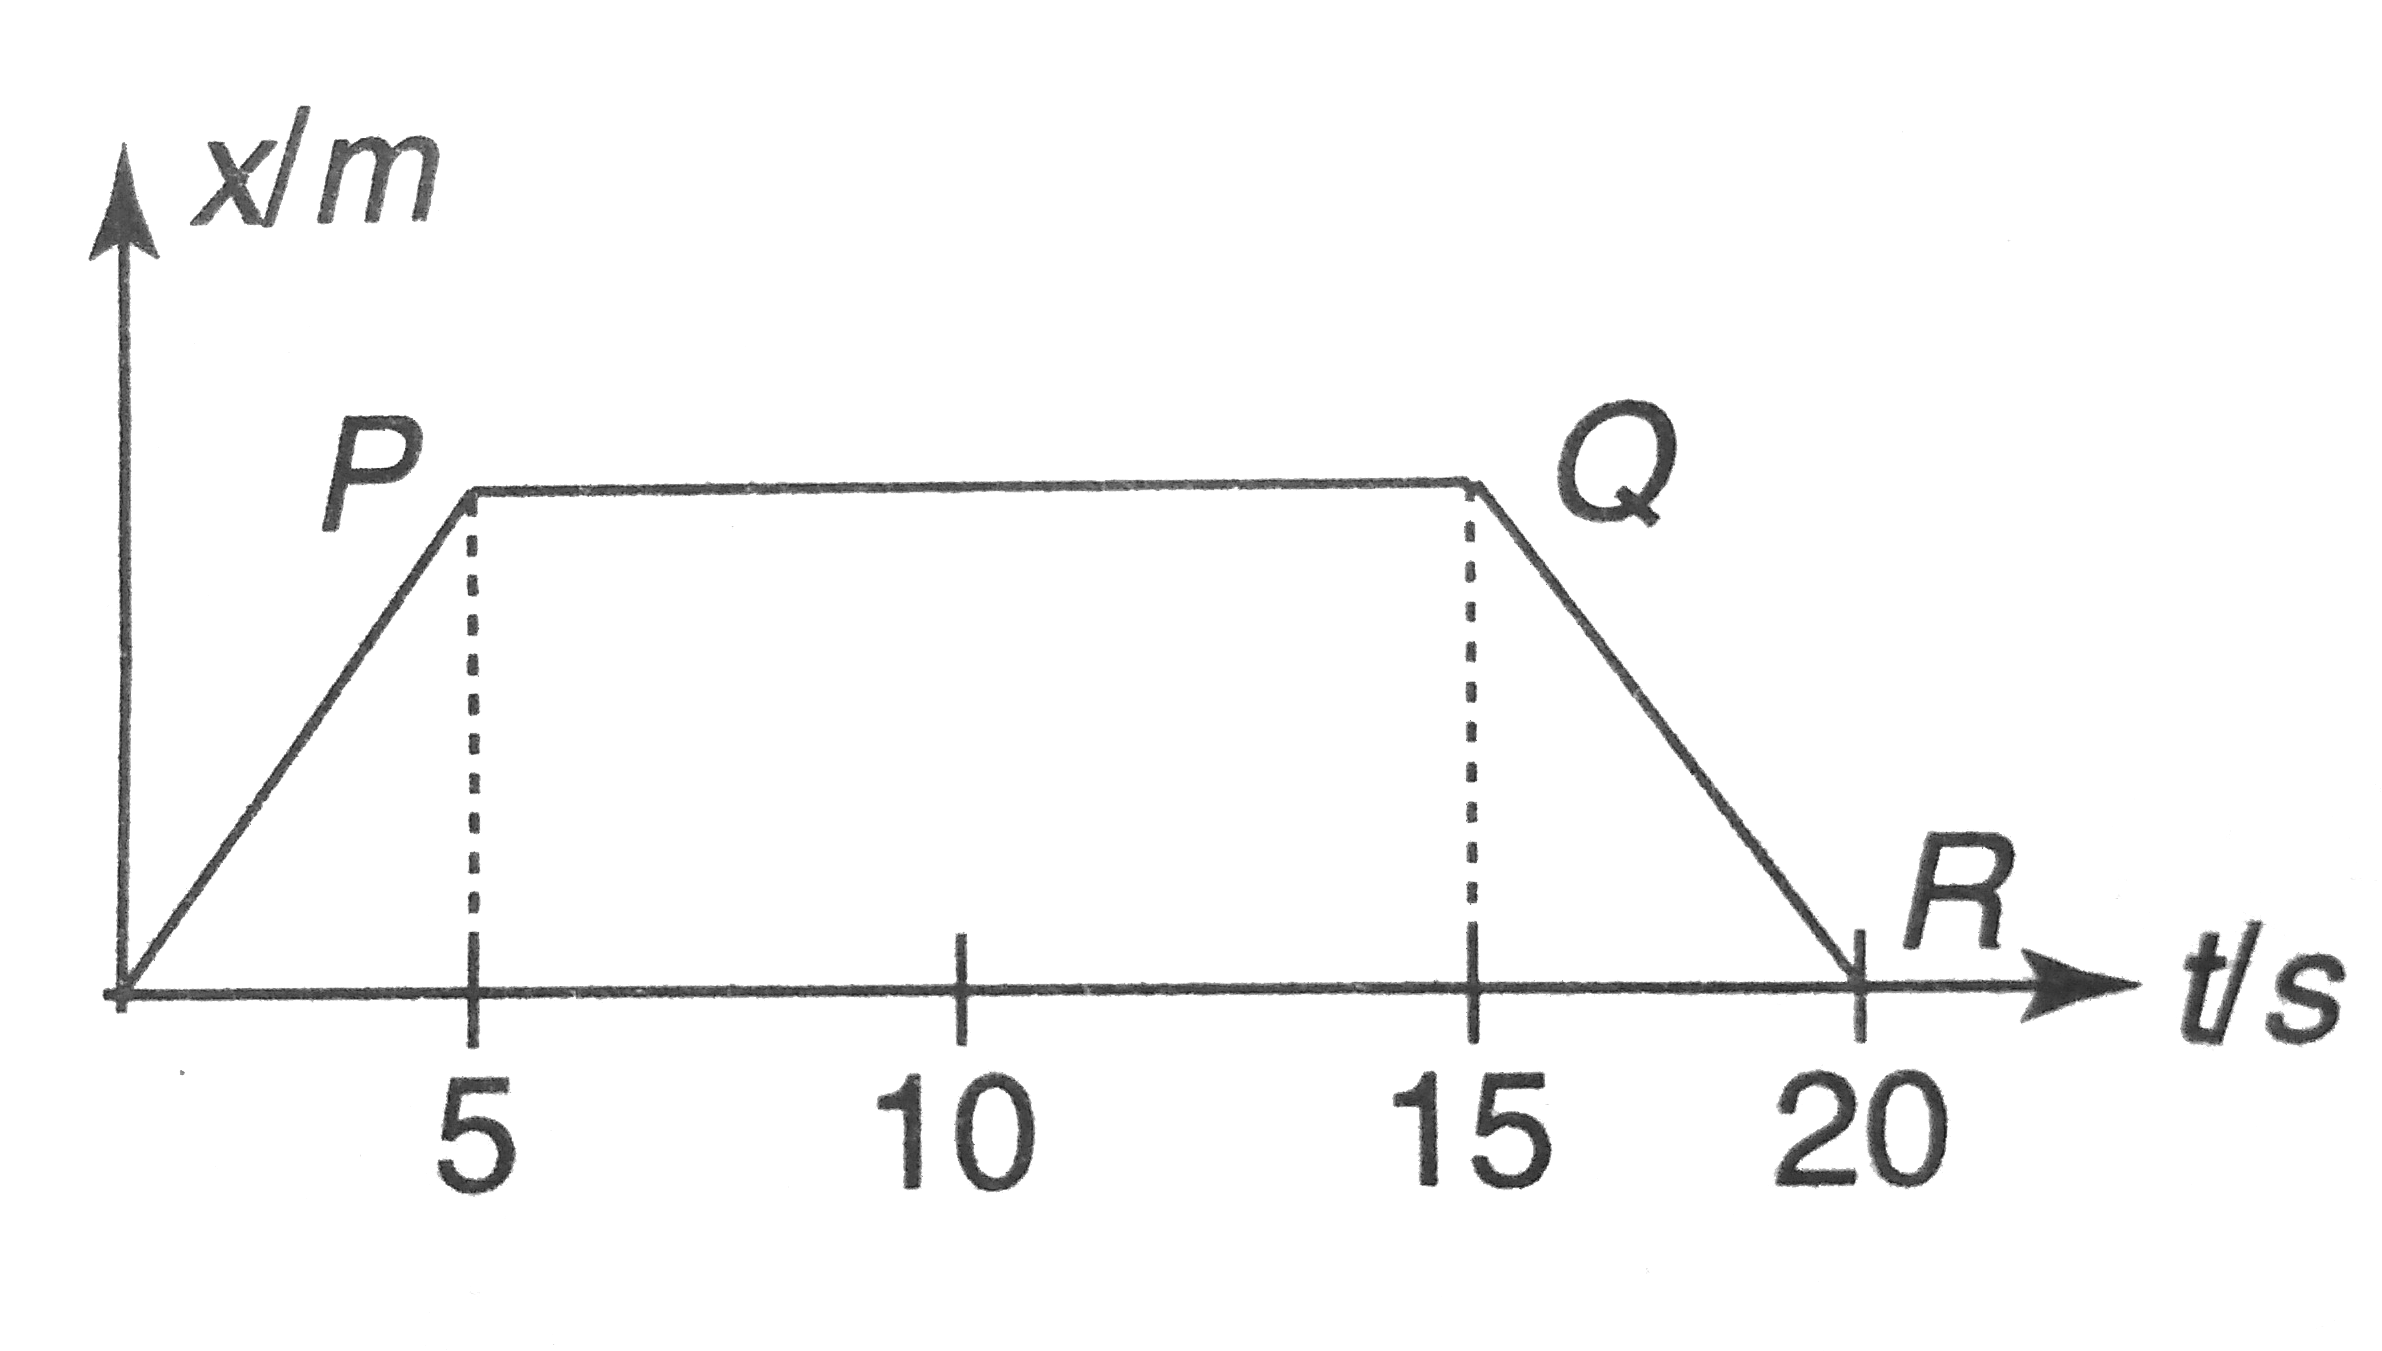
View Solution


