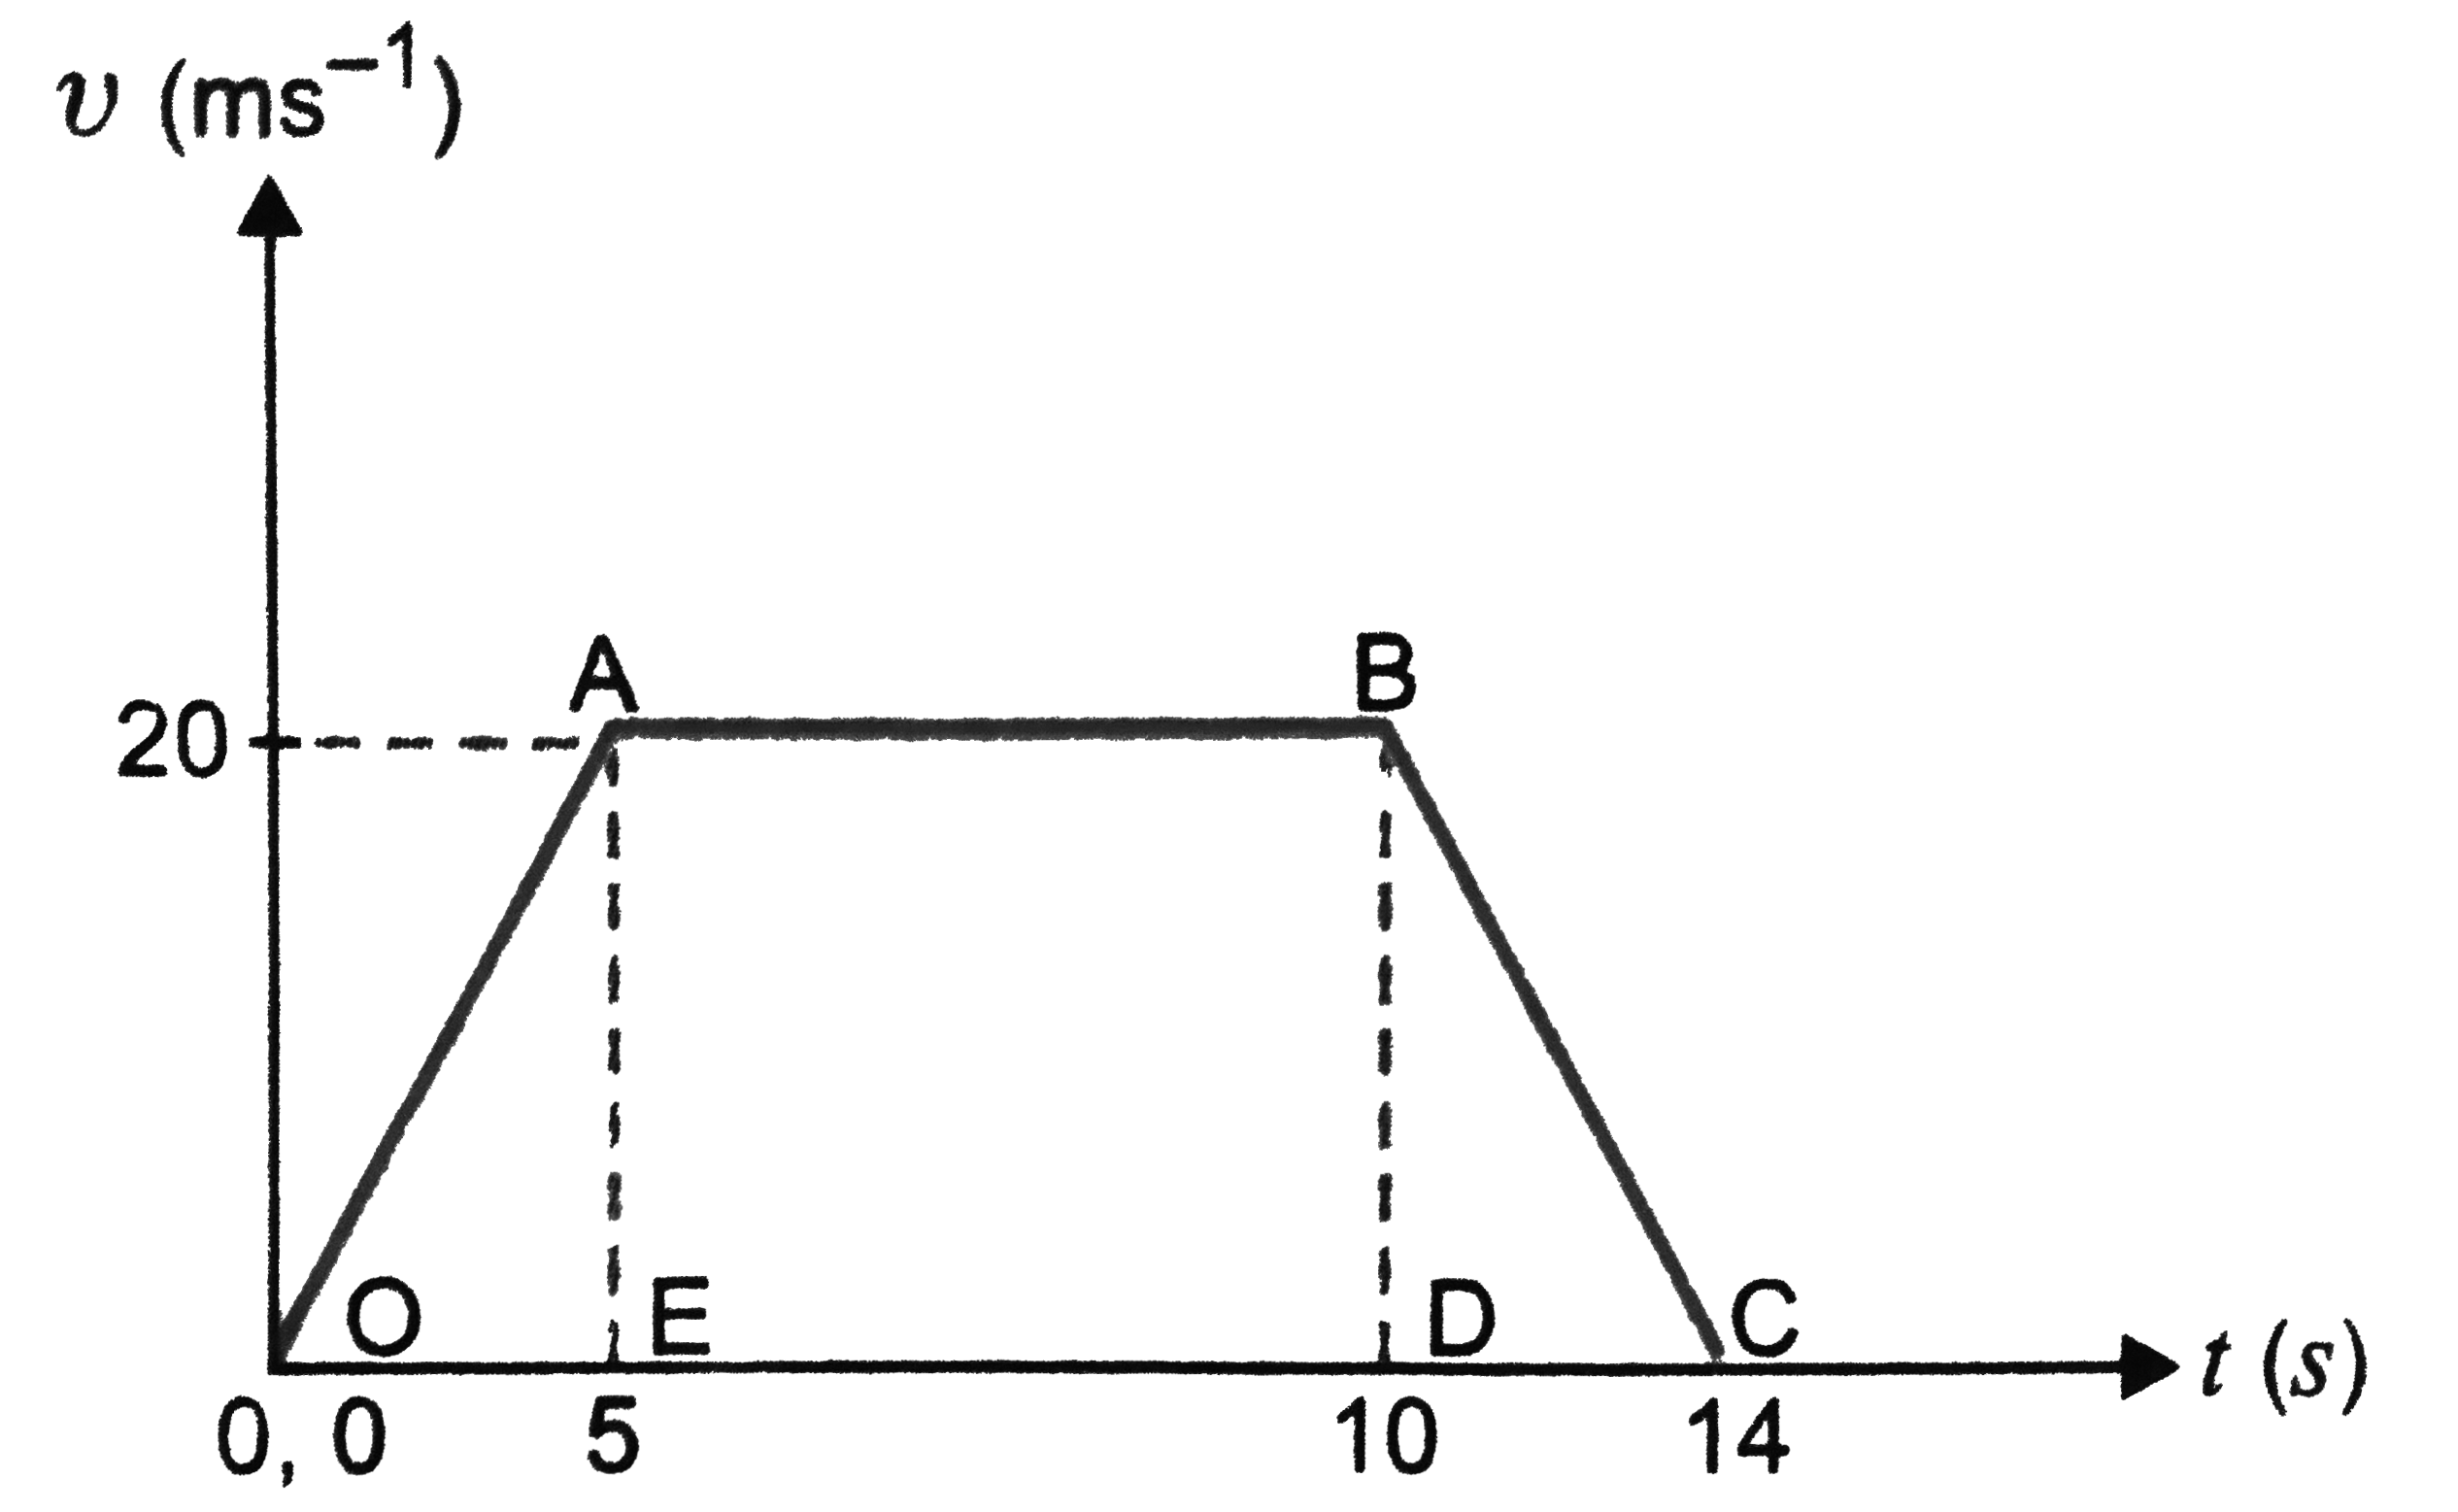
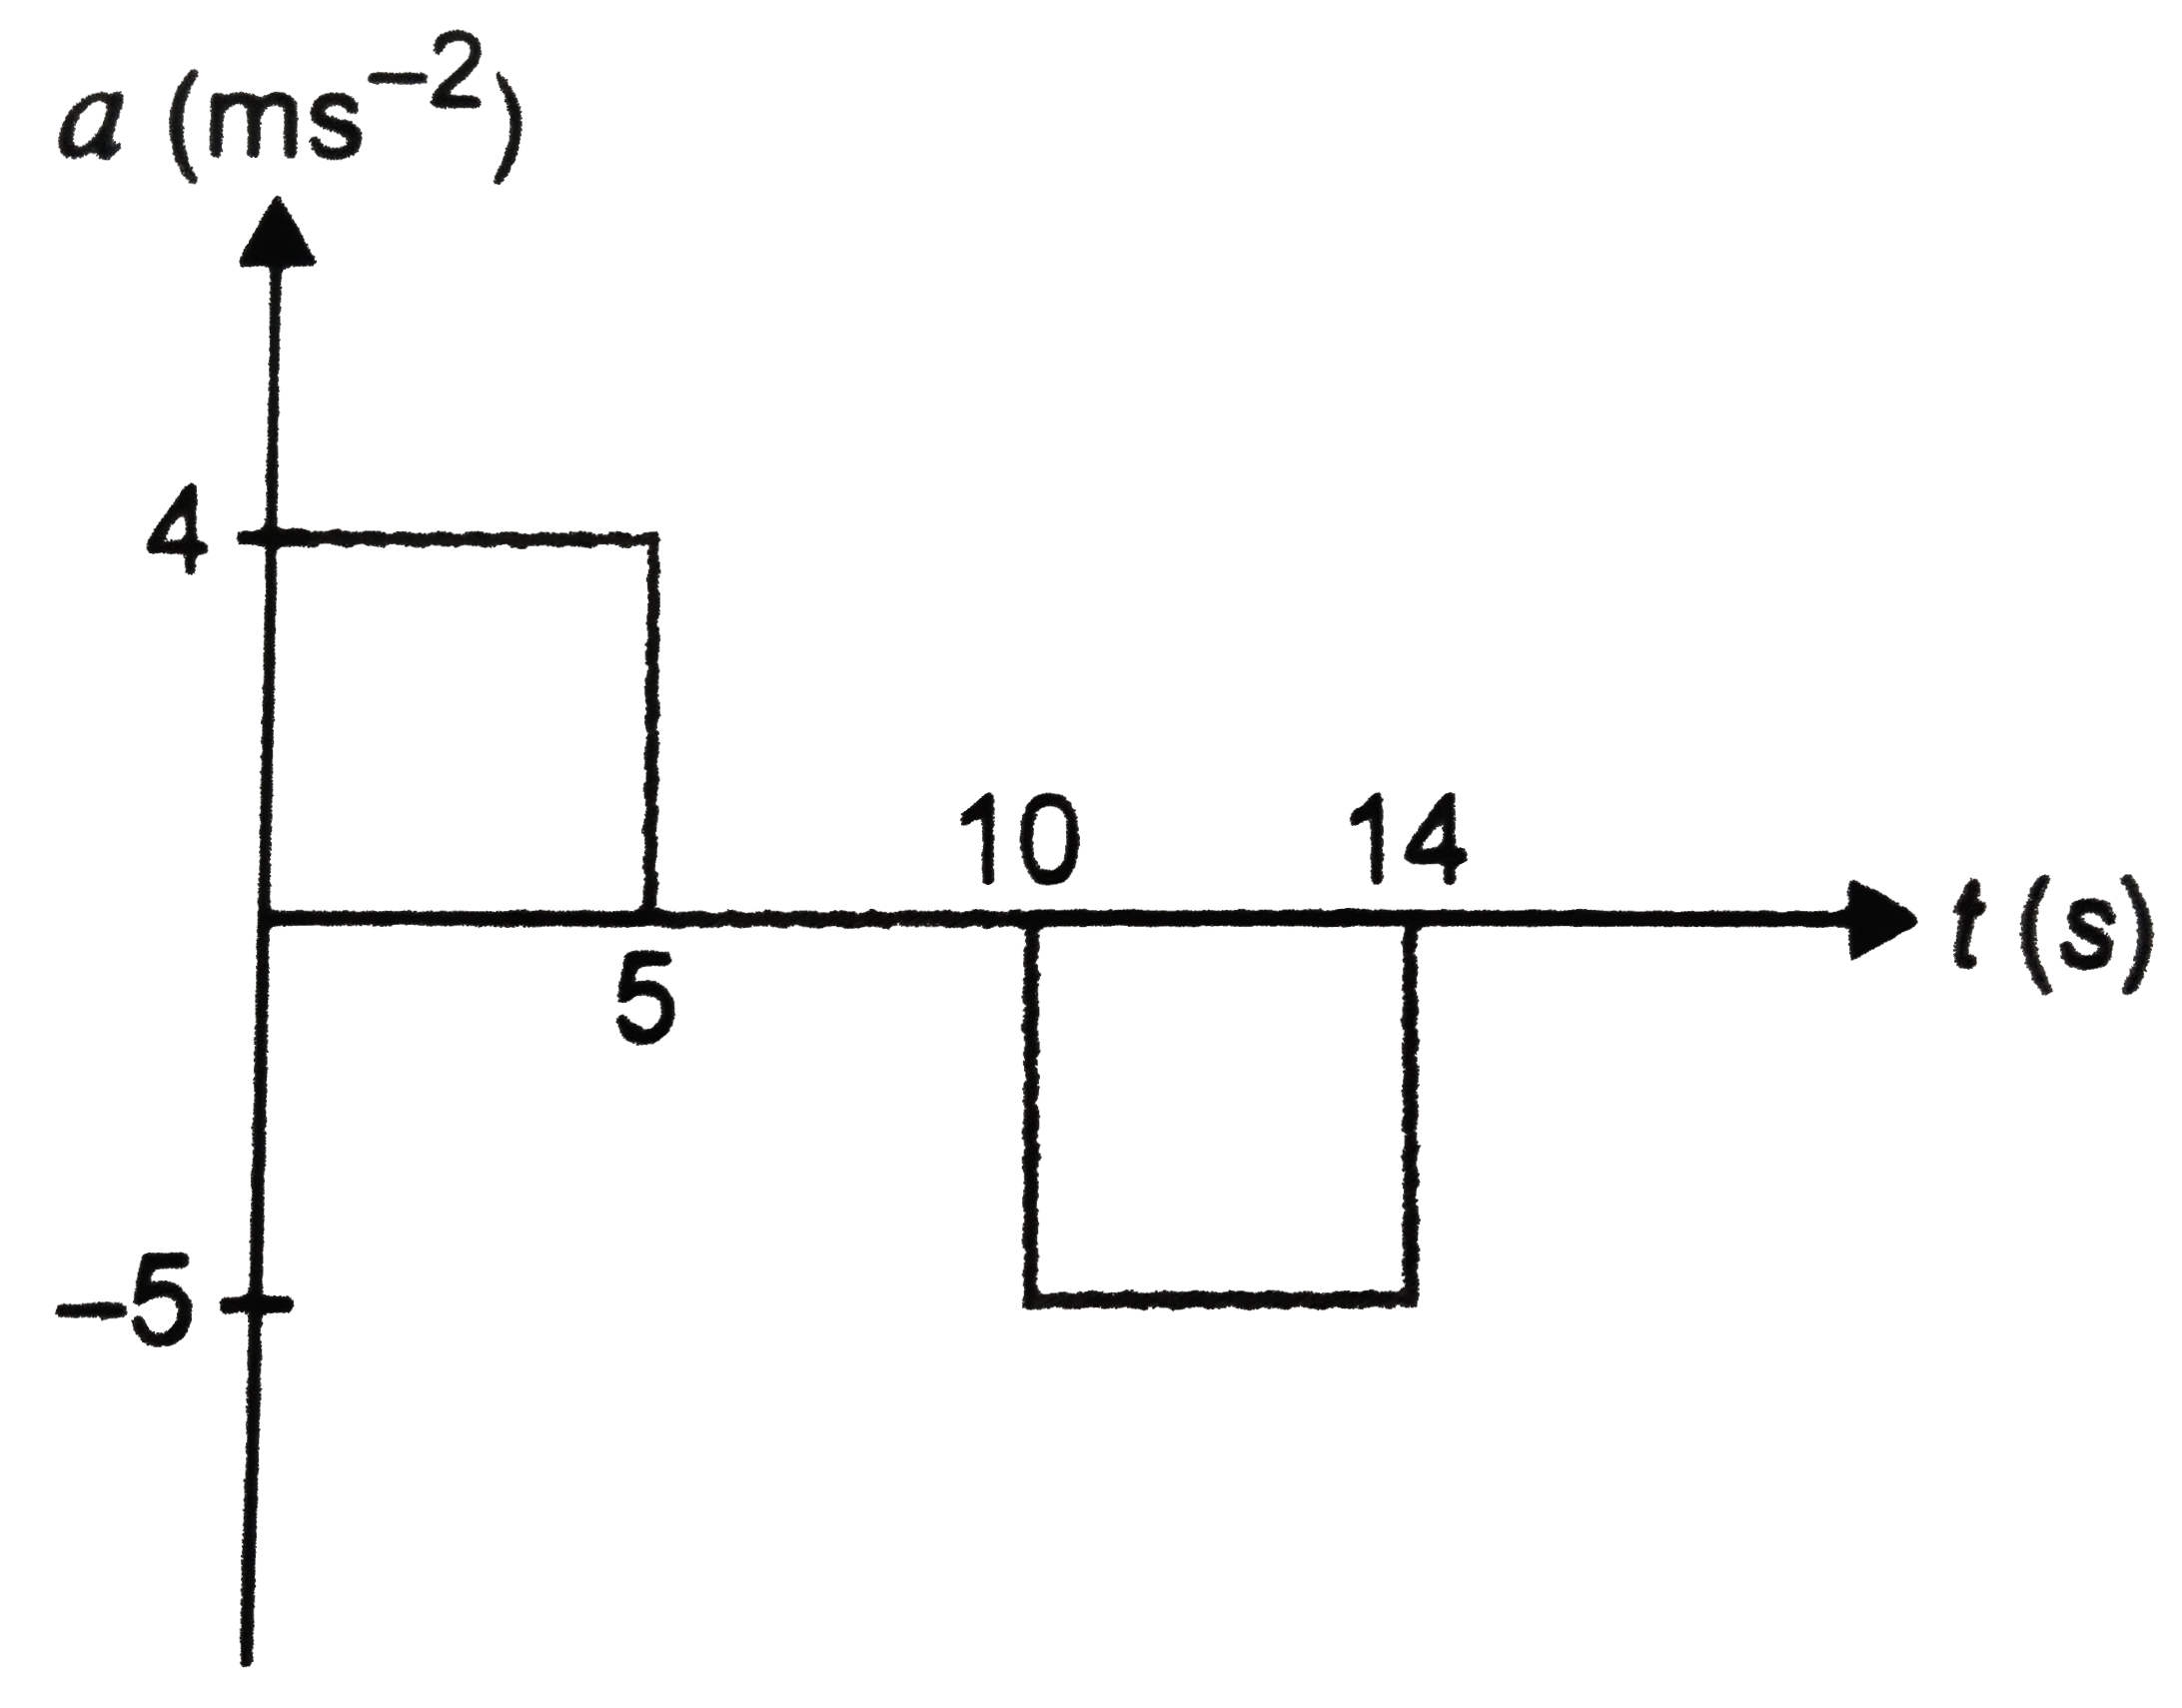
Velocity (v) time (t) graph of a car starting from rest is shown in Fig. 2(b). 13. Draw acceleration (a) -time (t) graph for the motion of the car and find total distance travelled by car.
 .
.
For the graph we bote that car starting from rest acclerates for time 0→5 s and attains a velcity 20ms−1 from 5s→10s. After that the motion of car is retarde for time 10s→14s and it comes to rest at time t=14s.
For time t0→t=5a,theae≤rationofcar<br>=slope of v−tgraph(20-0)/5 =4 ms^(-20.<br>Fortimet=10 s =10s, velocity of car is constant, hence acceleration is zero.
For time t=10s→t=14s
Acceleration of car =slpeofv-tgraphora=(0-200/4 =- ms^(-2)<br>Thusa≤ration(a)−time9t)graphisofthetypeasshown∈Fig.2(b).14.<br>Totaldistancetravel≤dbycar∈14 seconds =AreaOABC
=areaofDelta OAE +Area of squareabde<br>=(20 XX50/2 +(20XX5) + (20 XX4)/2<br>=50 +100 +40 =190 M
 .
.
Topper's Solved these Questions
- KINEMATICSBook:PRADEEPChapter:KINEMATICSExercise:3 SolvedExamples
Explore 46 Videos
- KINEMATICSBook:PRADEEPChapter:KINEMATICSExercise:4 SolvedExamples
Explore 31 Videos
- KINEMATICSBook:PRADEEPChapter:KINEMATICSExercise:1 SolvedExamples
Explore 17 Videos
- GRAVIATIONBook:PRADEEPChapter:GRAVIATIONExercise:Assertion-Reason Type Questions
Explore 19 Videos
- LAWS OF MOTIONBook:PRADEEPChapter:LAWS OF MOTIONExercise:Assertion- Reason Type Questions
Explore 17 Videos
Similar Questions
Knowledge Check
The velocity time graph of the motion of a car is given here.
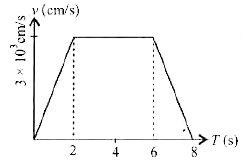 AThe distance travelled by the car in the first six seconds is 150 m.BThe deceleration of the car during the last two seconds are −15ms2.CThe distance travelled by the car in the first six second is 220 m.DThe deceleration of the car during the last two second is −20ms2
The velocity- time graph of car moving on a straight track is given below. The car weight 1000kg.
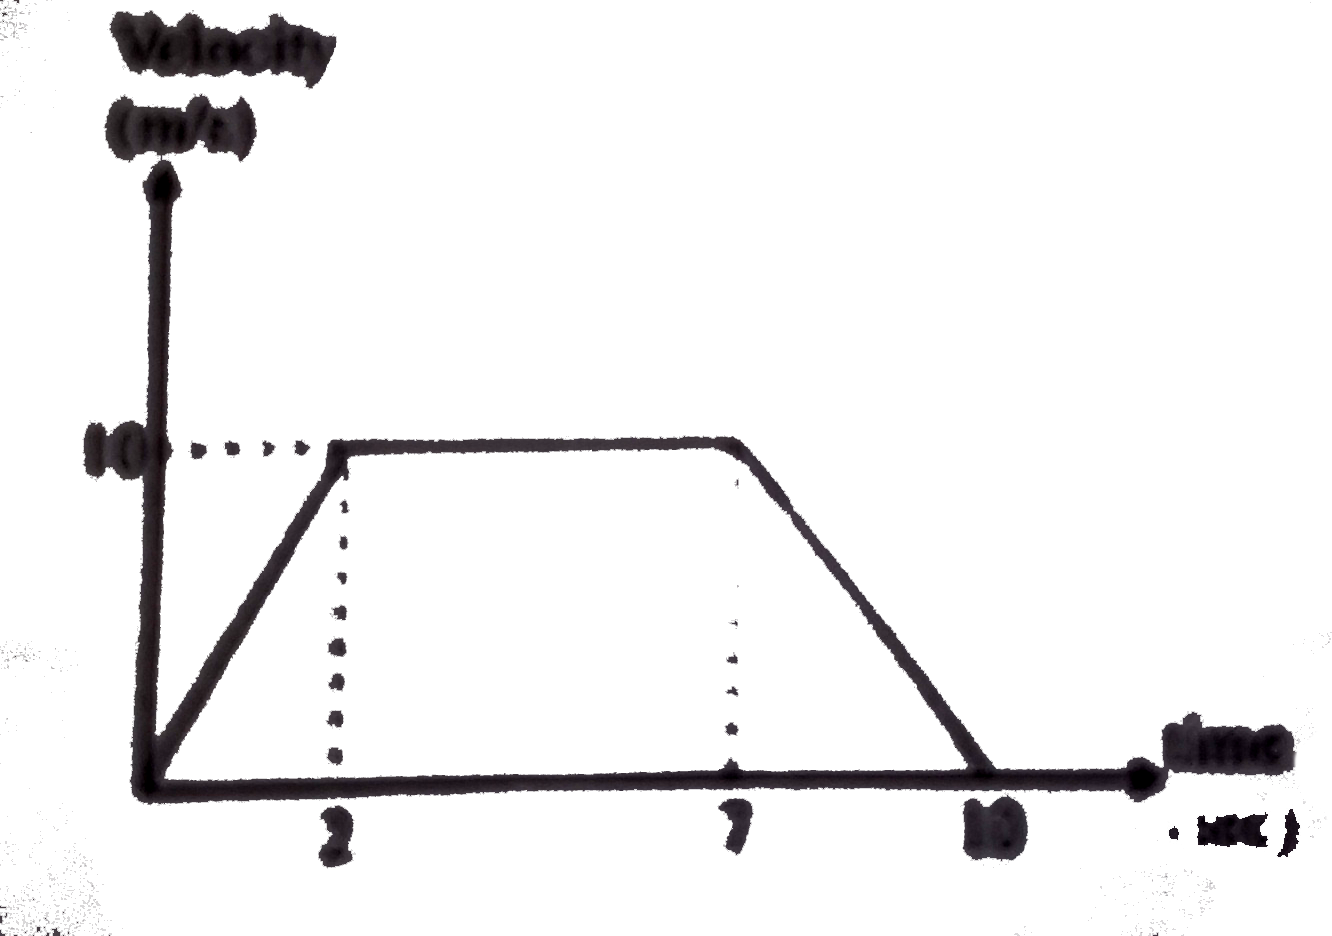 correct acceleration-time graph representing the motion of car is:A
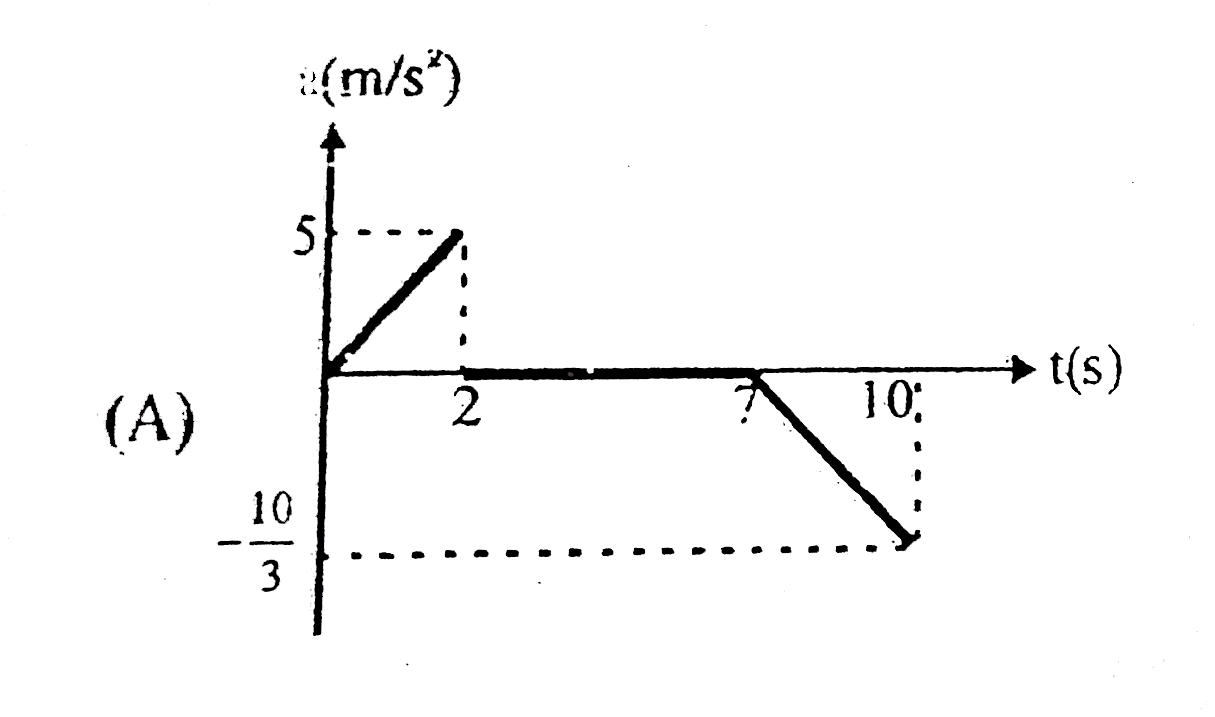 B
B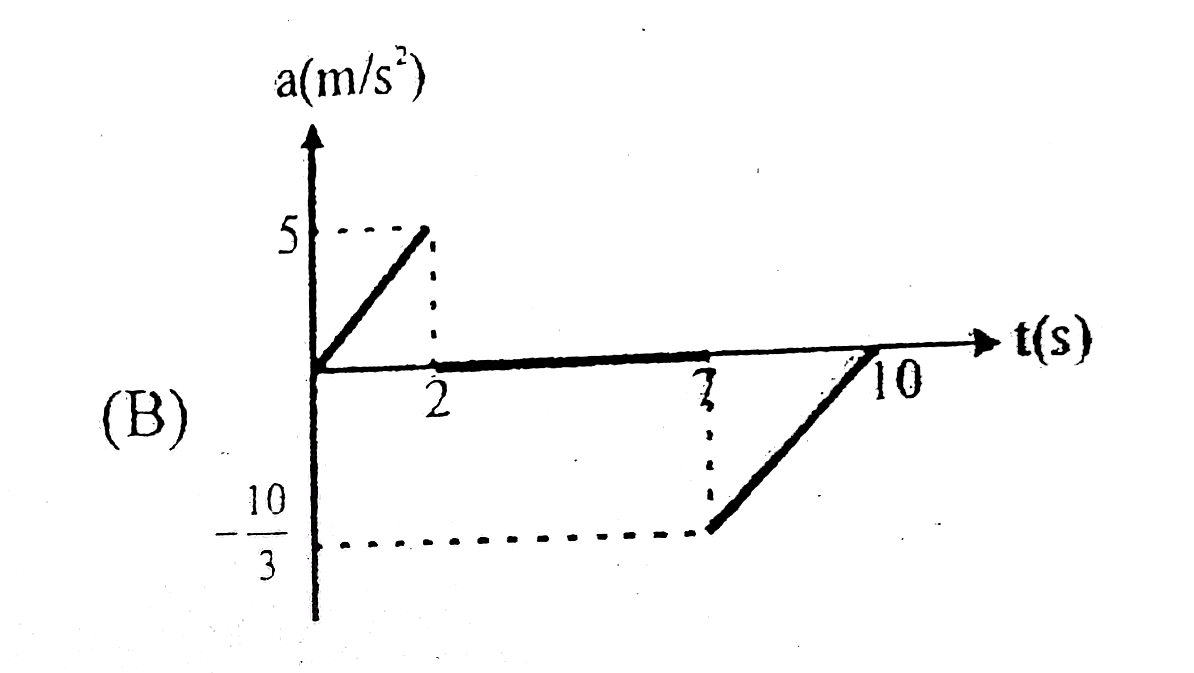 C
C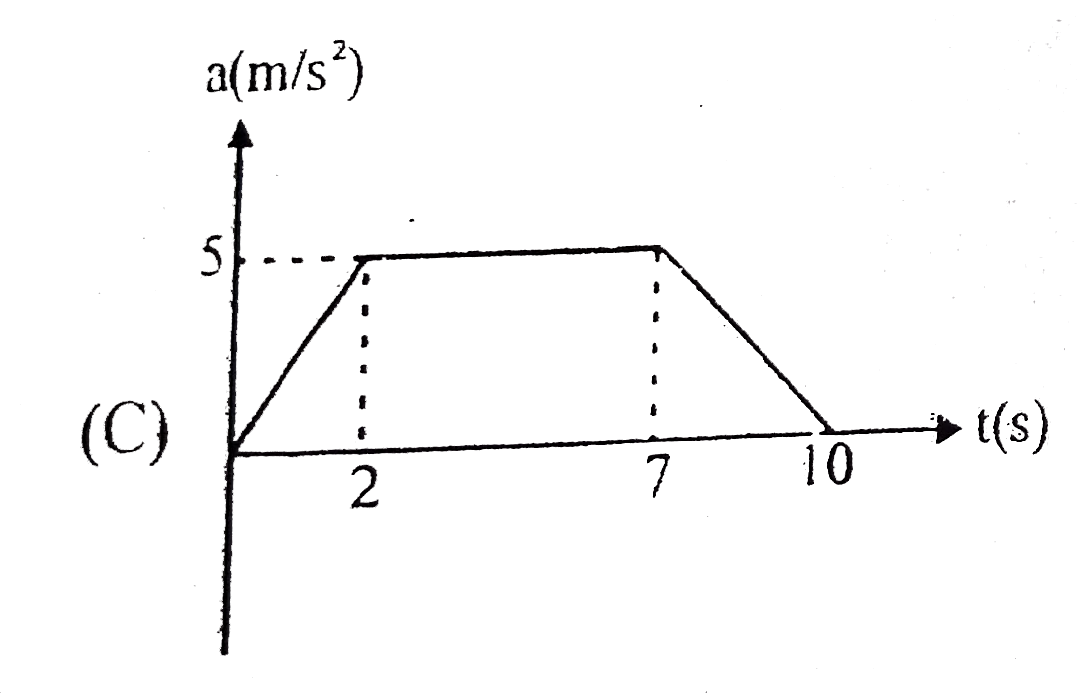 D
D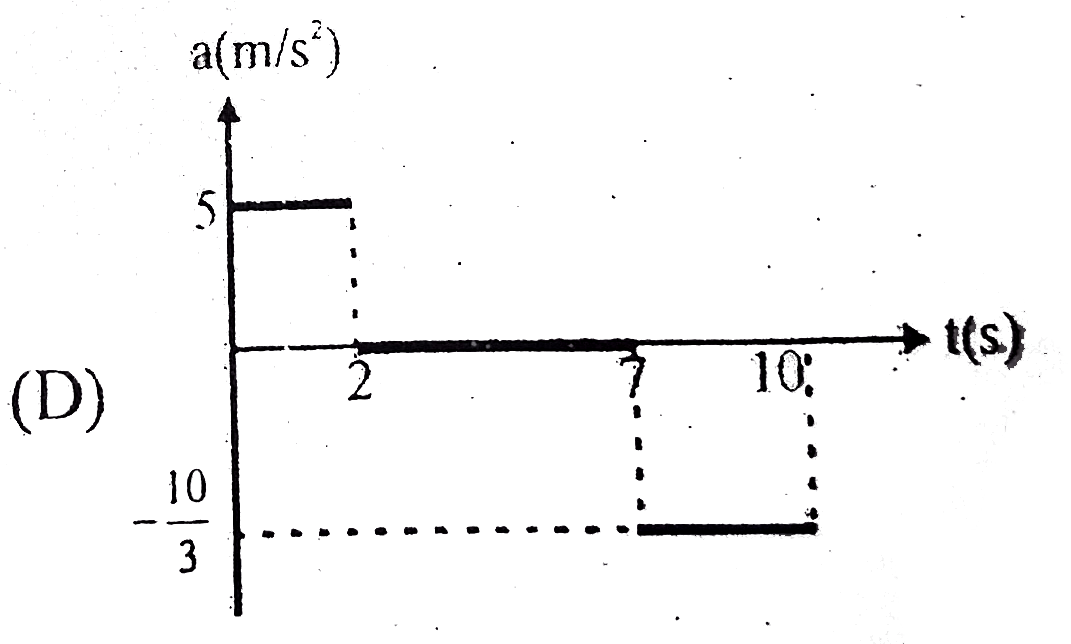
Acceleration - time graph for a particle is given in figure. If it starts motion at t = 0, distance travelled in 3 s will be
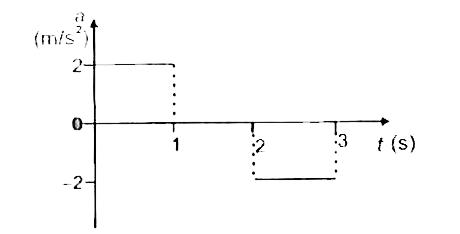 A4 mB2 mC0D6 m
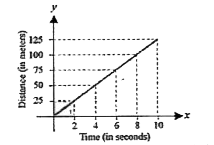
The distance versus time graph of a car is shown in the given figure.
View SolutionThe speed-time graph for a car is shown is Figure
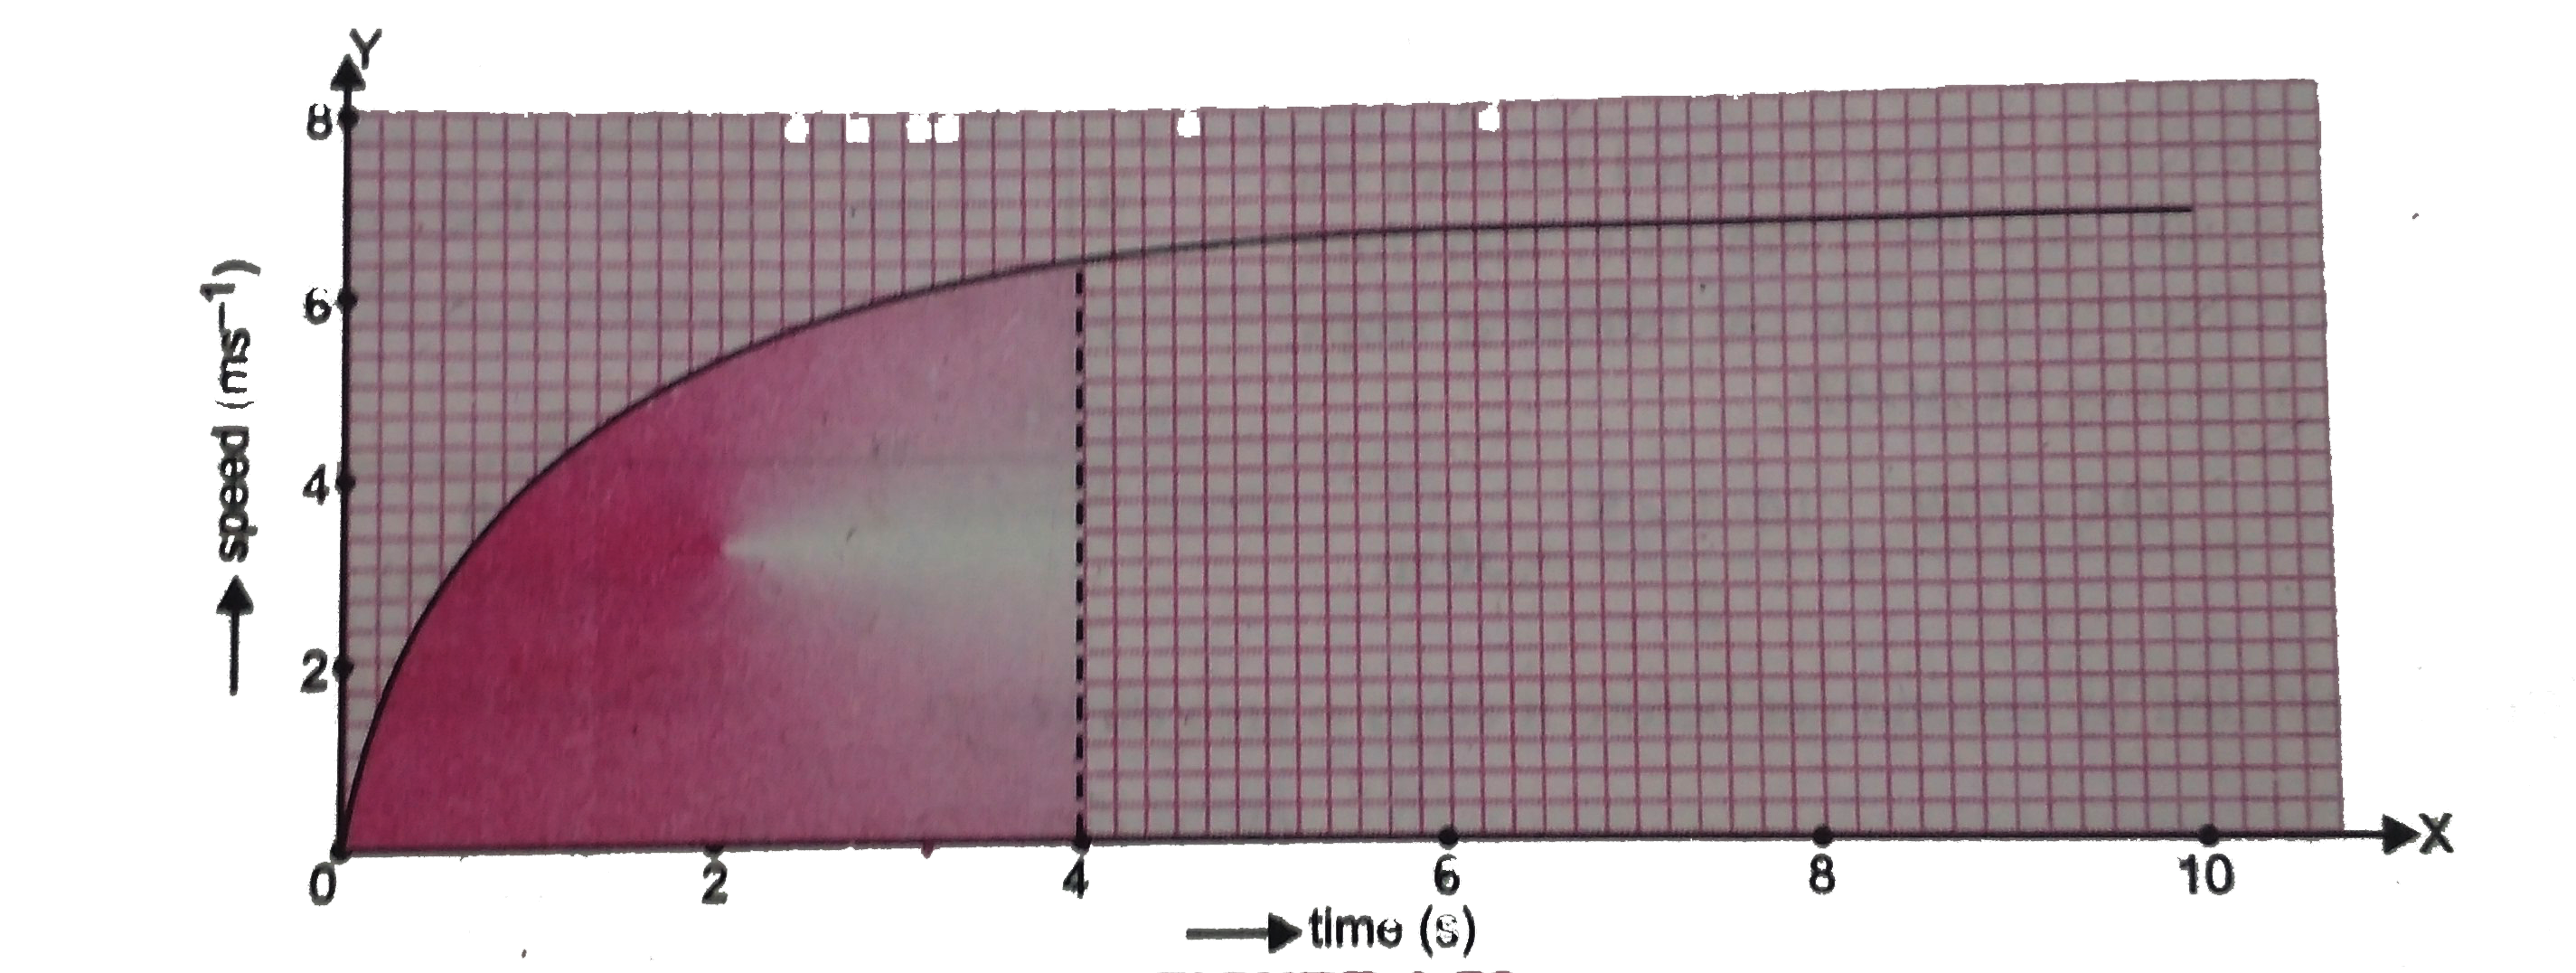
(a) Find how far does the car travel in the first 4 seconds. Shade the area on the graph that represents the distance travelled by the car during this period.
(b) Which part of the graph represents uniform motion of the car ?
View SolutionA car accelerates from rest at acionstant rate 36kmh∘ to comet to rest. If the total time elapsed id 1 hour, calculate (i) the maximum velocity attained by the car and (ii) the total distance travelled by car.
View Solutionstarting form rest a cars moves with unifrom acceleration and attians a velocity of 20ms−1and4s. It then moves what a unifrom velocity of 20ms−1 for 6s. The brakes are applied and the car is brought to rest in 10s under unifrom retardation . Draw the velocity group for the motion. using theis graph , find (i) the acceleration of the car during the frist 4 s (ii) ua retardation during the last 10 s and (iii) the total distance traveled by the car .
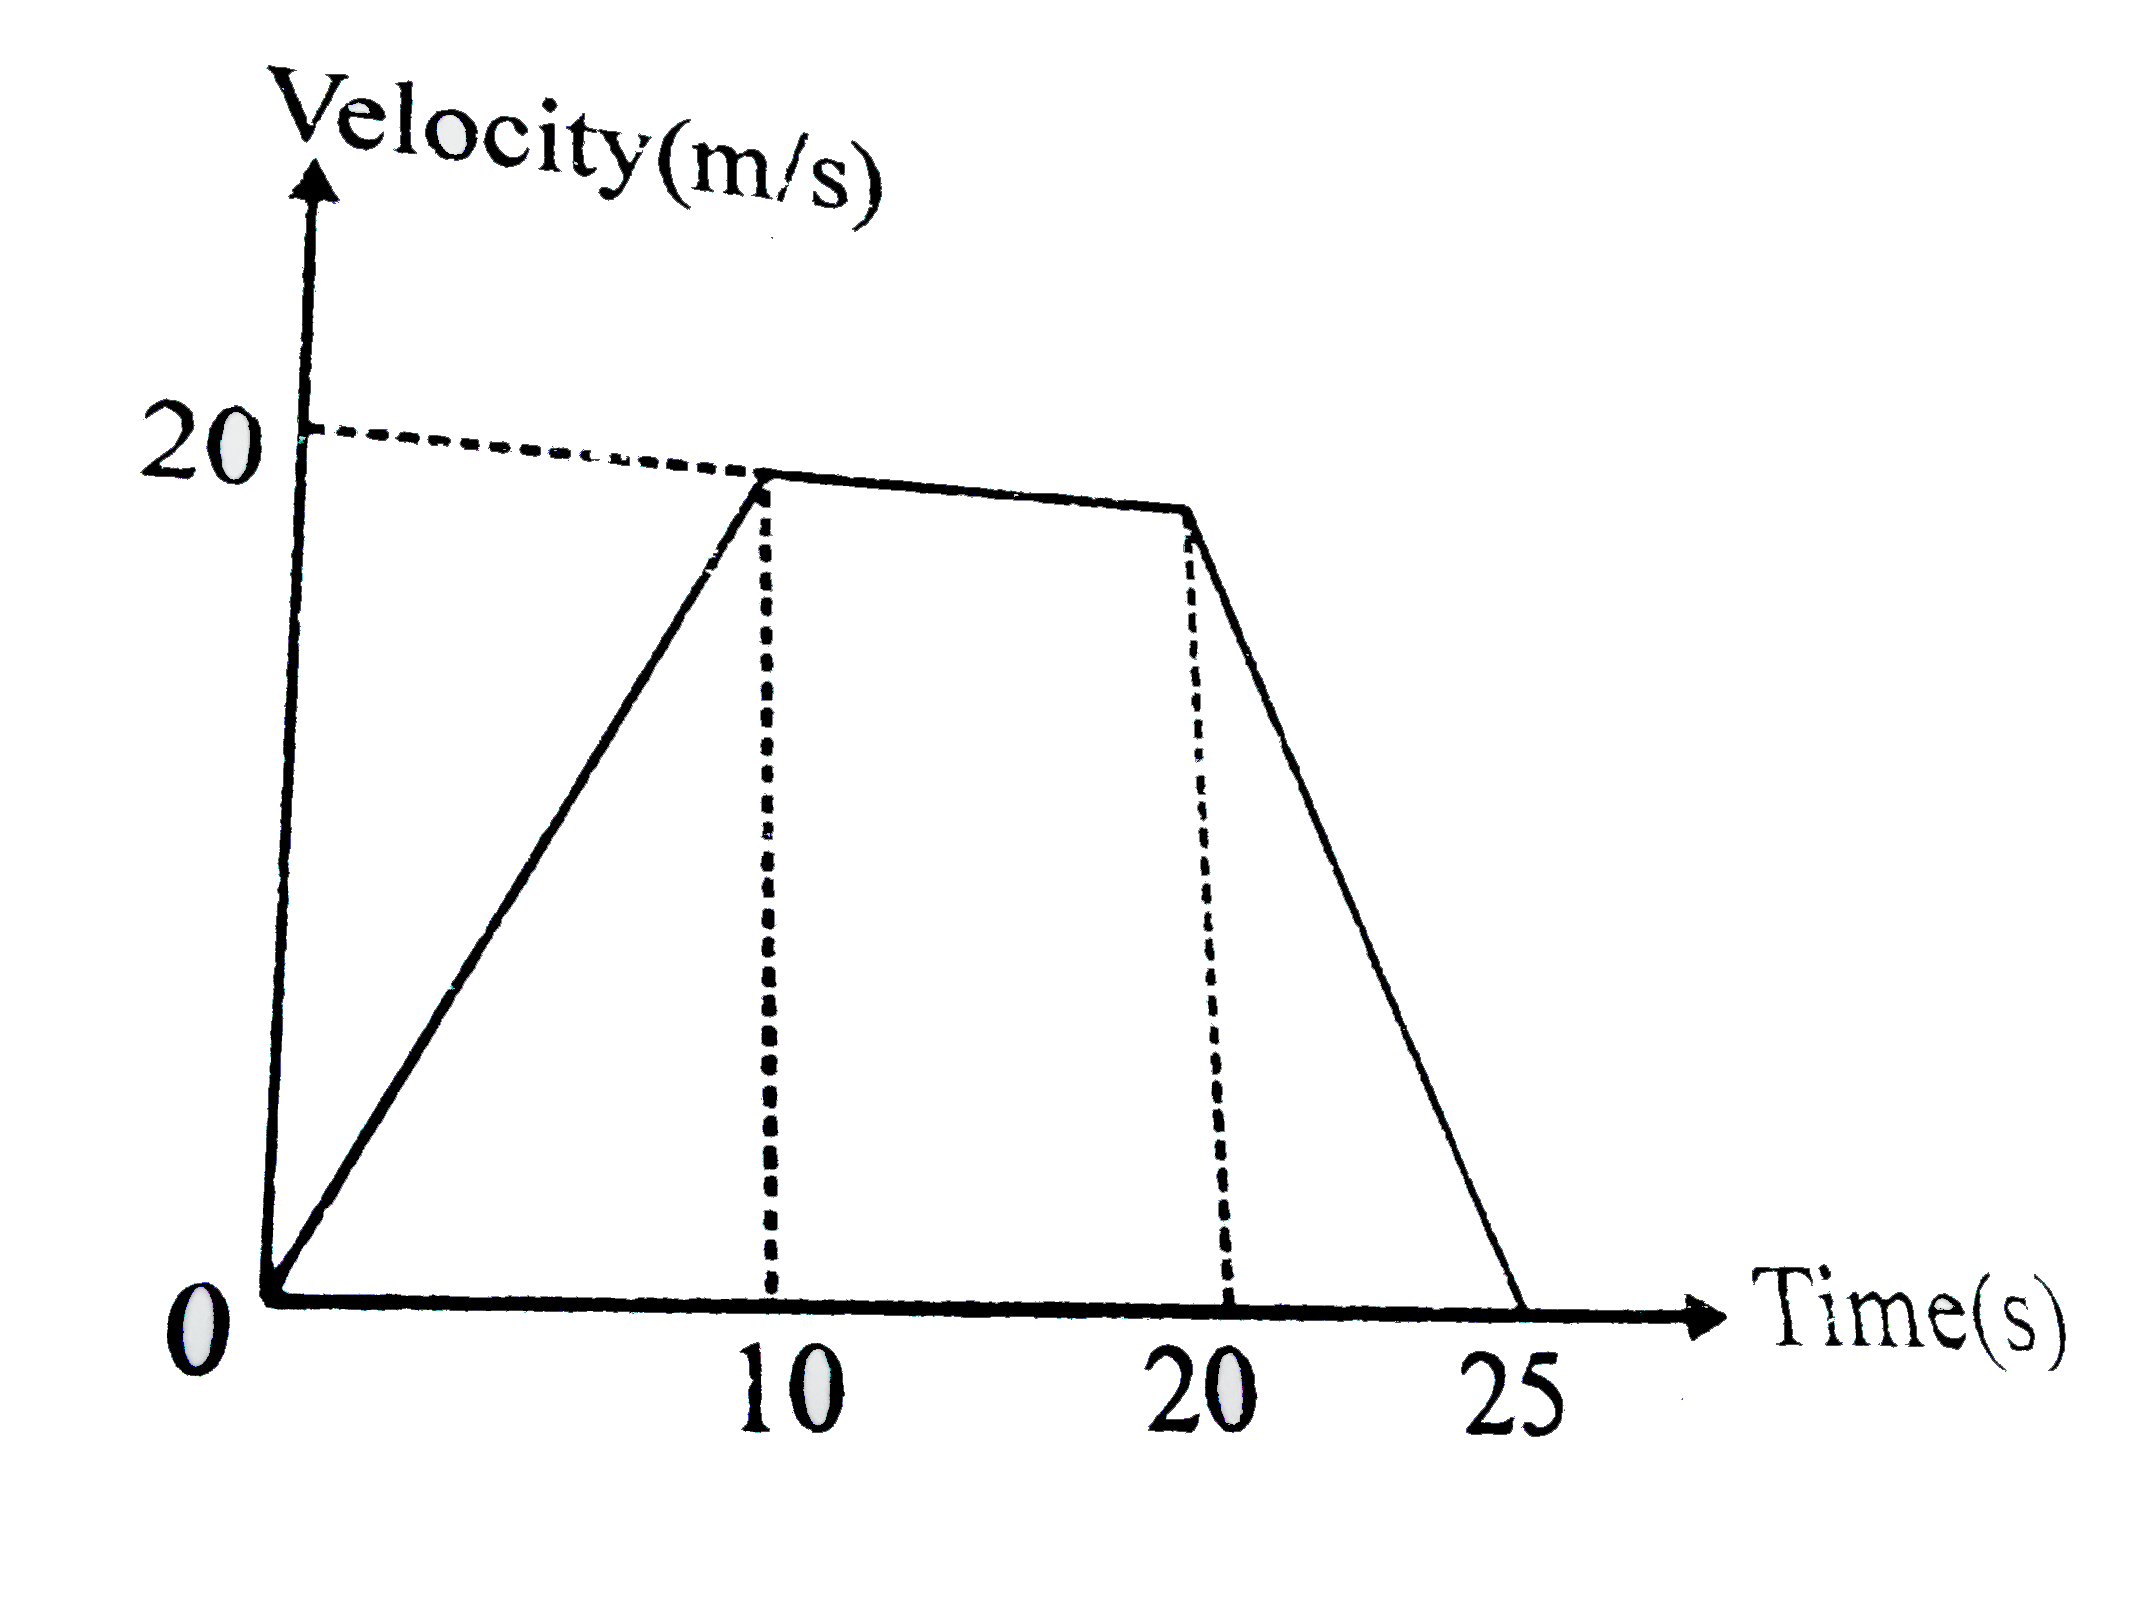
View SolutionThe velocity-time graph of a car moving along a straight road is shown in figure. The average velocity of the car in first 25 seconds is
View Solution


