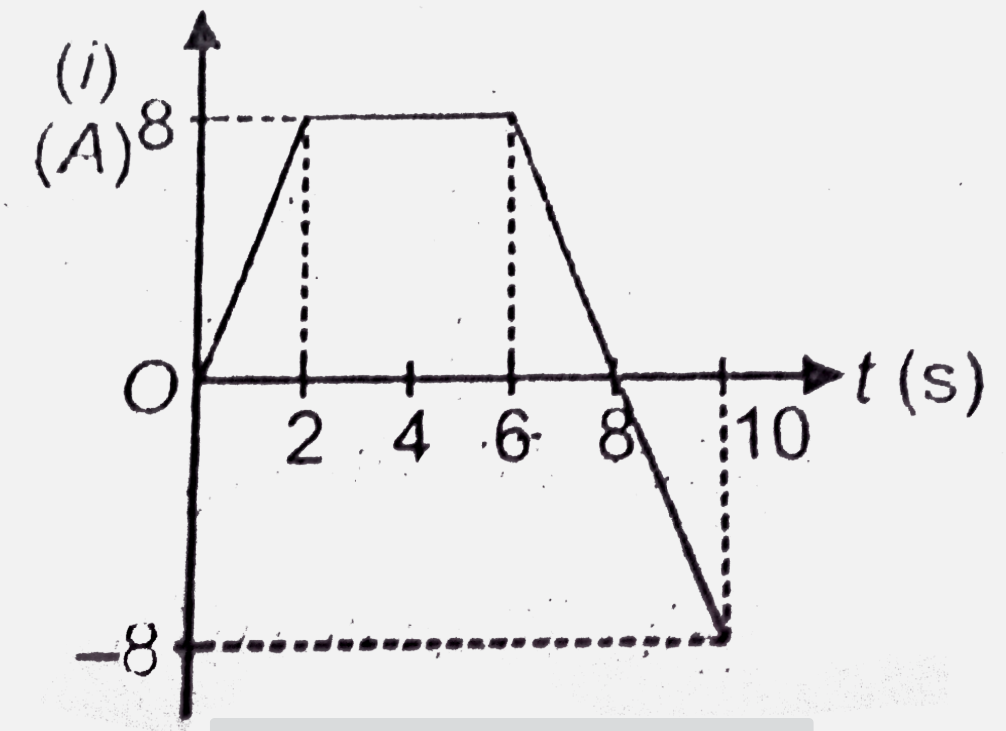
The current through the coil in figure (i) varies as shown in figure (ii). Which graph best shows the ammeter A reading as a function of time?

(a) 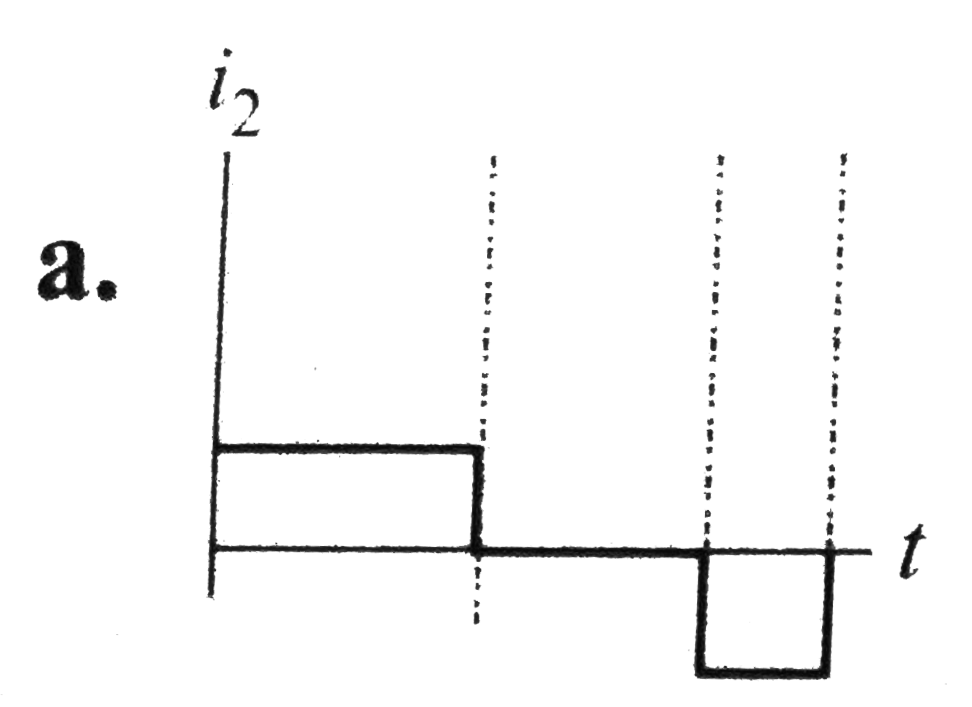
(b) 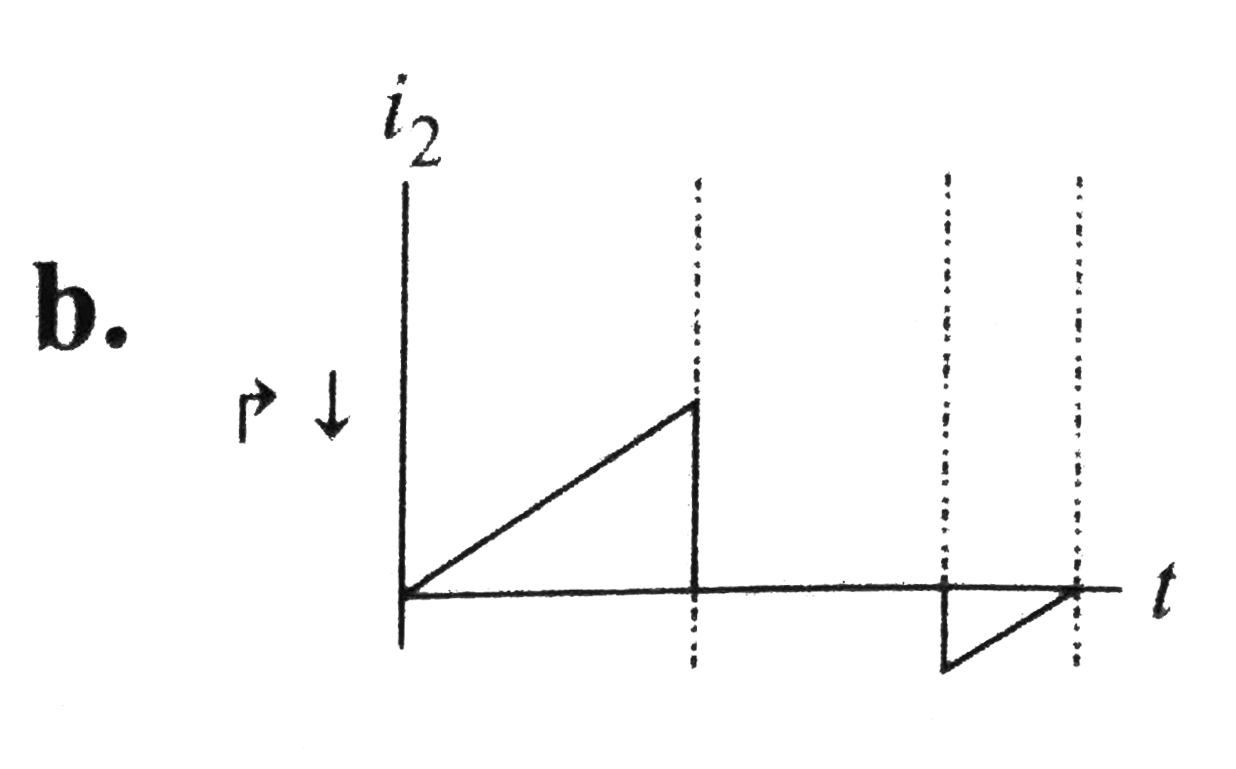
( c) 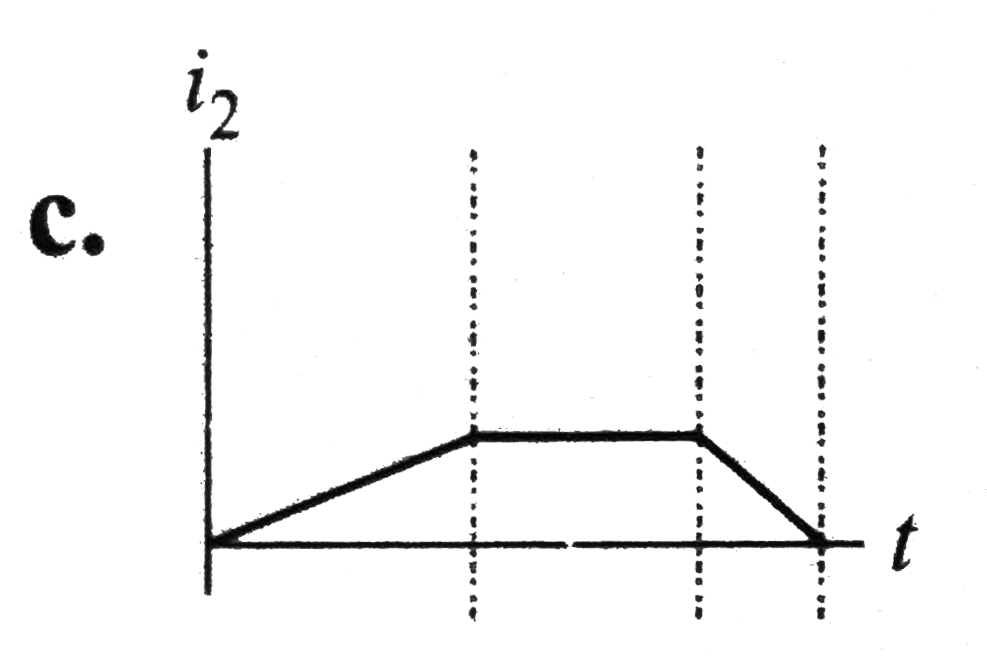
(d) 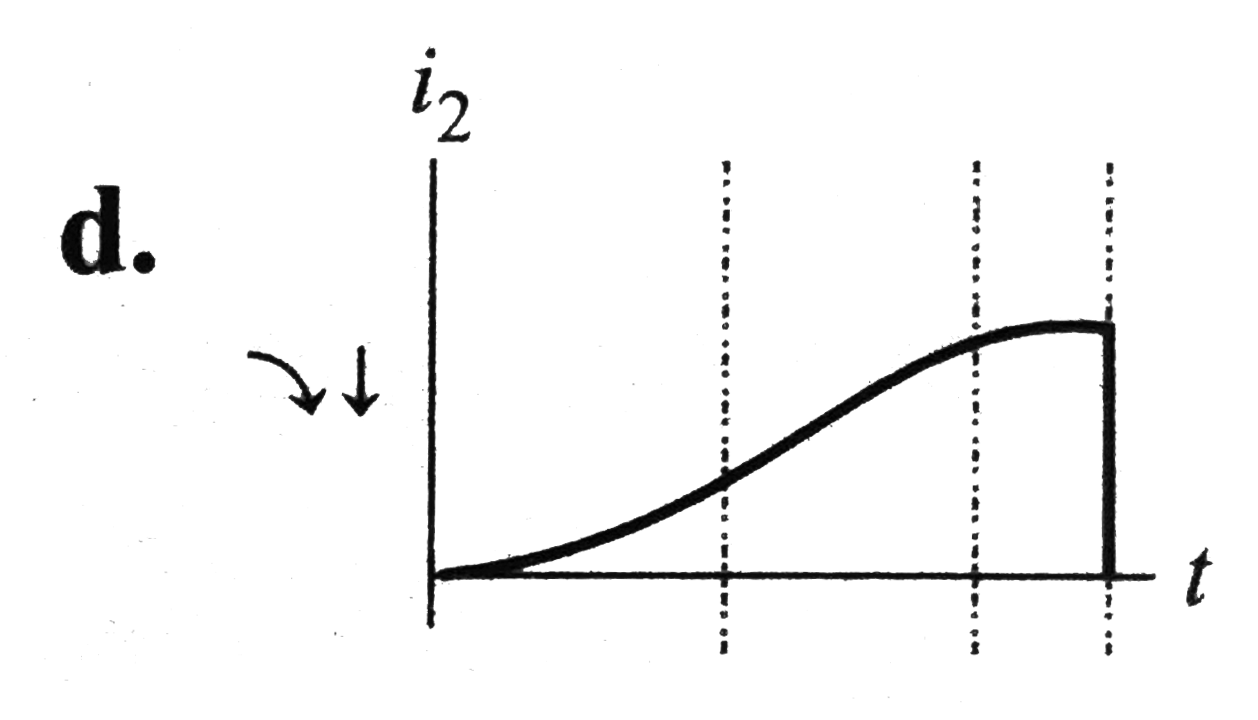
The correct Answer is:A
(a) Let M is mutual inductance of coil, then the flux in second coil is
ϕ2=Mi1 ltbr> e2=dϕ2dt=Mdi1dt
i2=e2R=MRdidt → i2∝didt
Topper's Solved these Questions
- ELECTROMAGNETIC INDUCTIONBook:CENGAGE PHYSICSChapter:ELECTROMAGNETIC INDUCTIONExercise:Exercises Multiple Correct
Explore 23 Videos
- ELECTROMAGNETIC INDUCTIONBook:CENGAGE PHYSICSChapter:ELECTROMAGNETIC INDUCTIONExercise:Exercises Asserton - Reasoning
Explore 8 Videos
- ELECTROMAGNETIC INDUCTIONBook:CENGAGE PHYSICSChapter:ELECTROMAGNETIC INDUCTIONExercise:Exercises Subjective
Explore 13 Videos
- ELECTROMAGENTIC INDUCTIONBook:CENGAGE PHYSICSChapter:ELECTROMAGENTIC INDUCTIONExercise:QUESTION BANK
Explore 40 Videos
- ELECTRON,PHONTS,PHOTOELECTRIC EFFECT & X-RAYSBook:CENGAGE PHYSICSChapter:ELECTRON,PHONTS,PHOTOELECTRIC EFFECT & X-RAYSExercise:dpp 3.3
Explore 15 Videos
Similar Questions
Knowledge Check
The reading of ammeter shown in figure is
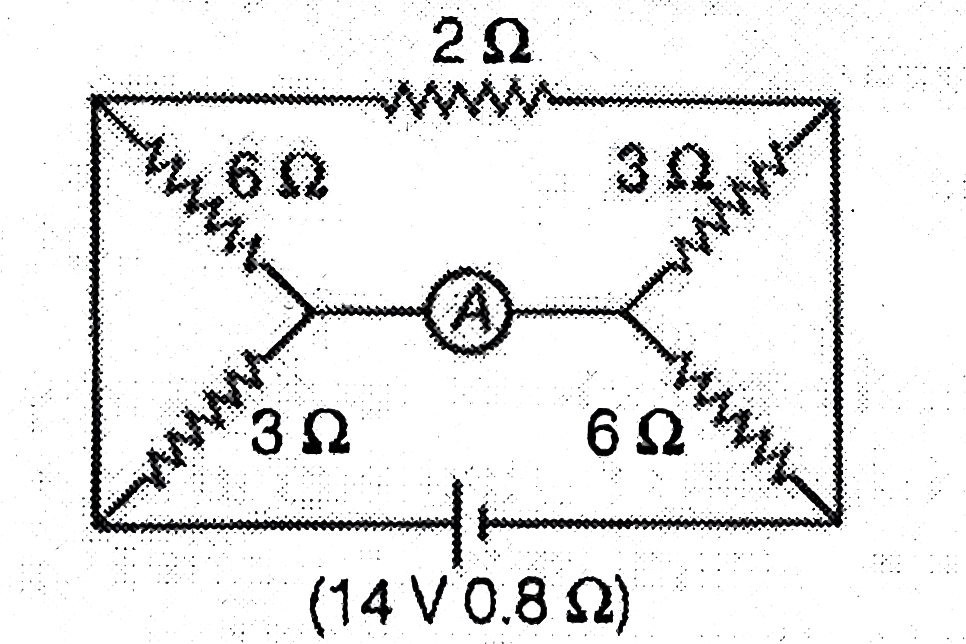 A6.56 AB3.28 AC2.18 AD1.09 A
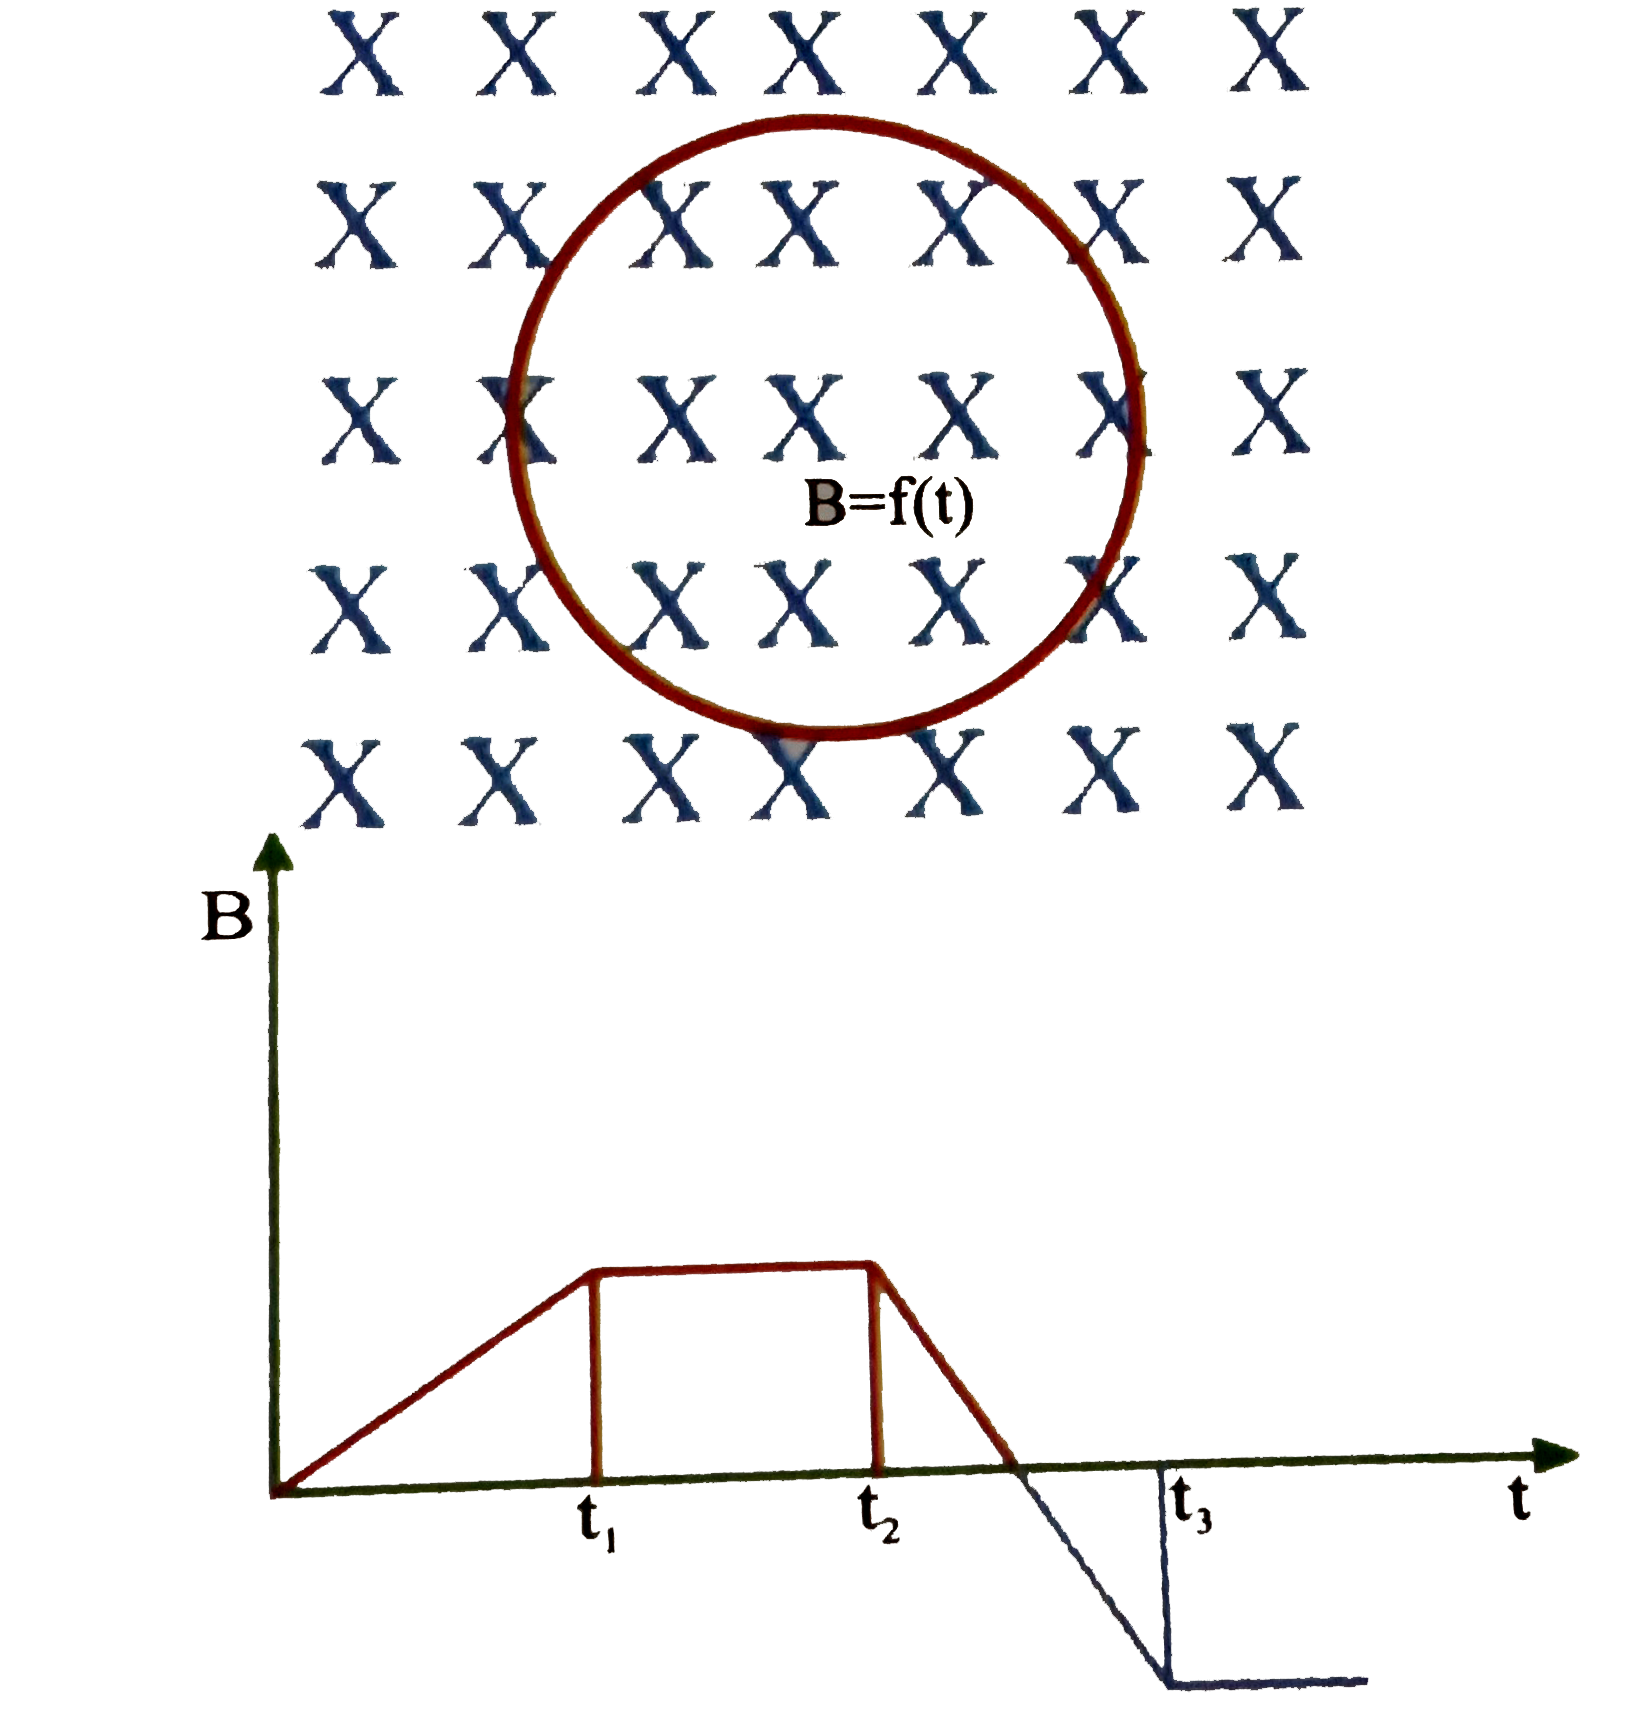
A wire loop is placed in a region of time varying magnetic field which oriented orthogonally to the plane of the loop as shown in figure. The graph shows the magnetic field variation as the function of time. Assume the positive emf is the ine which drives a current in the clockwise direction and seen by the observer in the direction of B. Which of the following graphs best represents the induced emf a function of time.
 A
A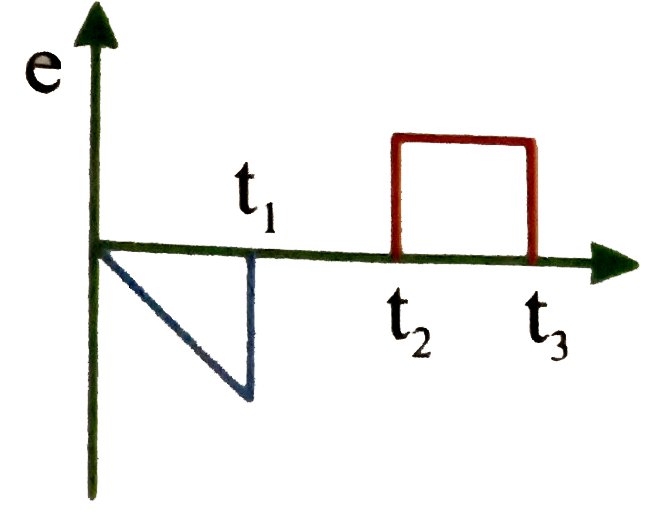 B
B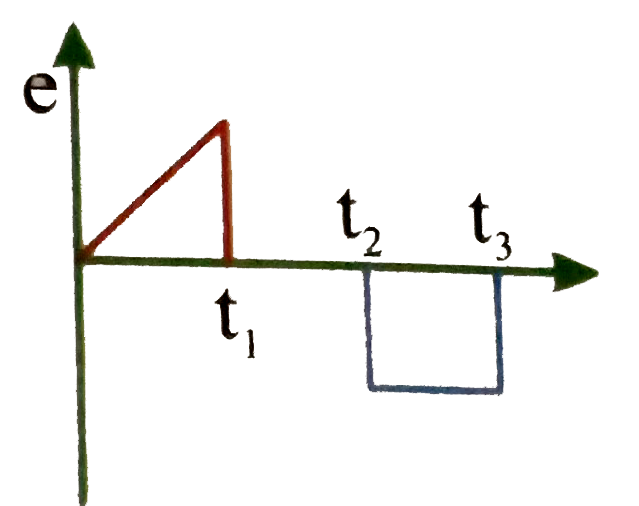 C
C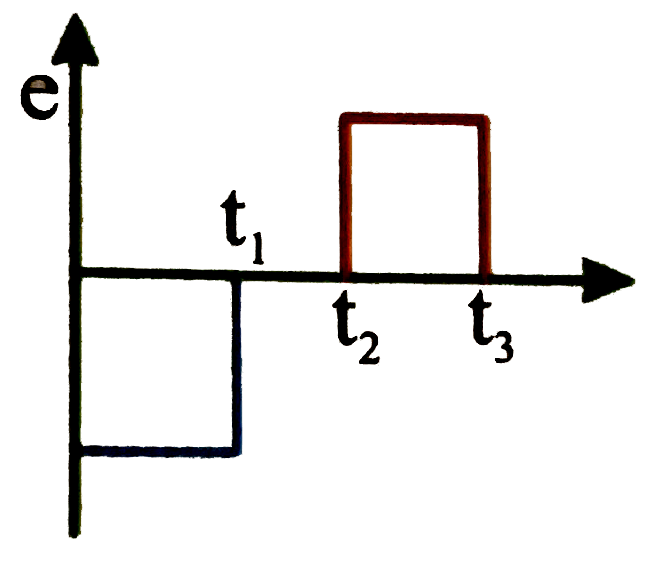 D
D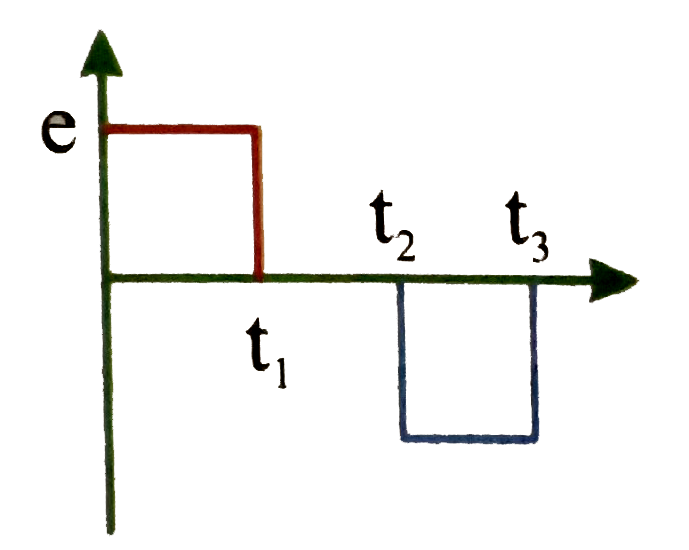
Current through the coil varies according to graph then induced emf v/s time graph is
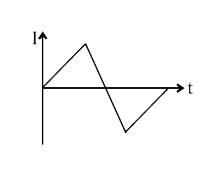 A
A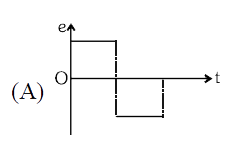 B
B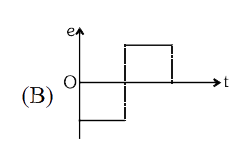 C
C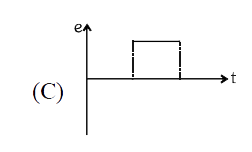 D
D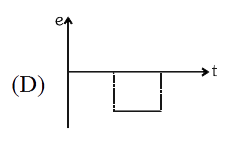
The current i through a wire varies with time t as shown in the fig. The effective (rms) value of the current is
View SolutionIn the series LCR circuit as shown in the figure, the voltmeter V and ammeter A reading are
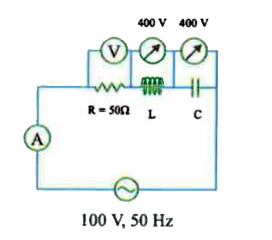
View SolutionIn the series LCR circuit as shown in the figure, the voltmeter V and ammeter A reading are

View SolutionA charge passing through a resistor varies with time as shown in the figure. The amount of heat generated in time t is best represented (as a function of time ) by
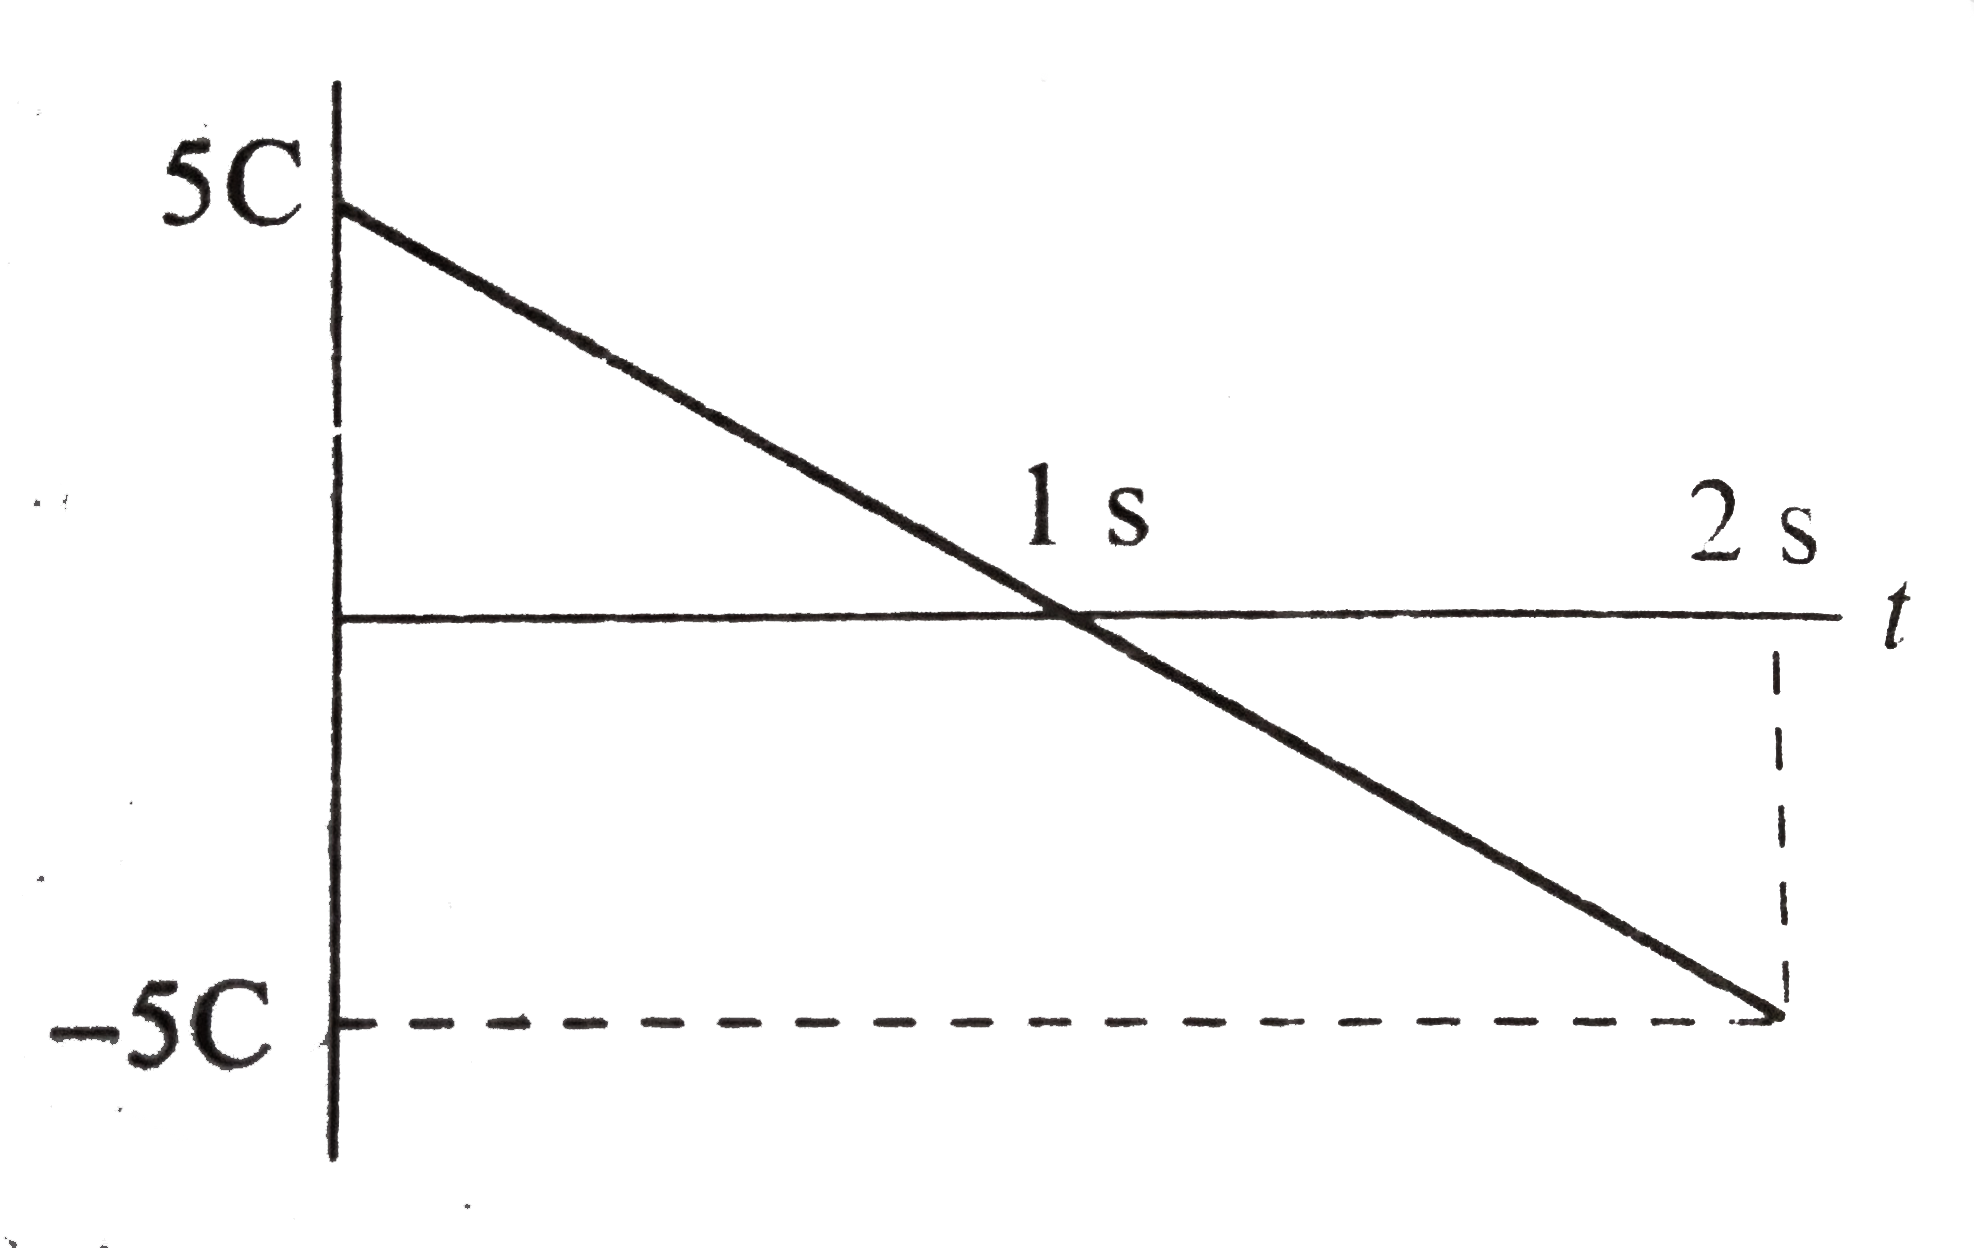
View SolutionA and B are two coils placed closely as shown. The current in coil A varies as shown in the graph.
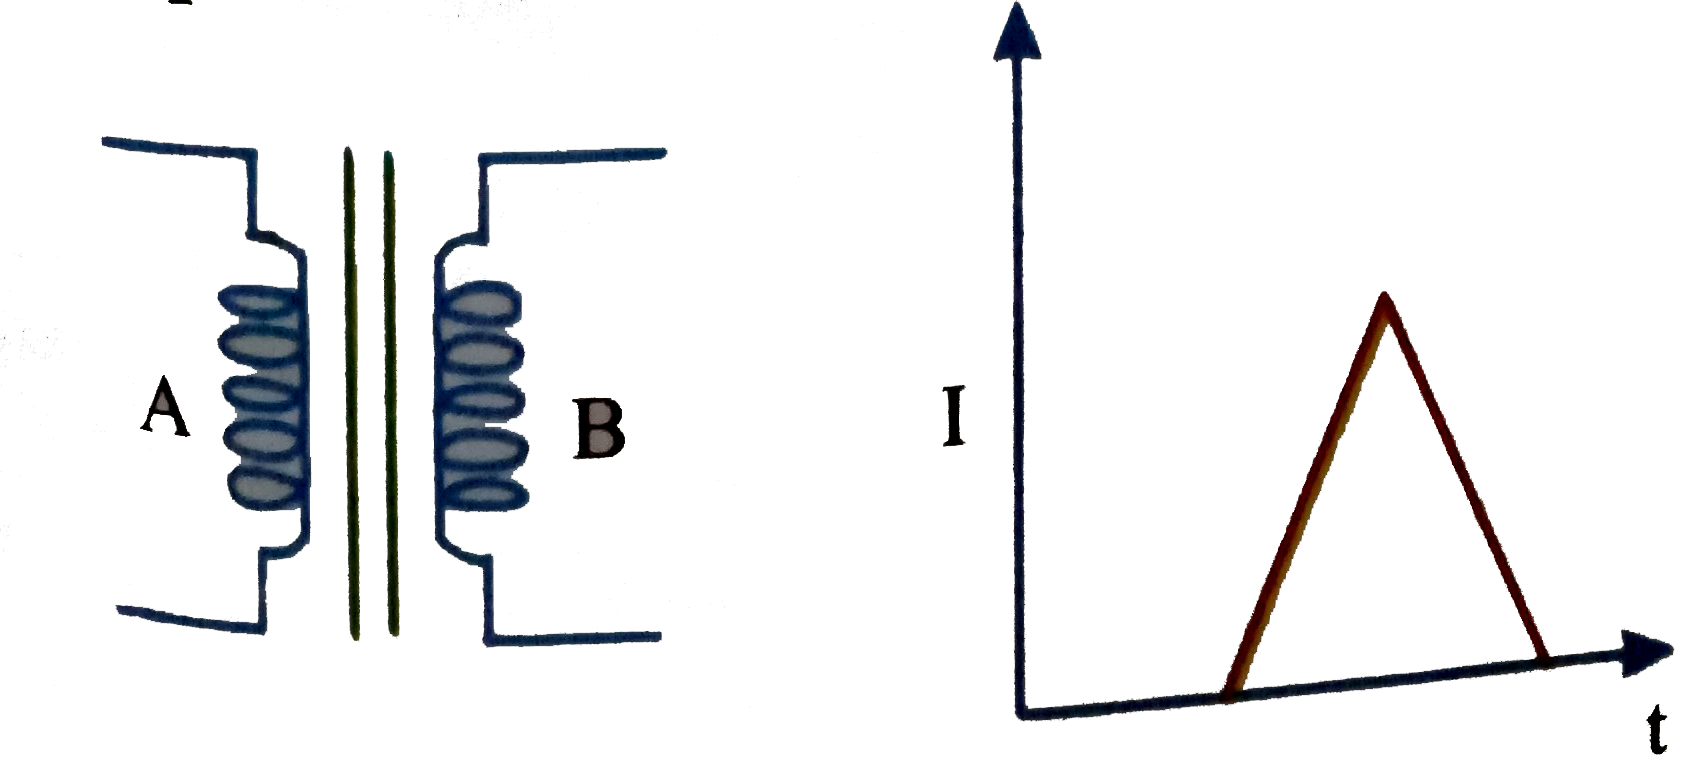
Then which of the following graphs gives the best respresent of variation of induction emf in coil B?
View Solution


