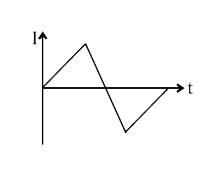
A and B are two coils placed closely as shown. The current in coil A varies as shown in the graph.
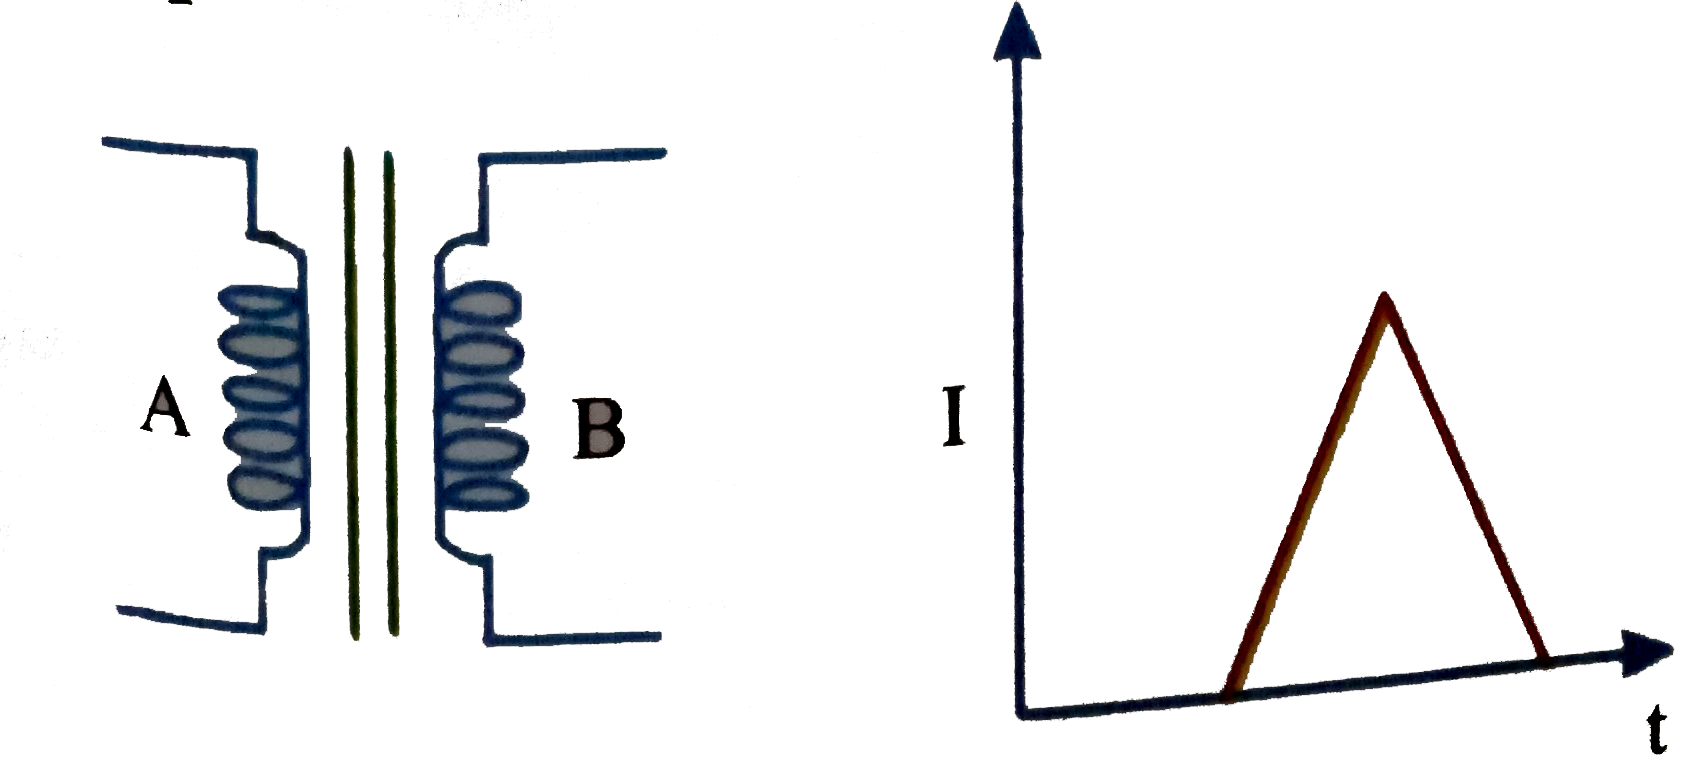
Then which of the following graphs gives the best respresent of variation of induction emf in coil B?
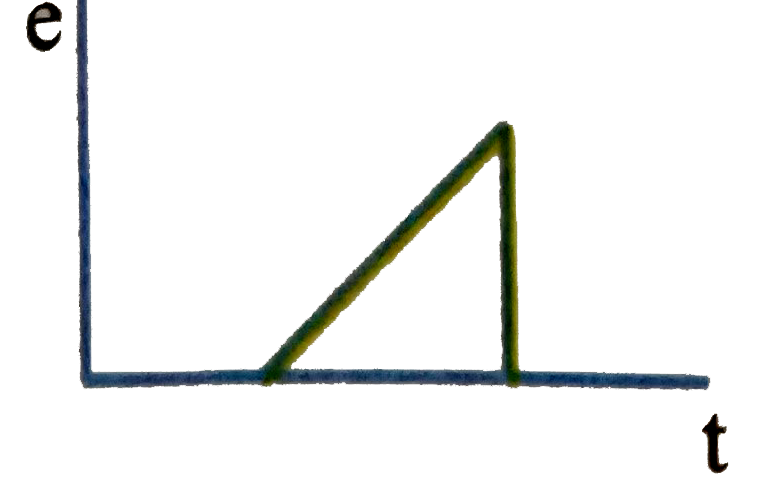
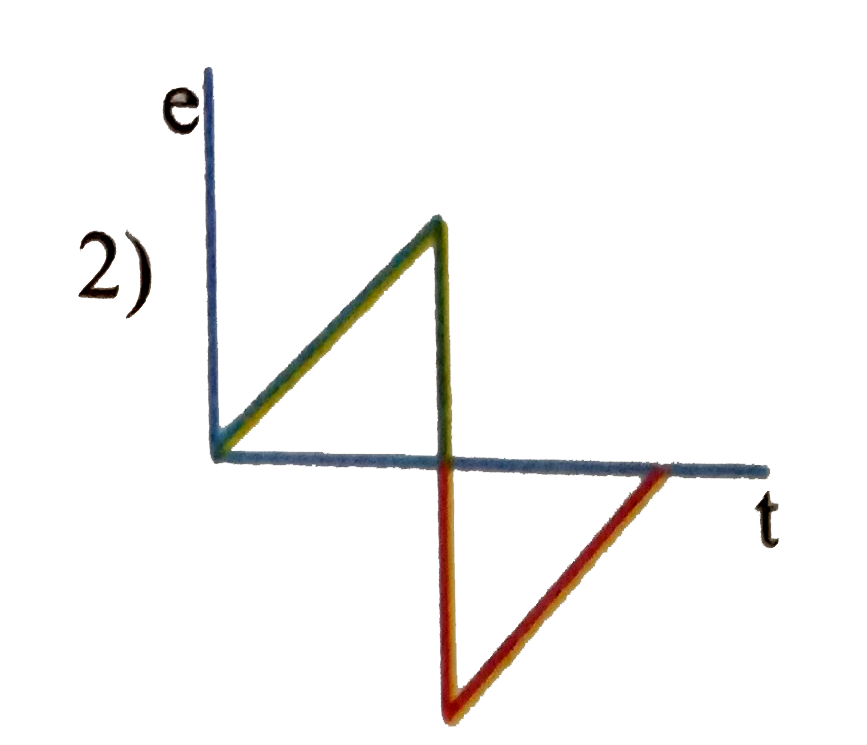
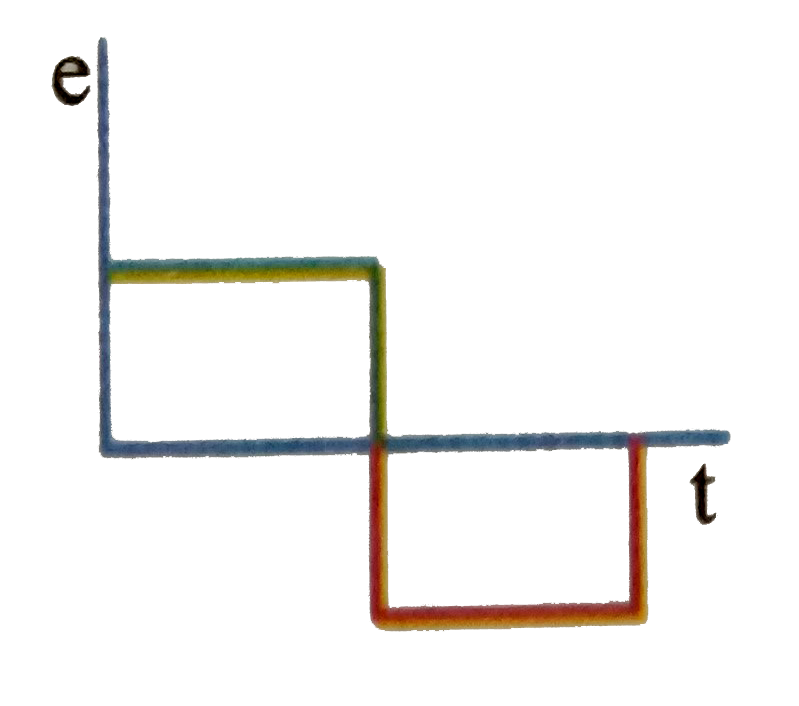
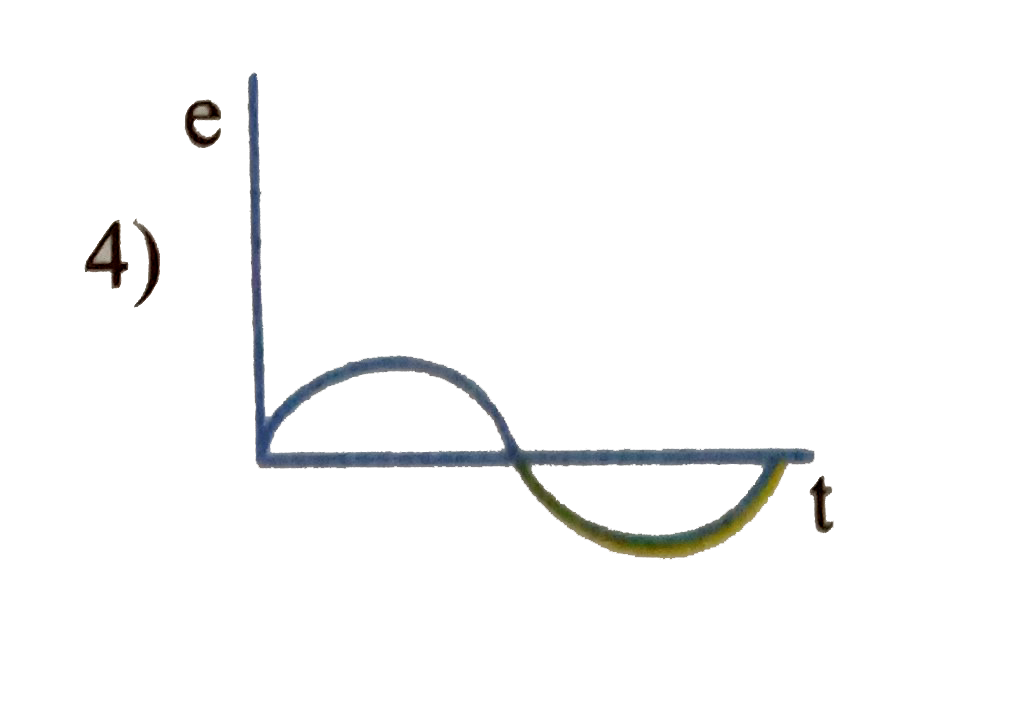
The correct Answer is:C
Step by step video, text & image solution for A and B are two coils placed closely as shown. The current in coil A varies as shown in the graph. Then which of the following graphs gives the best respresent of variation of induction emf in coil B? by Physics experts to help you in doubts & scoring excellent marks in Class 12 exams.
Updated on:21/07/2023Topper's Solved these Questions
- ELECTRO MAGNETIC INDUCTIONBook:NARAYNAChapter:ELECTRO MAGNETIC INDUCTIONExercise:Single Answer Questions Level -VI
Explore 13 Videos
- ELECTRO MAGNETIC INDUCTIONBook:NARAYNAChapter:ELECTRO MAGNETIC INDUCTIONExercise:Integer type questions
Explore 2 Videos
- ELECTRO MAGNETIC INDUCTIONBook:NARAYNAChapter:ELECTRO MAGNETIC INDUCTIONExercise:Single Answer Questions Level -V
Explore 11 Videos
- ELECTRIC CHARGES AND FIELDSBook:NARAYNAChapter:ELECTRIC CHARGES AND FIELDSExercise:EXERCISE -4
Explore 43 Videos
- ELECTRO MAGNETIC WAVESBook:NARAYNAChapter:ELECTRO MAGNETIC WAVESExercise:LEVEL-II(H.W)
Explore 14 Videos
Similar Questions
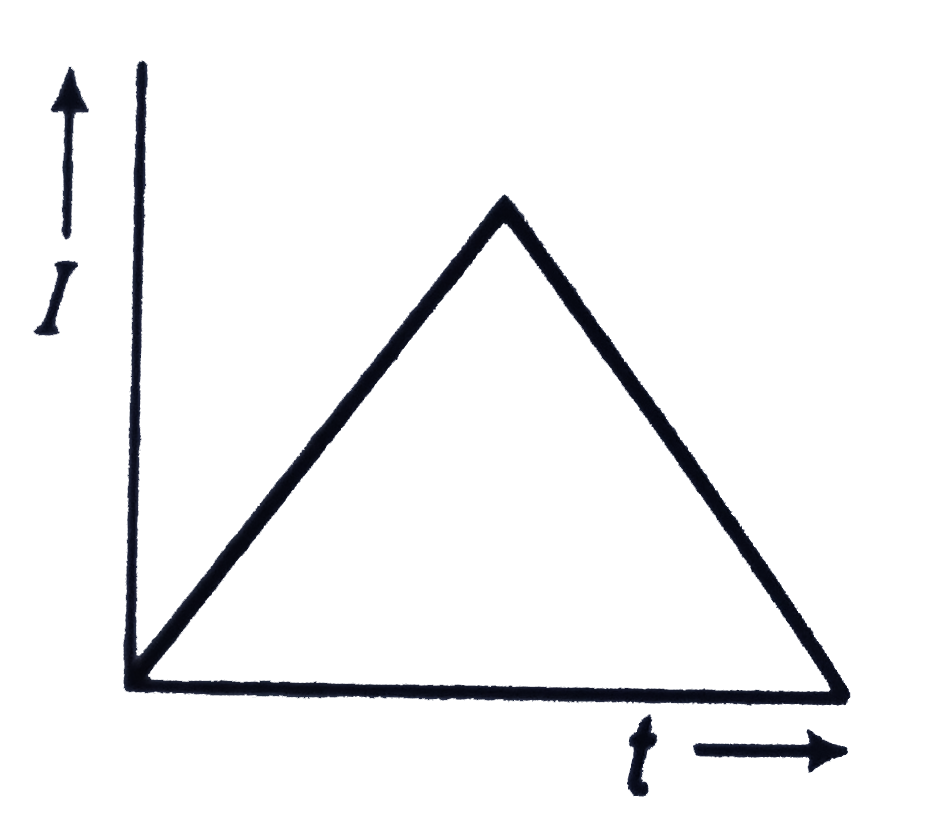
The current i in an induction coil varies with time according to the graph shown in figure. Which of the following graph shows induced emf in the coil with time:
View SolutionAn alternating current I in an inductance coil varies with time t according to the graph as shown: Which one of the following graph gives the variation of voltage with time?
View Solution
Knowledge Check
There are two coils A and B as shown in Fig.
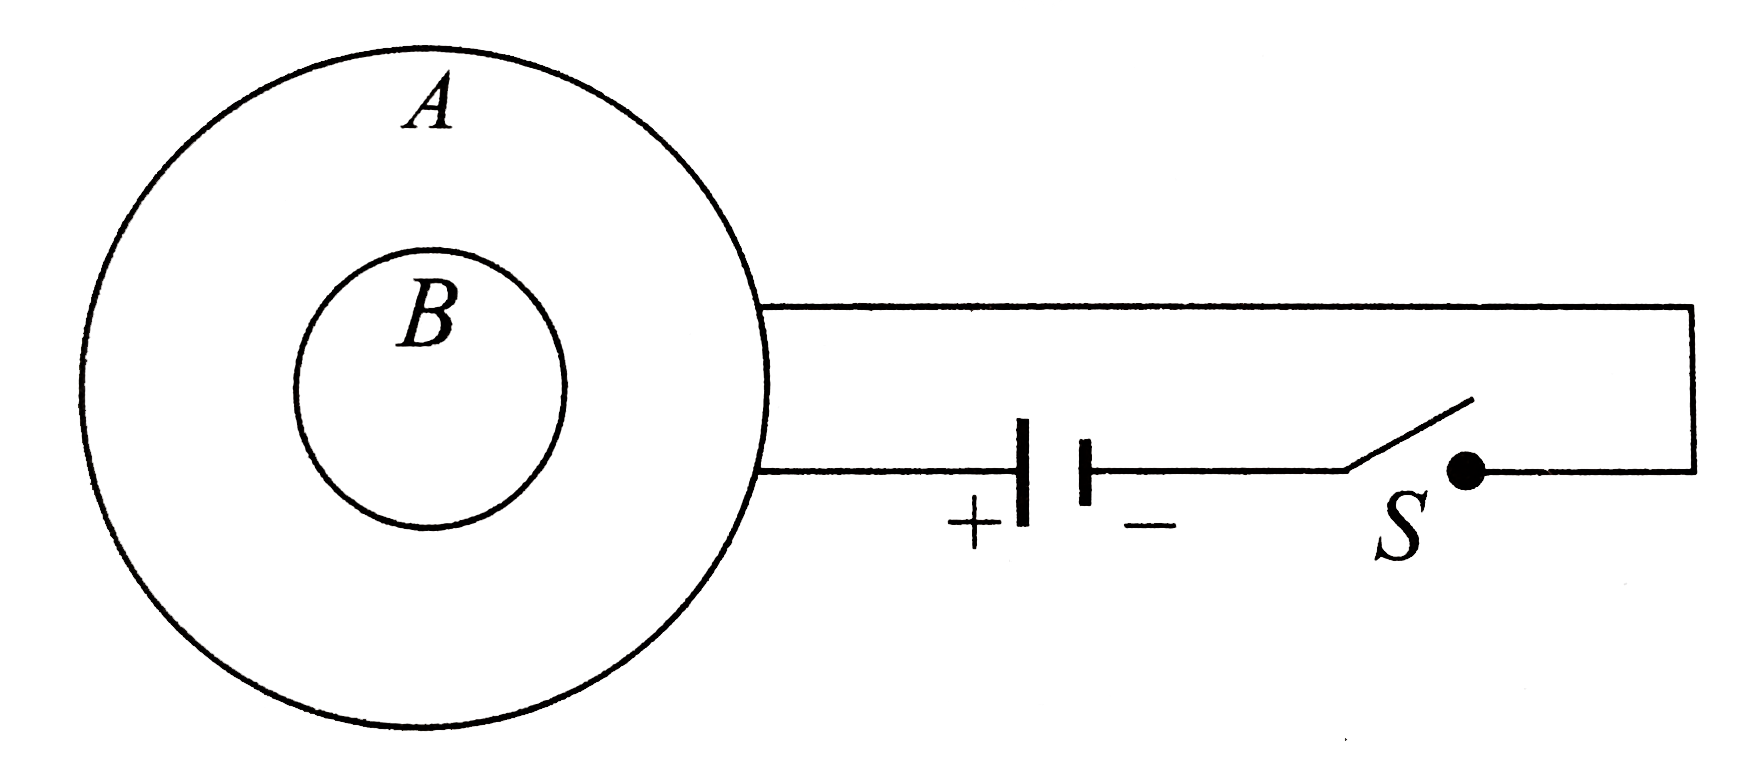 AWhen switch S is closed, the direction of the momentary current induced in coil B will be in anticlockwise directionBWhen switch S is closed, the direction of the momentary current induced in coil B will be in clockwise direction.CWhen switch S is opened, the direction of the momentary induced current in coil B will be in clockwise directionDWhen switch S is opened, the direction of the momentary induced current in coil B will be in anticlockwise direction.
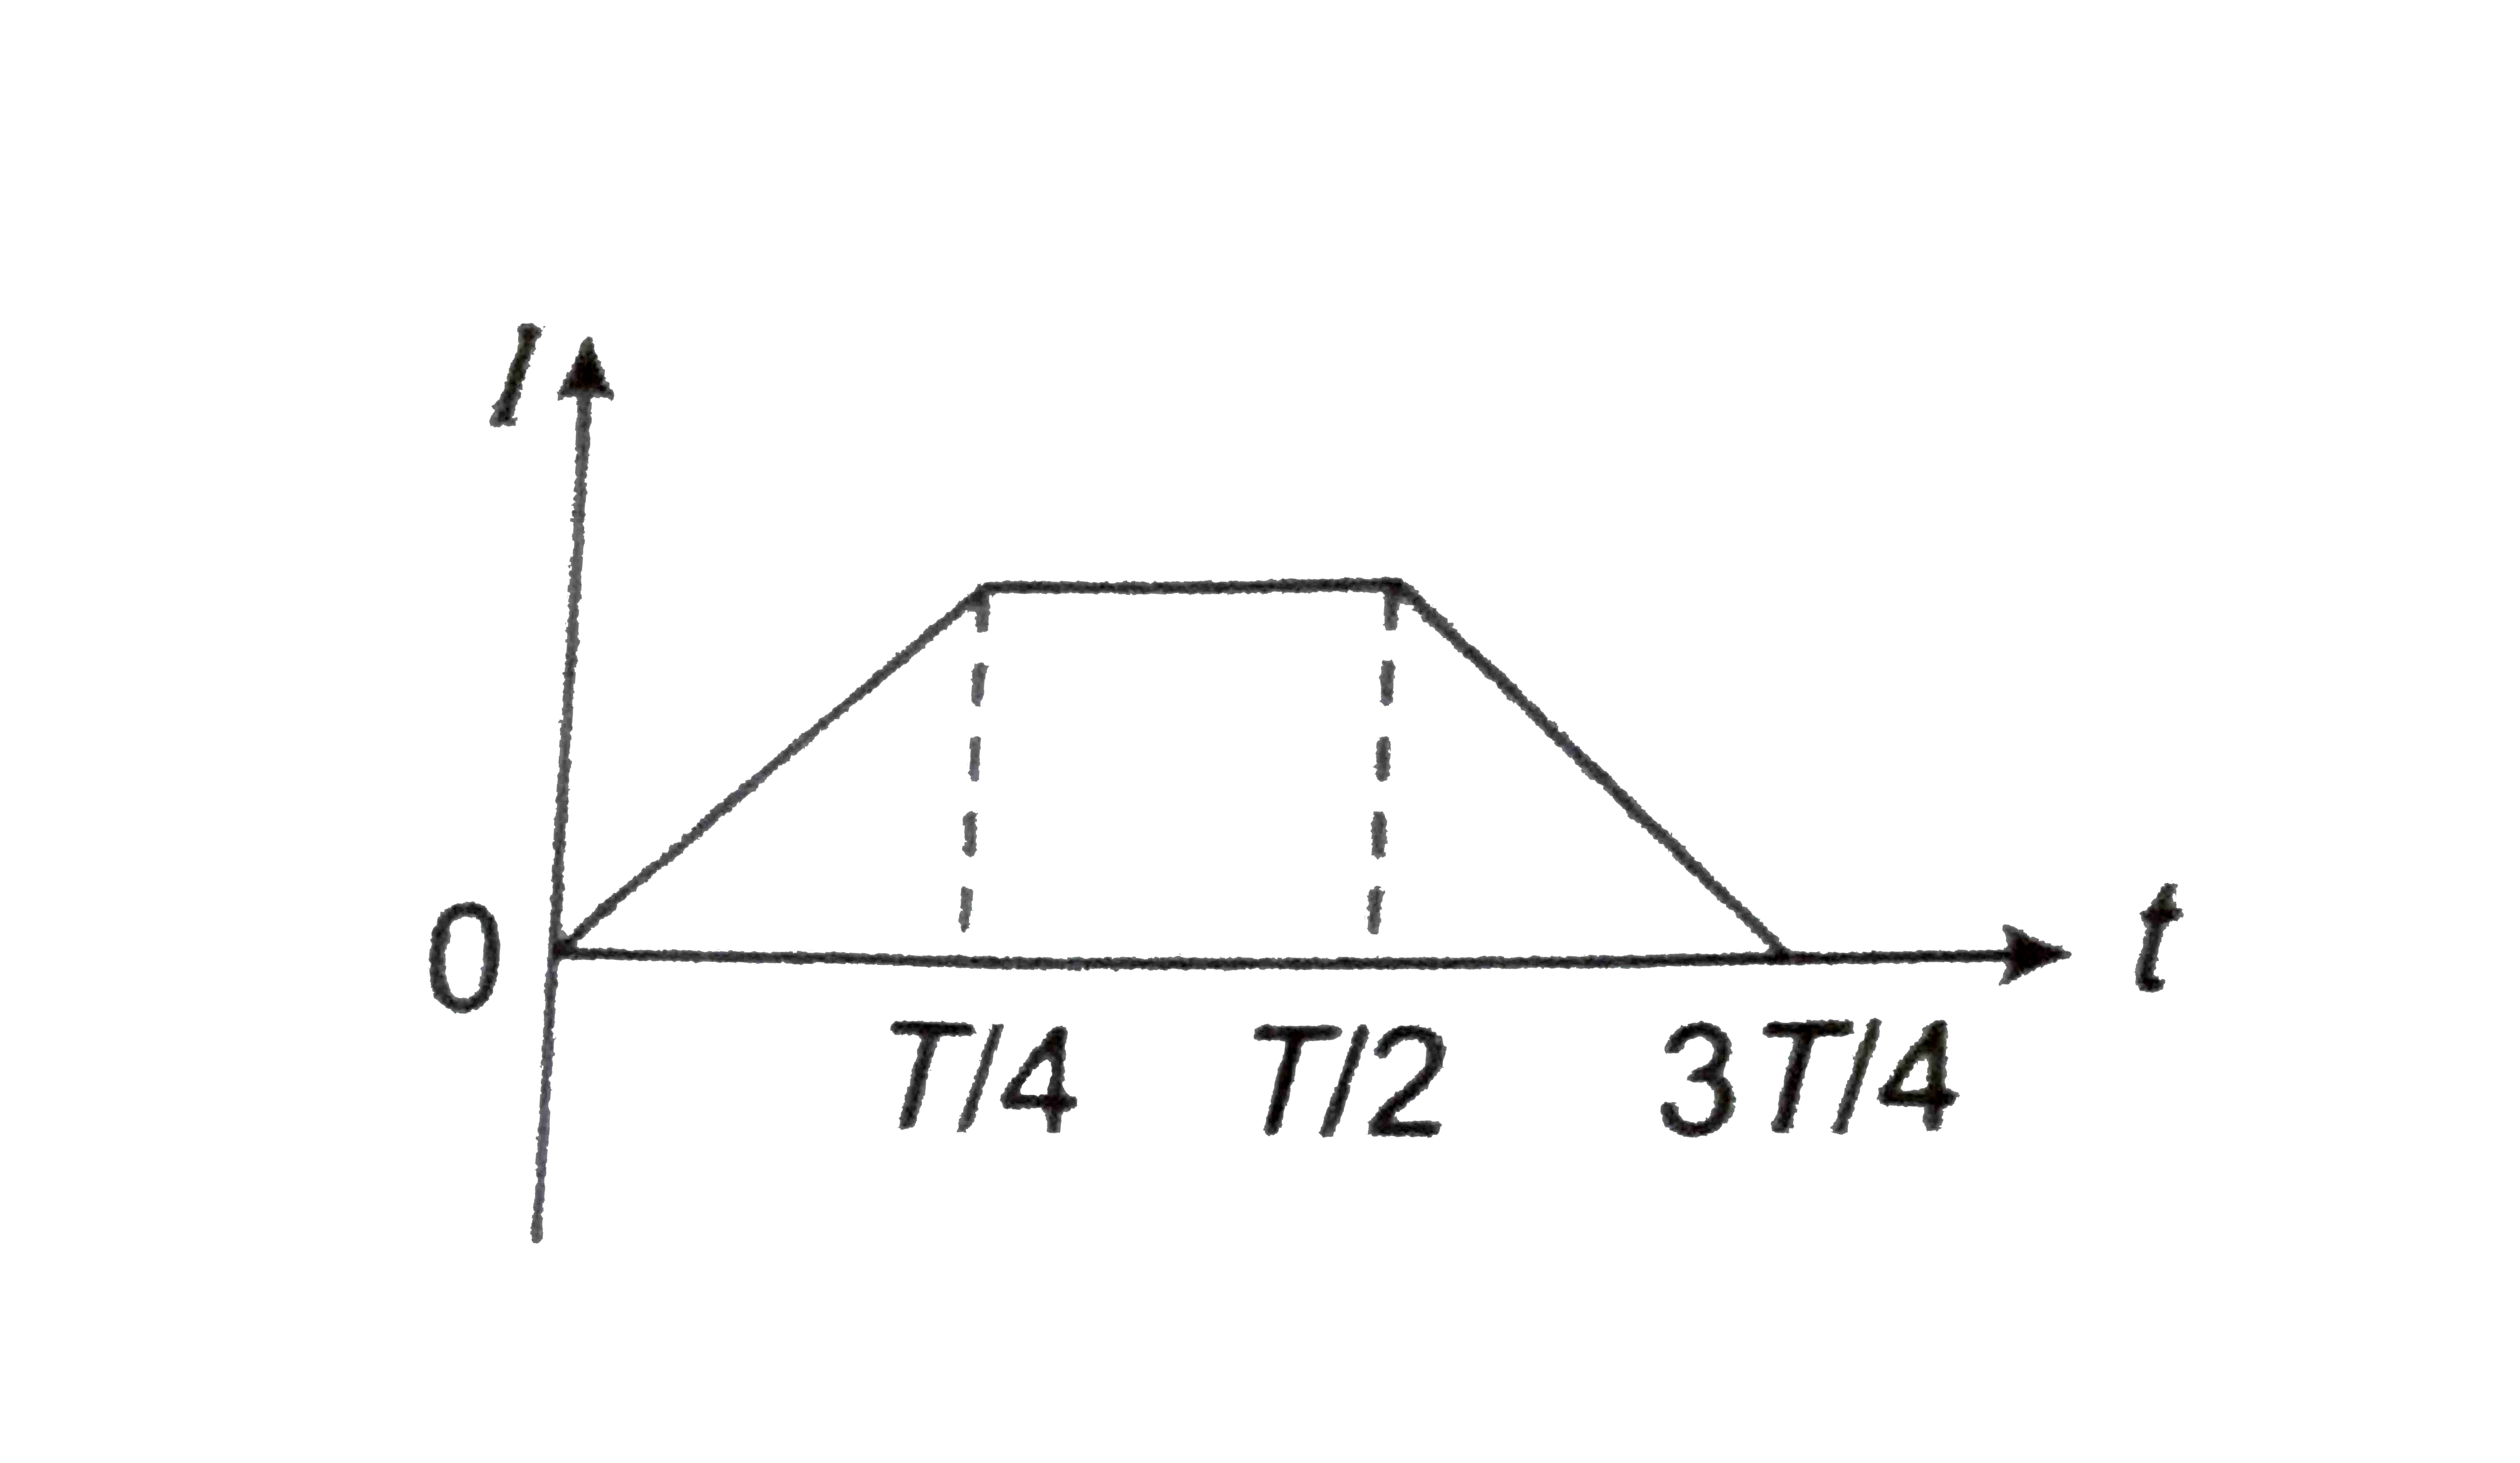
The current i in a coil varies with time as shown in the figure. The variation of induced emf with time would be
 A
A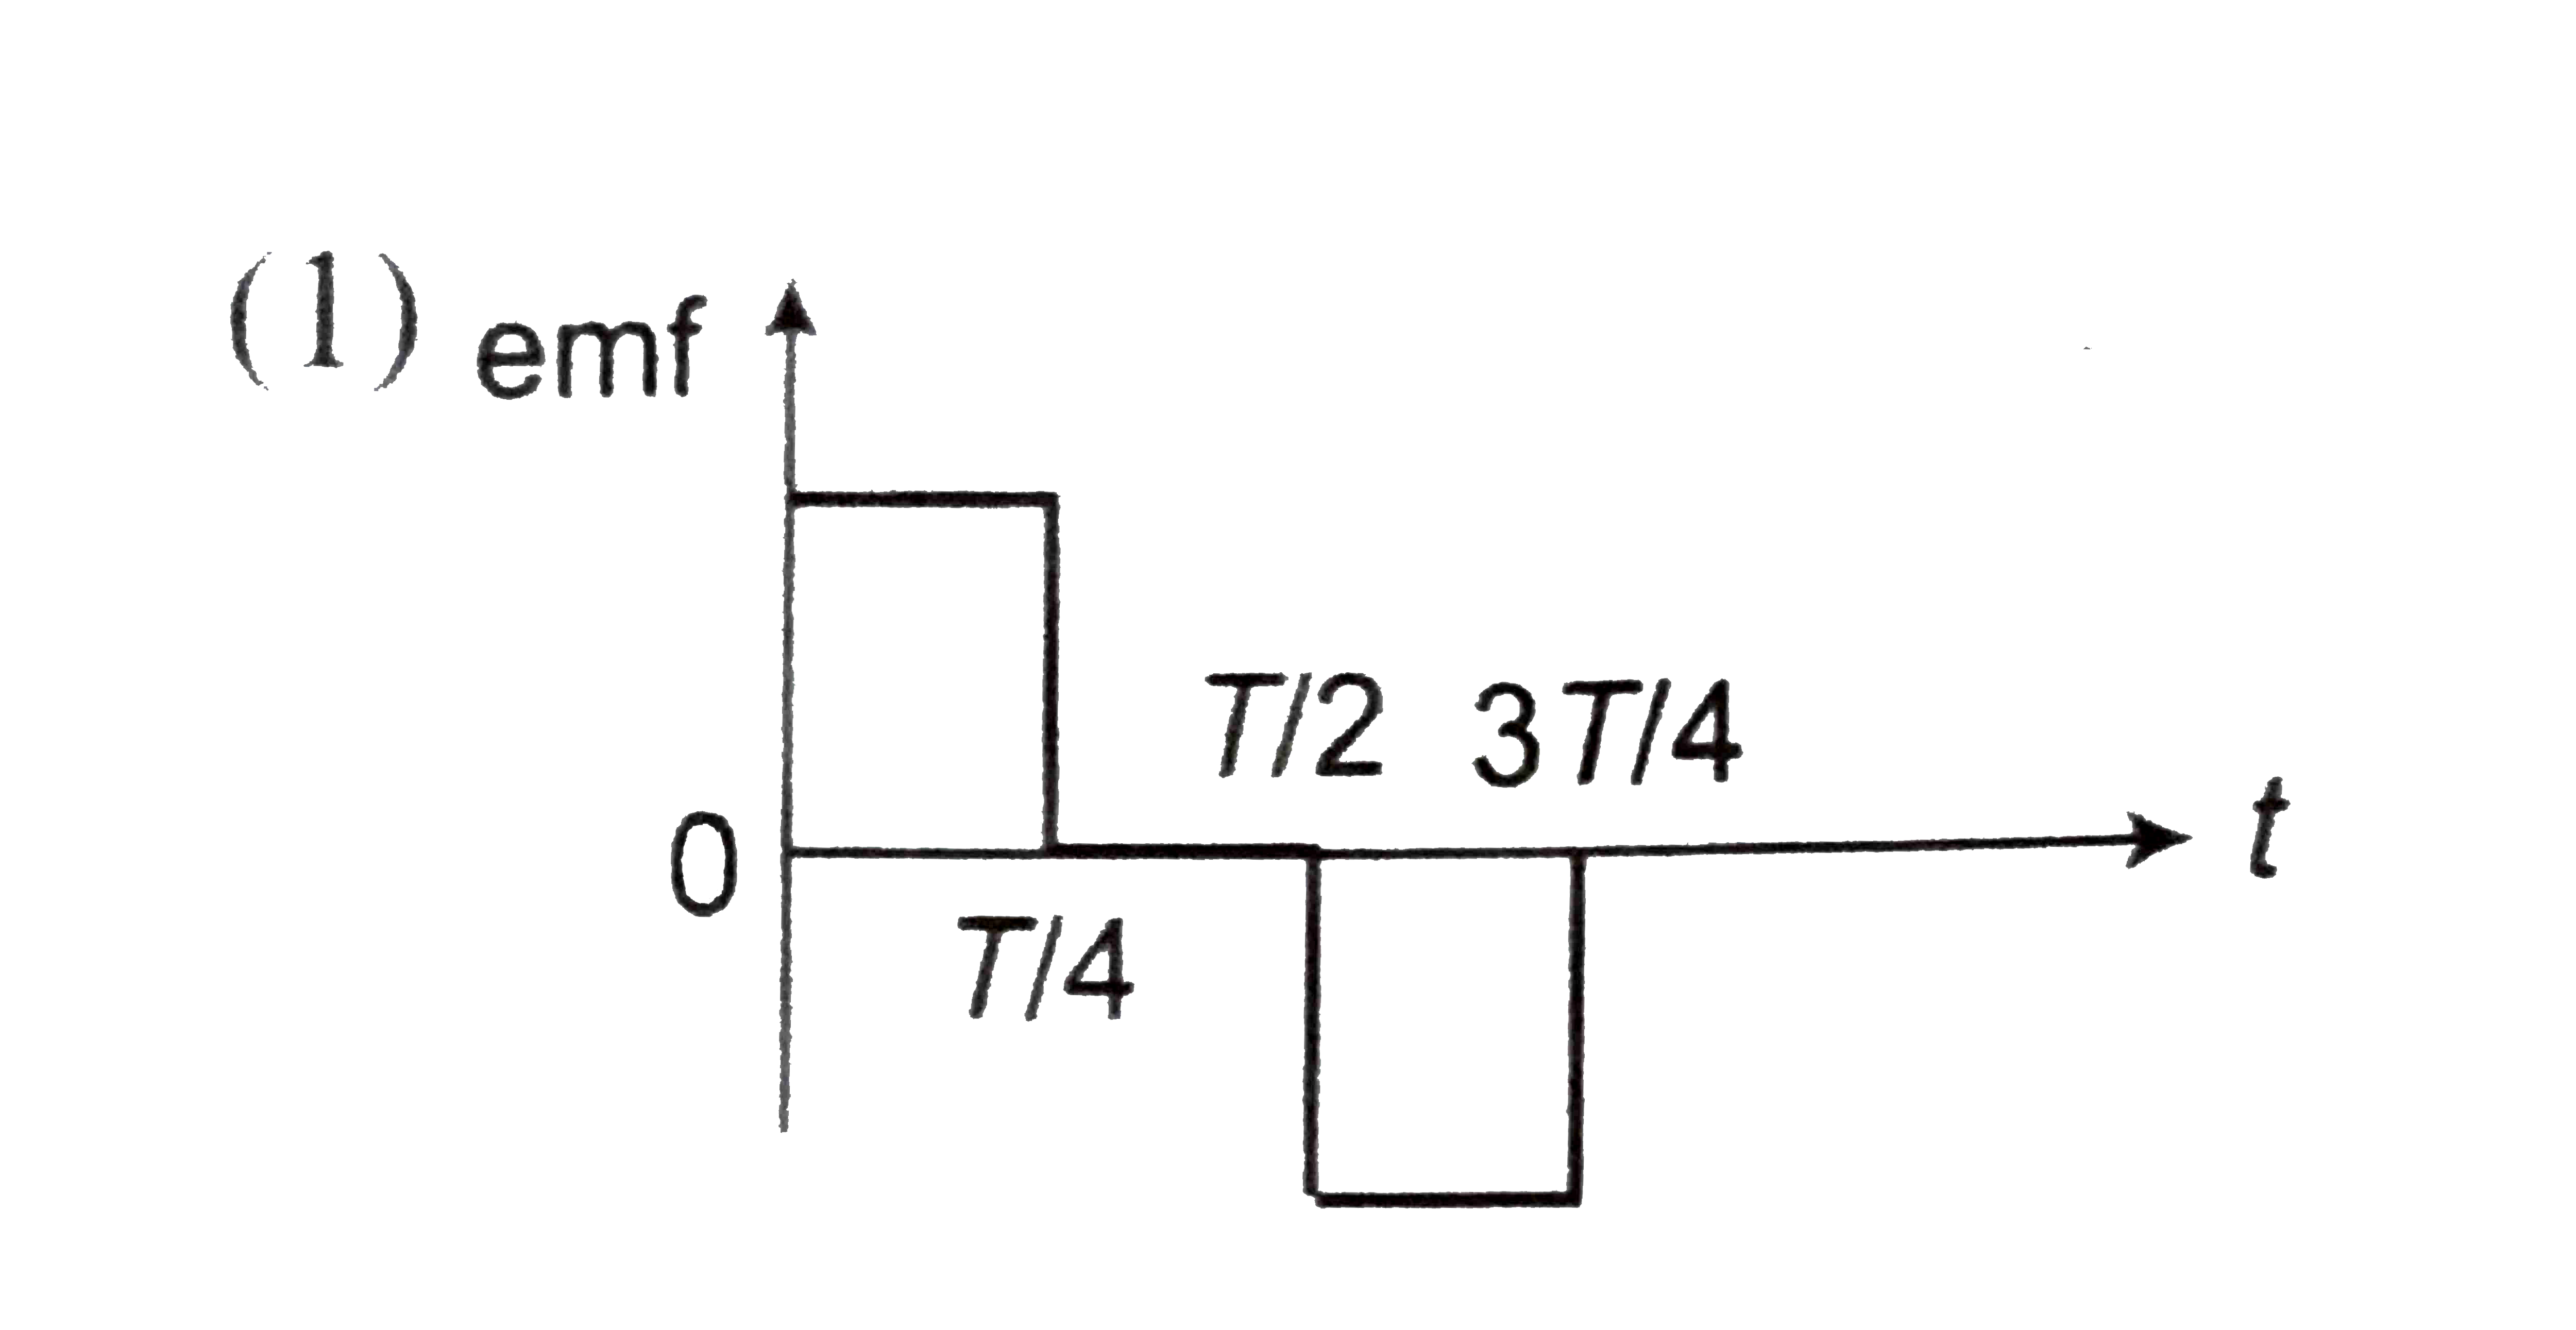 B
B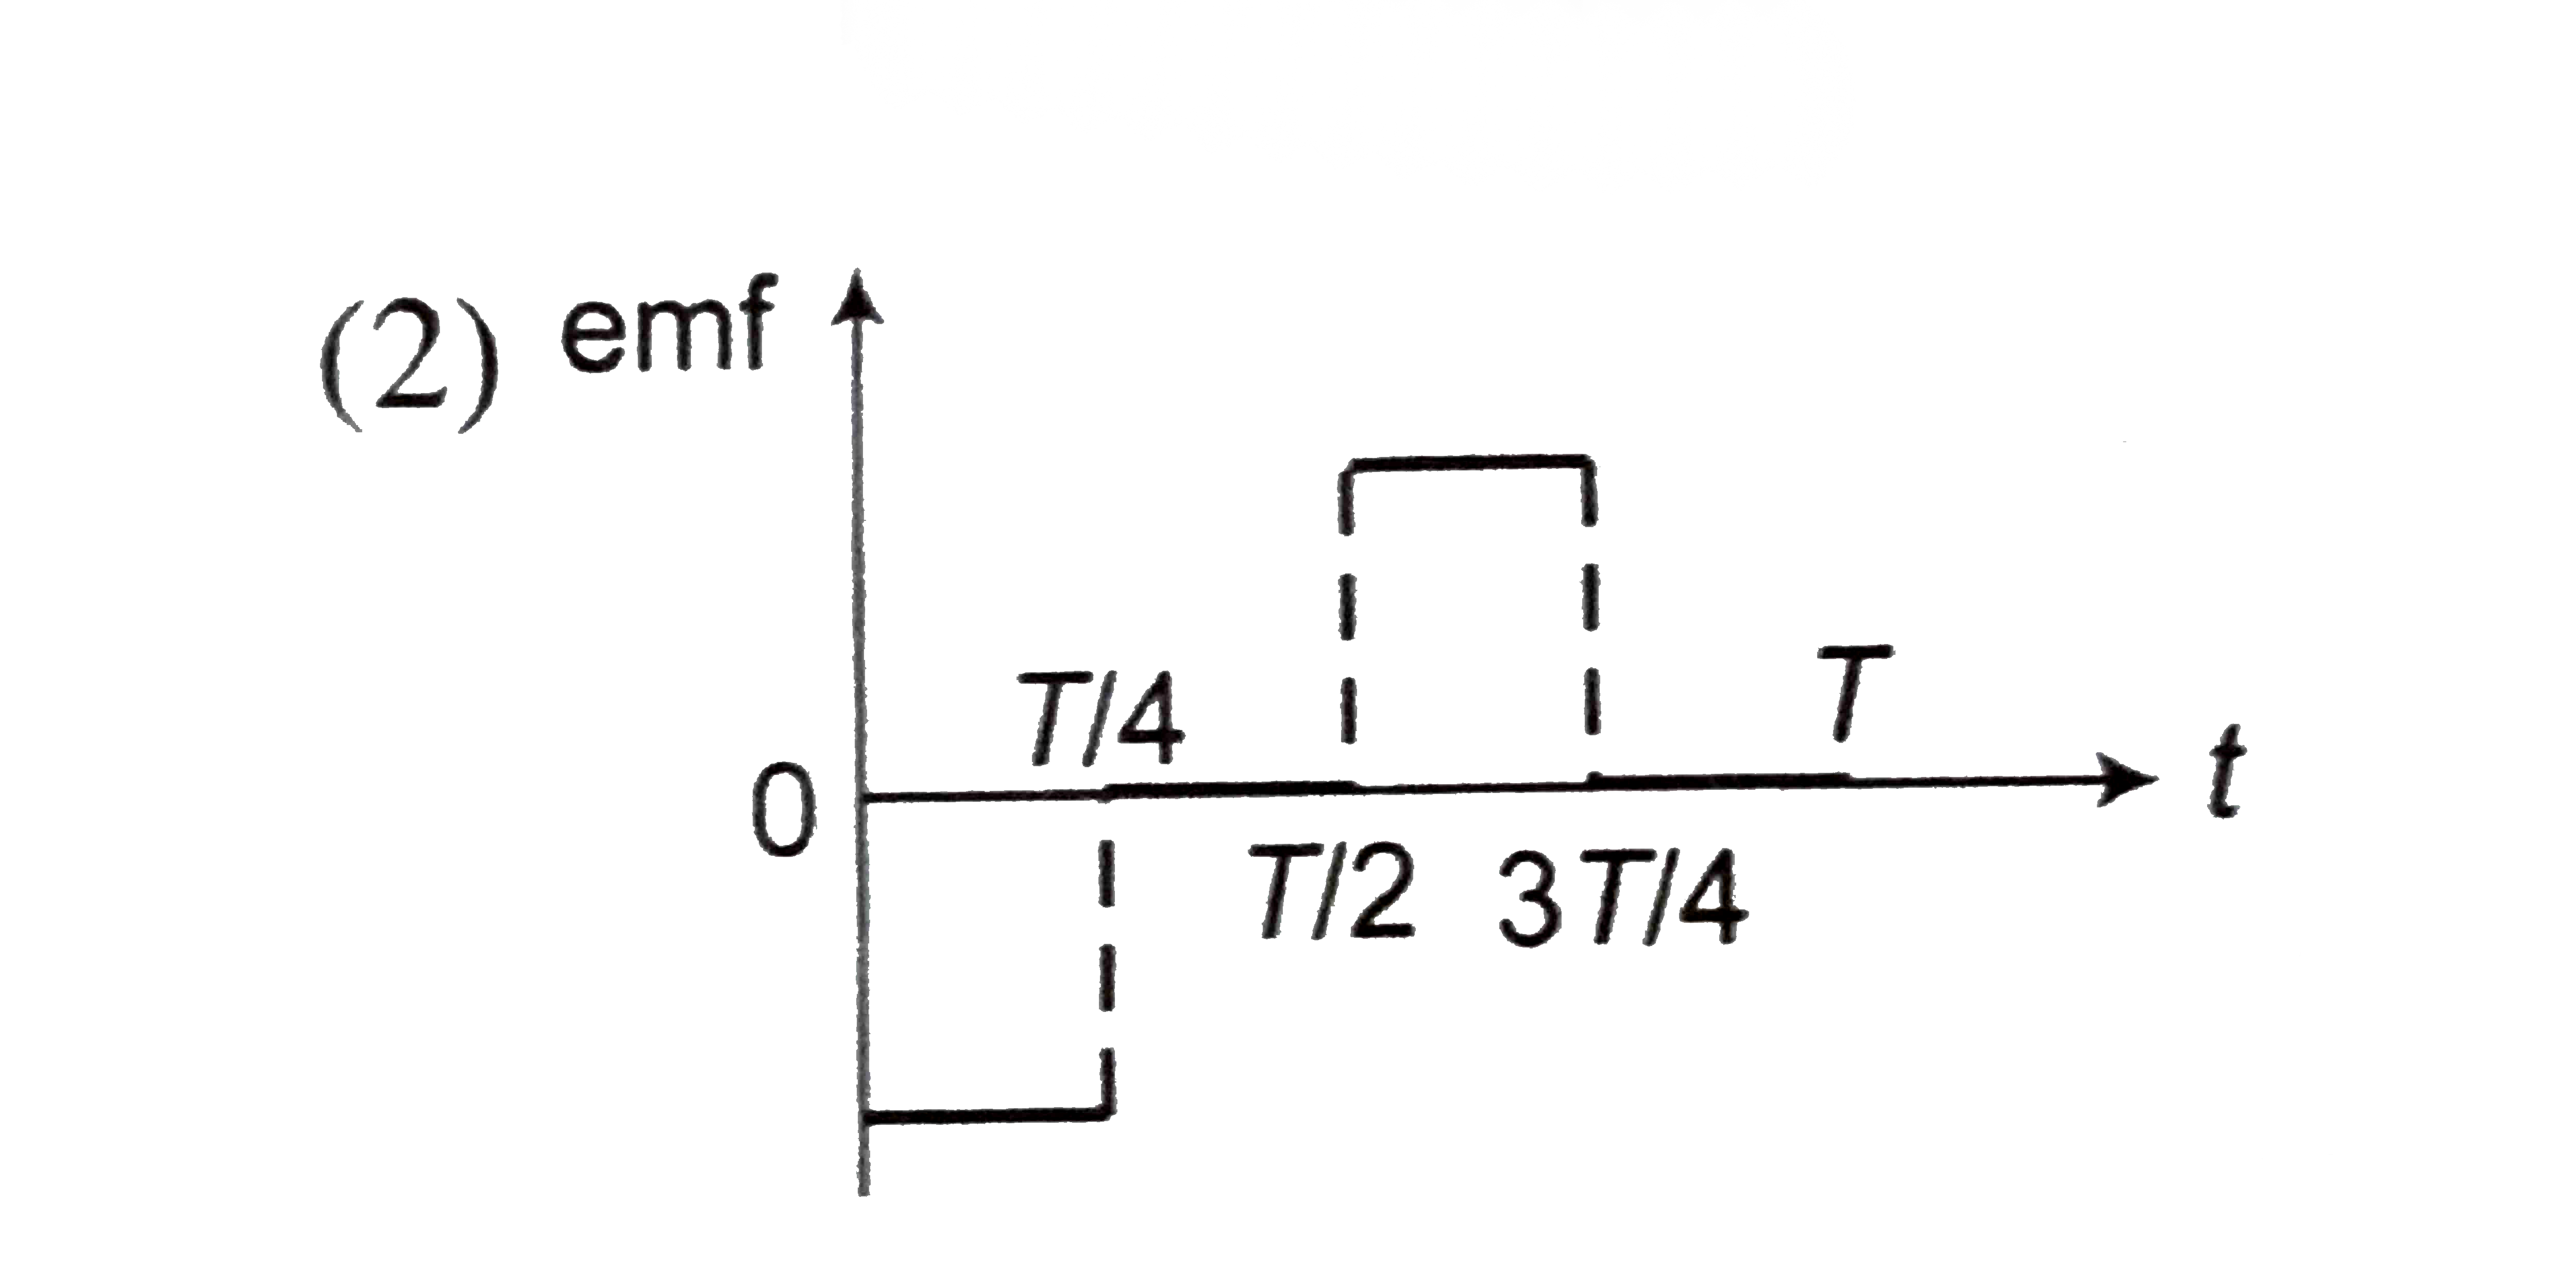 C
C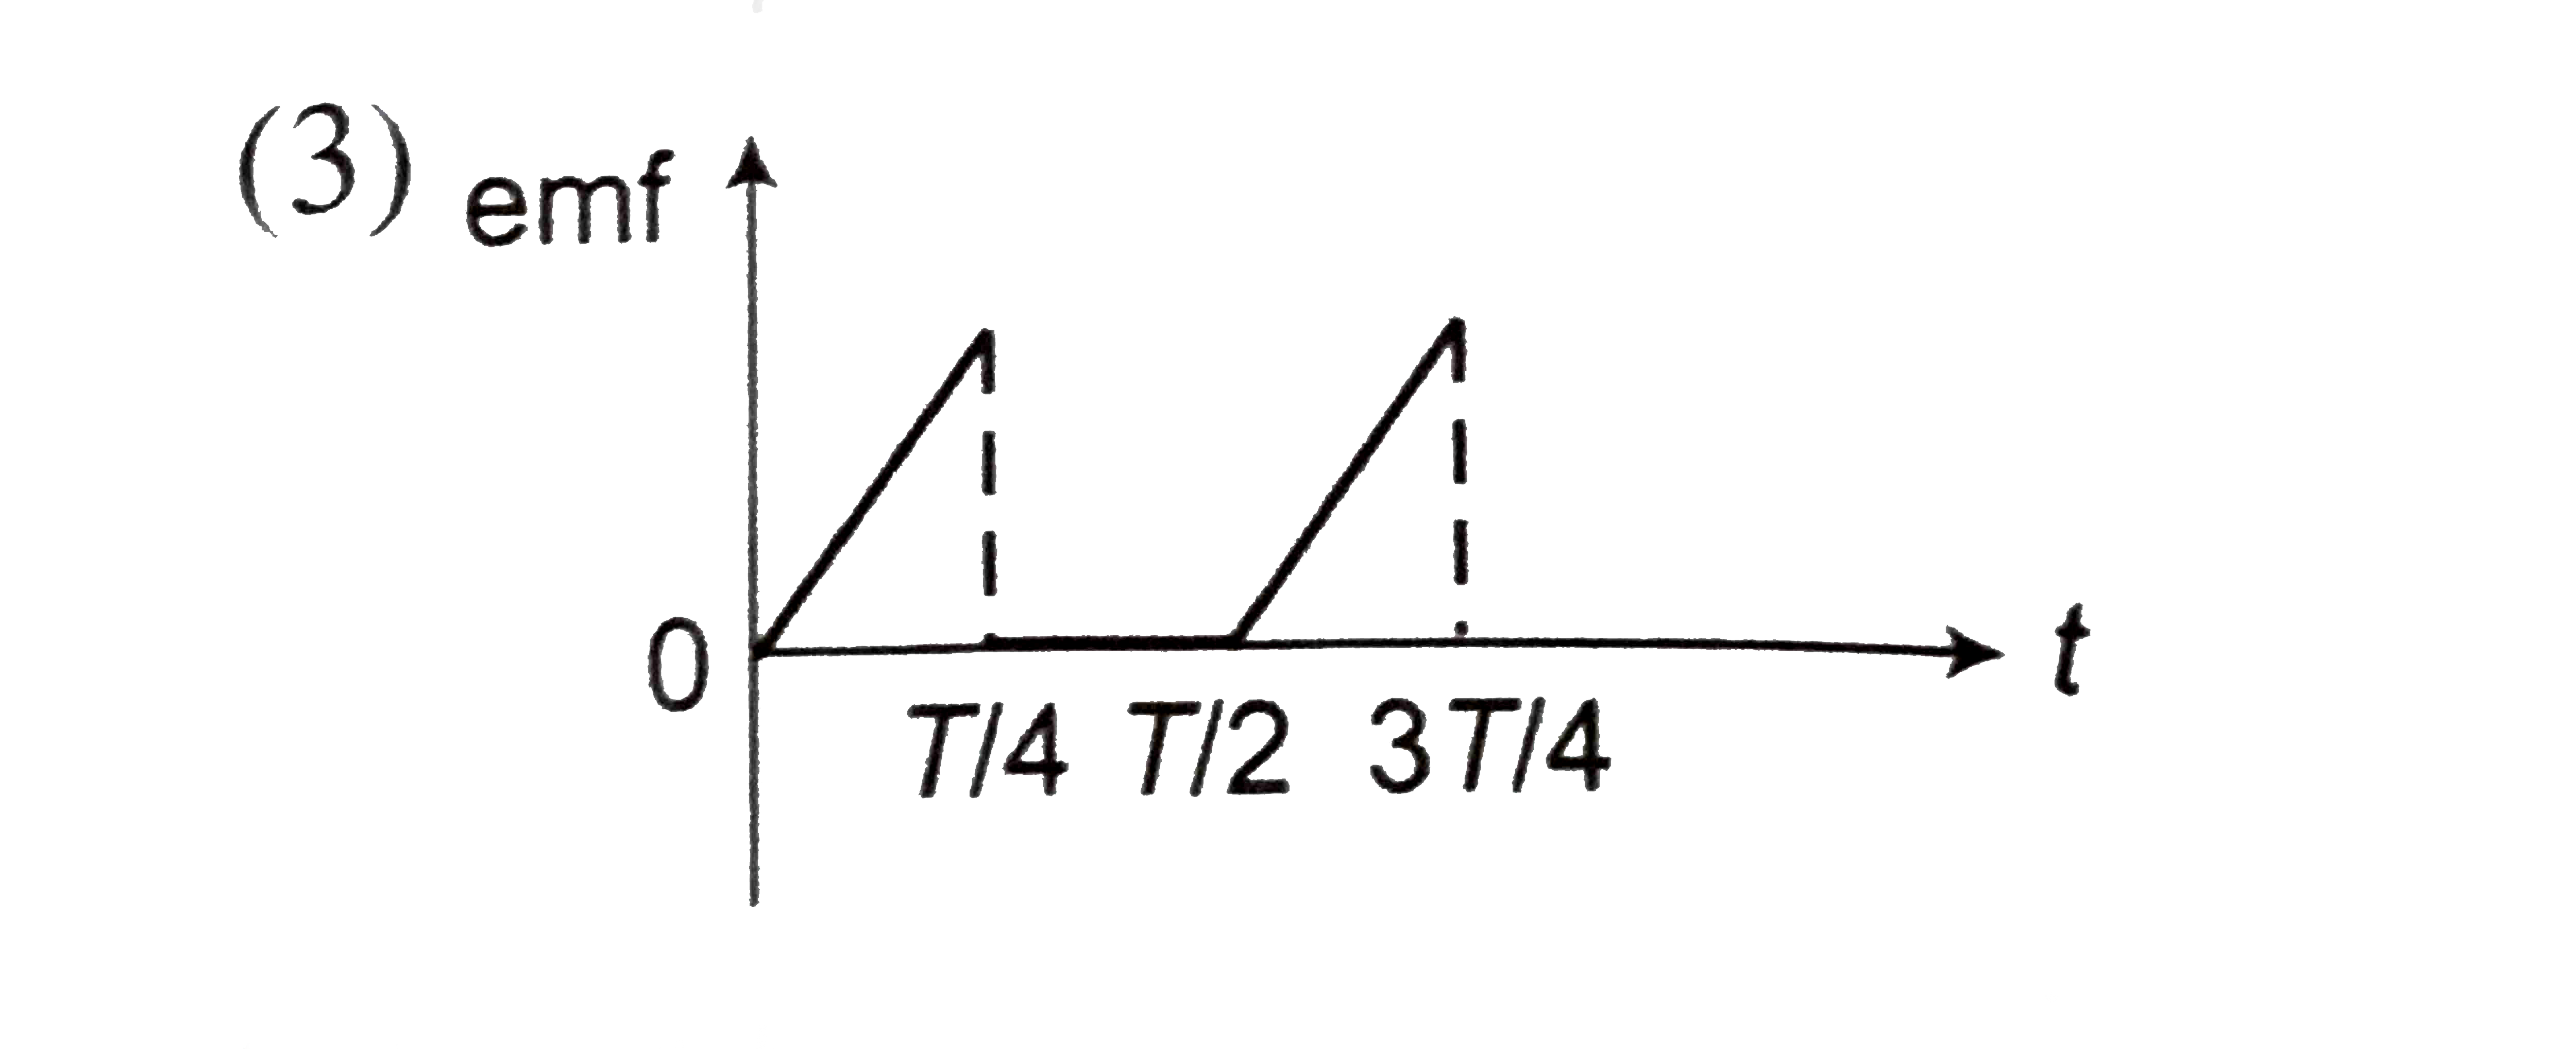 D
D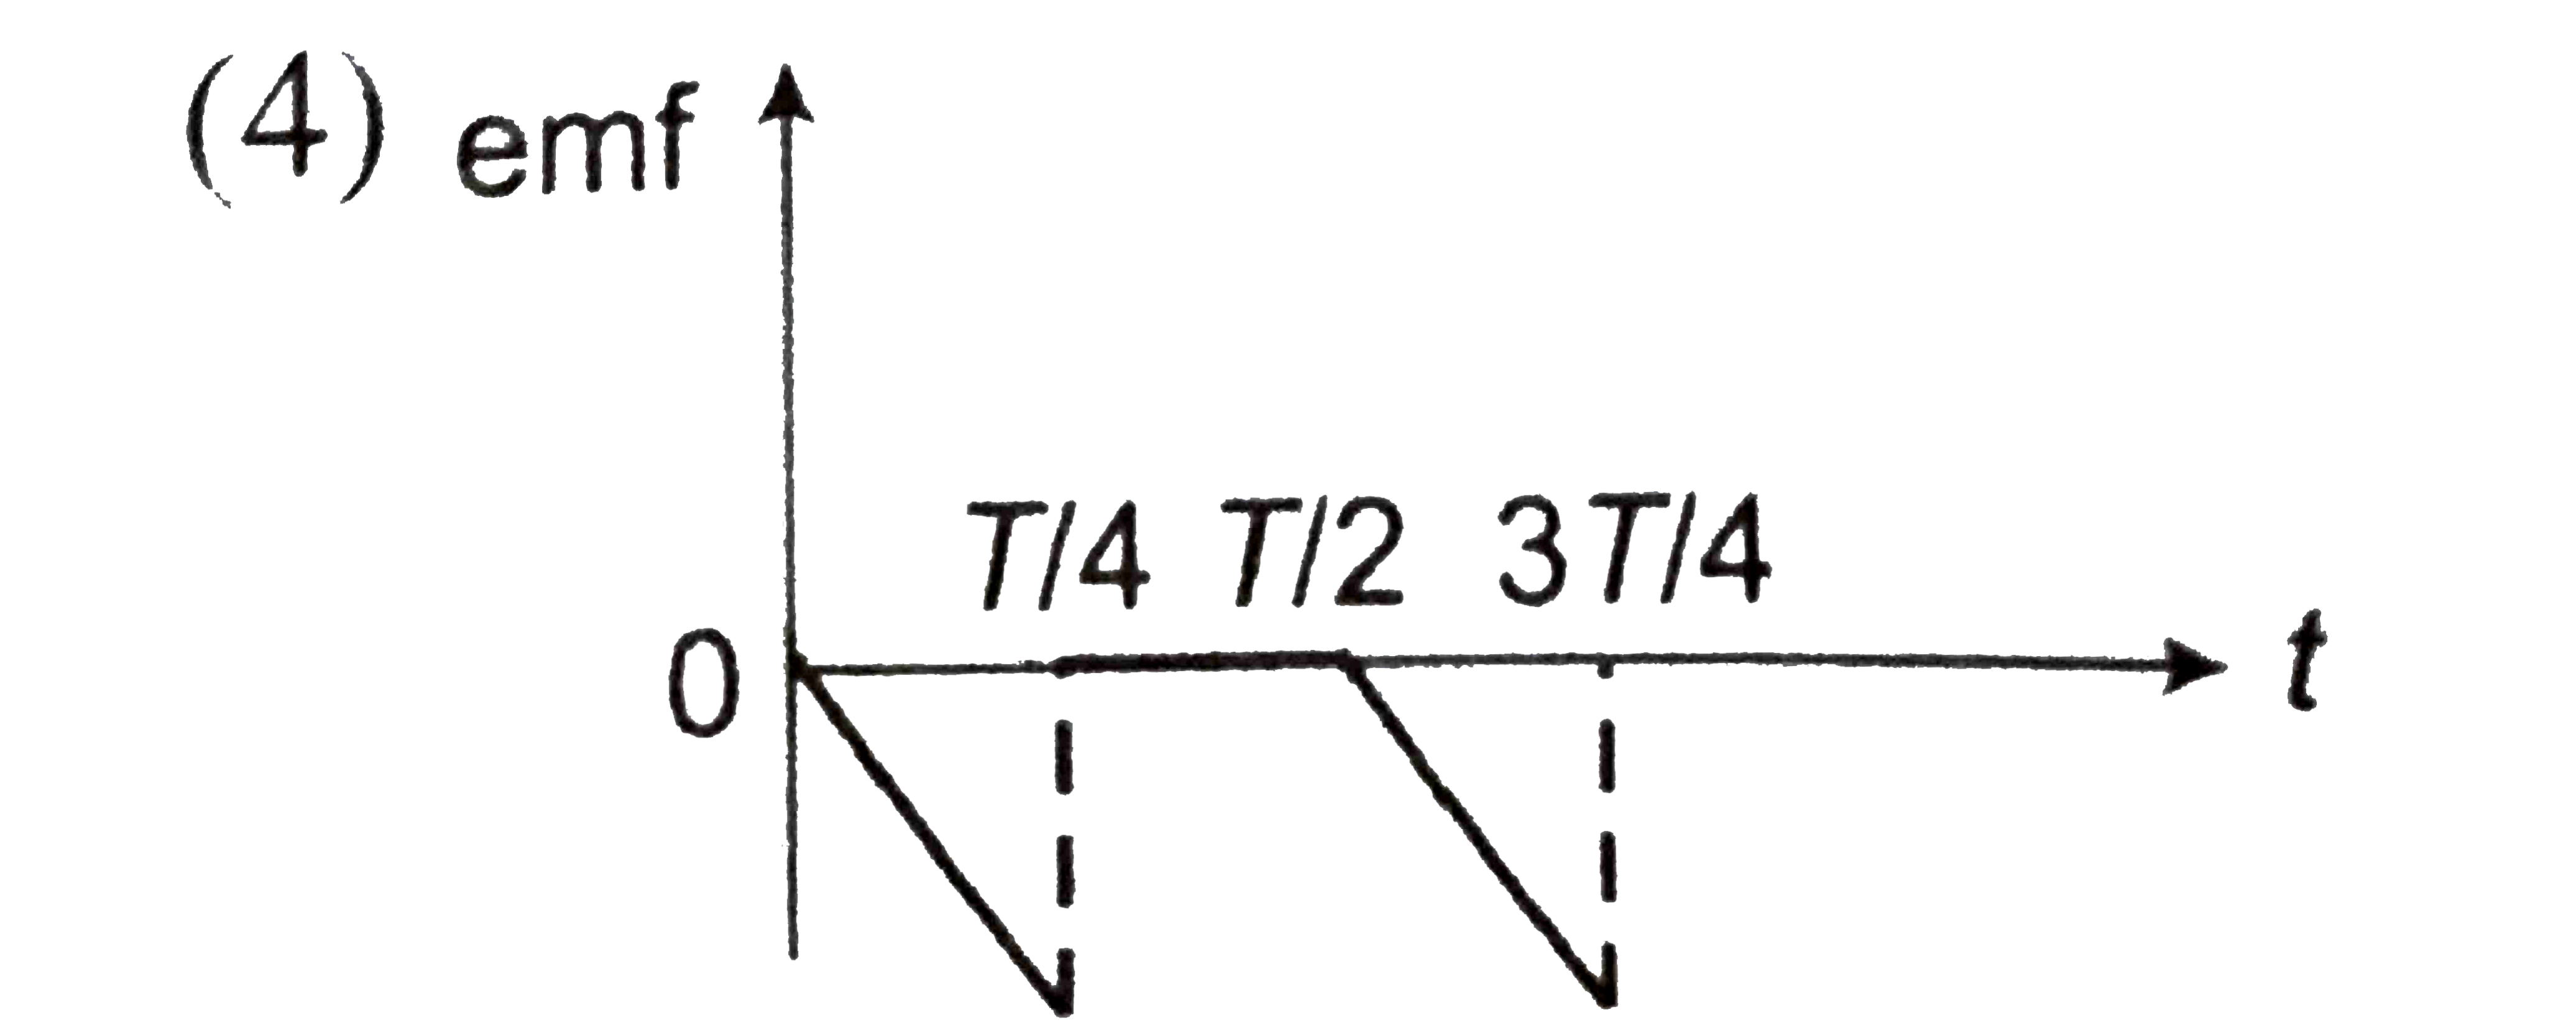
The current i in a coil varies with time as shown in the figure. The variation of induced emf with time would be
 A
A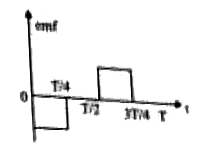 B
B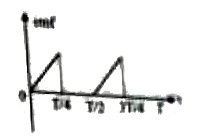 C
C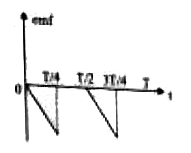 D
D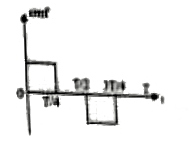
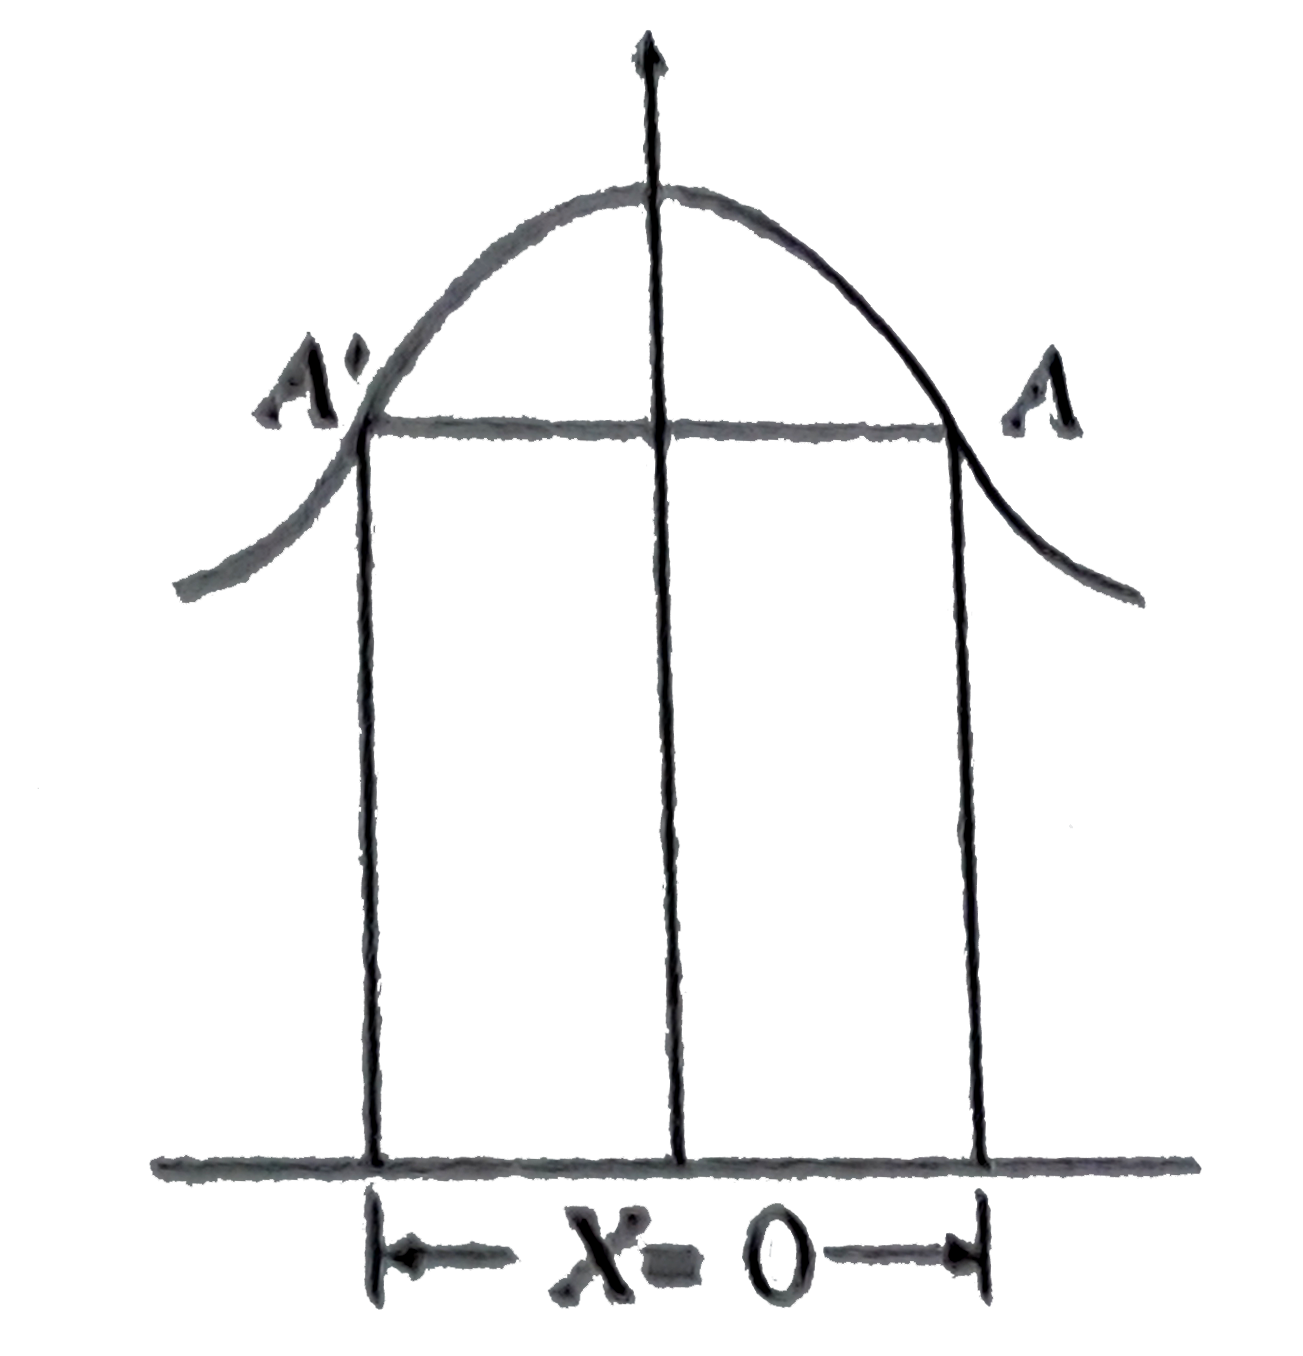
The variation of magnetic field (B) due to circular coil as the distance X varies is shown in the graph. Which of the following is false
View SolutionThe graph between the current and the time for an inductance coil is shown below. Which of the following graph show the voltage-time variation-
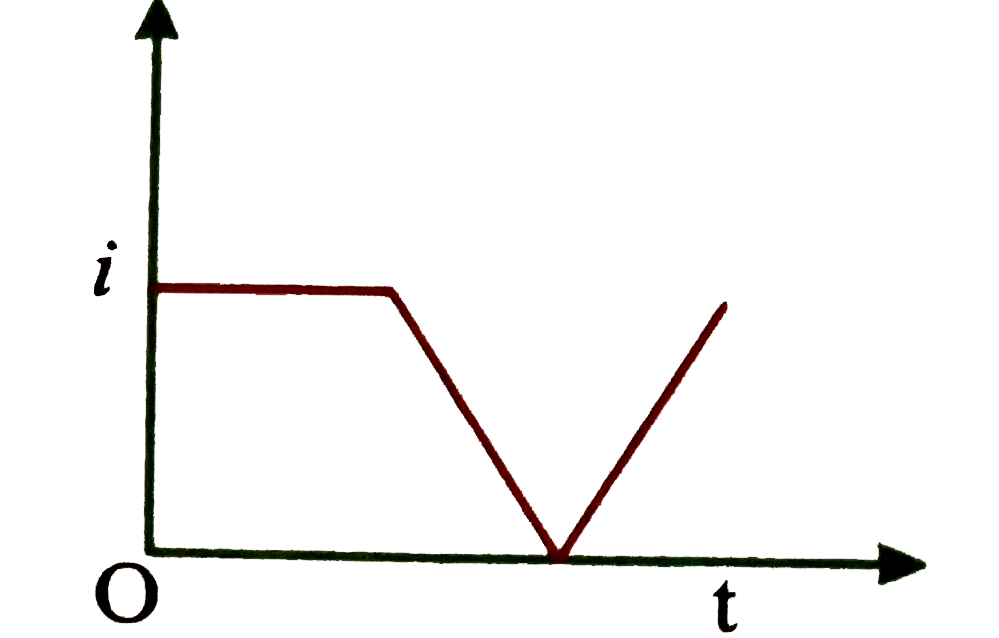
View SolutionThe current is an induction coil varies with time t, according to the graph shown in figure. Which of the following graphs shows the induced emf (e) in the coil with time.
View SolutionThe current I in an inductance coil varies with time according to the graph given in the figure.
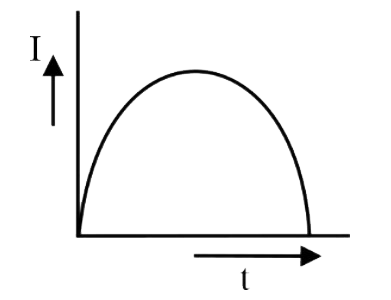
Which one of the following graphs gives the variation of voltage with time across the inductor?
View SolutionCurrent through the coil varies according to graph then induced emf v/s time graph is
View Solution

