Two infinitely long conducting parallel rails are connected through a capacitor C as shown in Fig. A conductor of length l is moved with constant speed v0. Which of the following graph truly depicts the variation of current through the conductor with time?
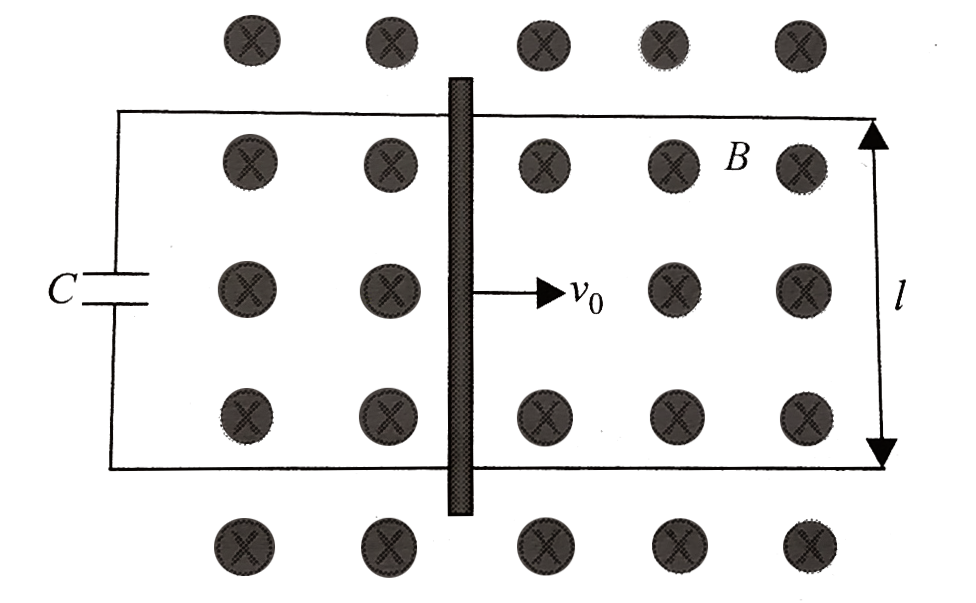
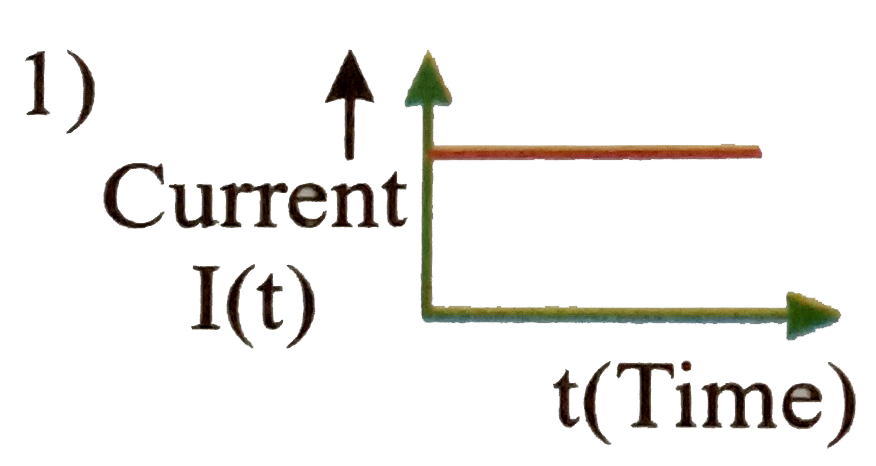
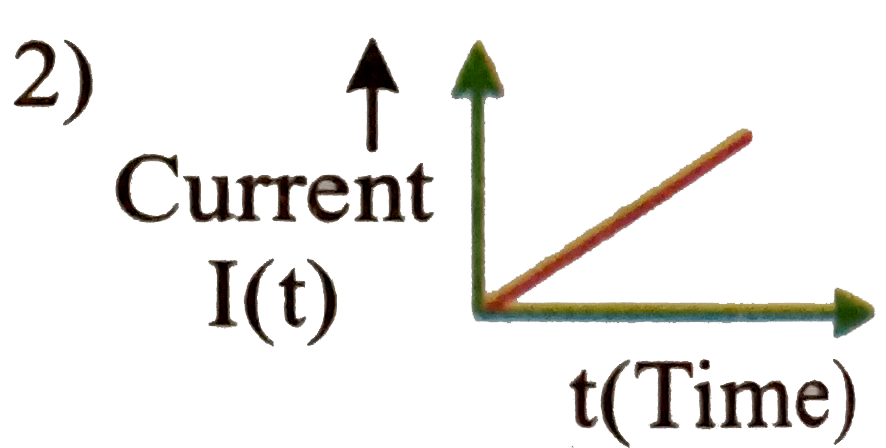
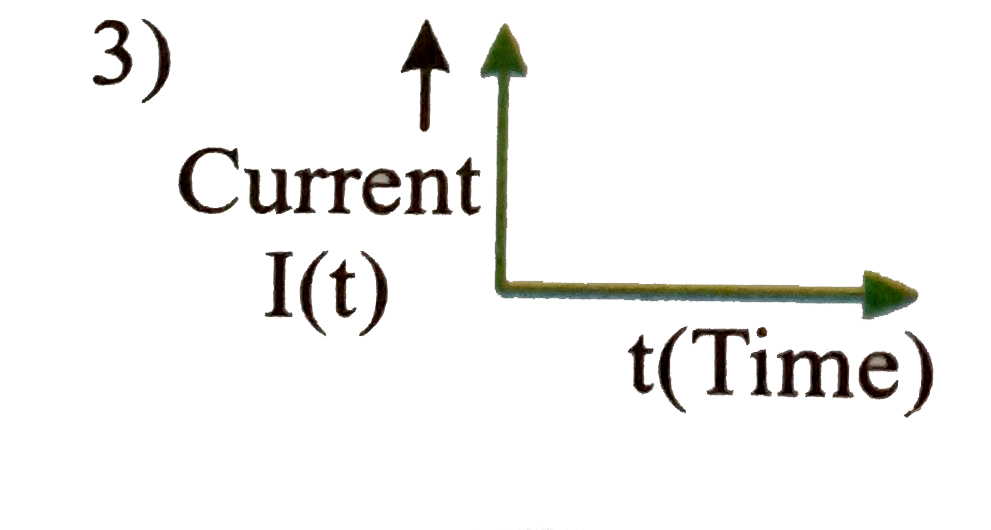
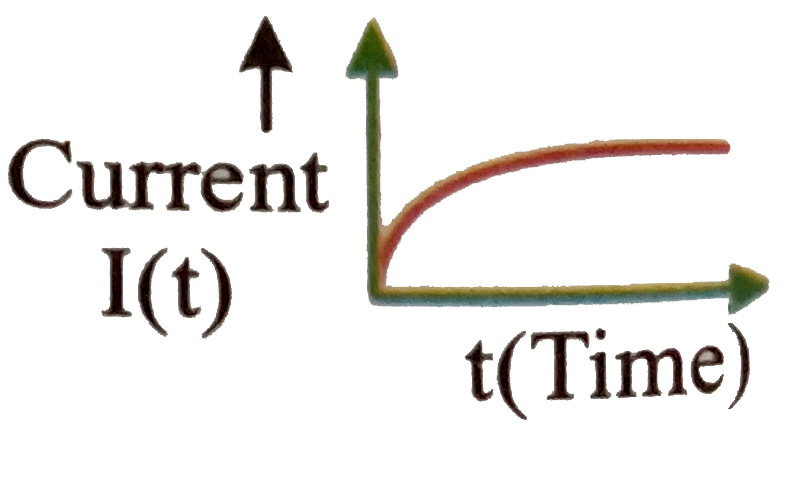
The correct Answer is:C
Step by step video, text & image solution for Two infinitely long conducting parallel rails are connected through a capacitor C as shown in Fig. A conductor of length l is moved with constant speed v_(0). Which of the following graph truly depicts the variation of current through the conductor with time? by Physics experts to help you in doubts & scoring excellent marks in Class 12 exams.
Updated on:21/07/2023Topper's Solved these Questions
- ELECTRO MAGNETIC INDUCTIONBook:NARAYNAChapter:ELECTRO MAGNETIC INDUCTIONExercise:Single Answer Questions Level -VI
Explore 13 Videos
- ELECTRO MAGNETIC INDUCTIONBook:NARAYNAChapter:ELECTRO MAGNETIC INDUCTIONExercise:Integer type questions
Explore 2 Videos
- ELECTRO MAGNETIC INDUCTIONBook:NARAYNAChapter:ELECTRO MAGNETIC INDUCTIONExercise:Single Answer Questions Level -V
Explore 11 Videos
- ELECTRIC CHARGES AND FIELDSBook:NARAYNAChapter:ELECTRIC CHARGES AND FIELDSExercise:EXERCISE -4
Explore 43 Videos
- ELECTRO MAGNETIC WAVESBook:NARAYNAChapter:ELECTRO MAGNETIC WAVESExercise:LEVEL-II(H.W)
Explore 14 Videos
Similar Questions
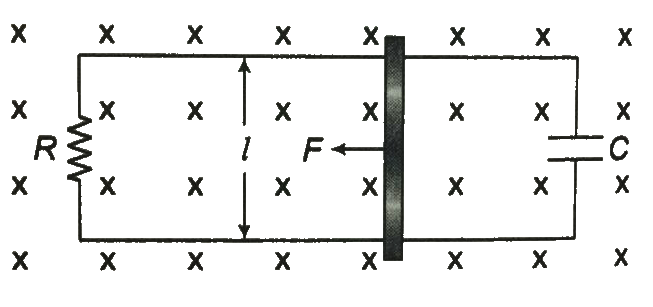
Two parallel long smooth conducting rails separated by a distance l are connected by a movable conducting connector of mass m. Terminals of the rails are connected by the resistor R and the capacitor C as shown in figure. A uniform magnetic field B perpendicular to the plane of the rail is switched on. The connector is dragged by a constant force F. Find the speed of the connector as a function of time if the force F is applied at t=0. Also find the terminal velocity of the connector.
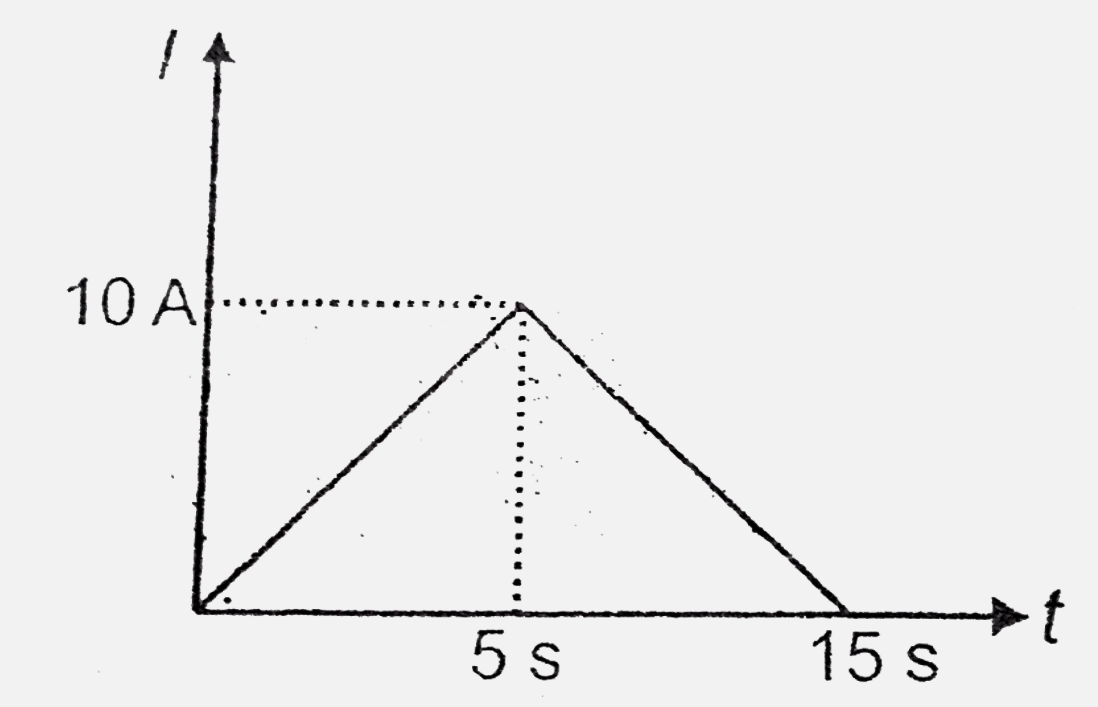
View SolutionCurrent l versus time t graph through a conductor is shown in the figure. Average current through the conductor in the interval 0 to 15 s is
View Solution
Knowledge Check
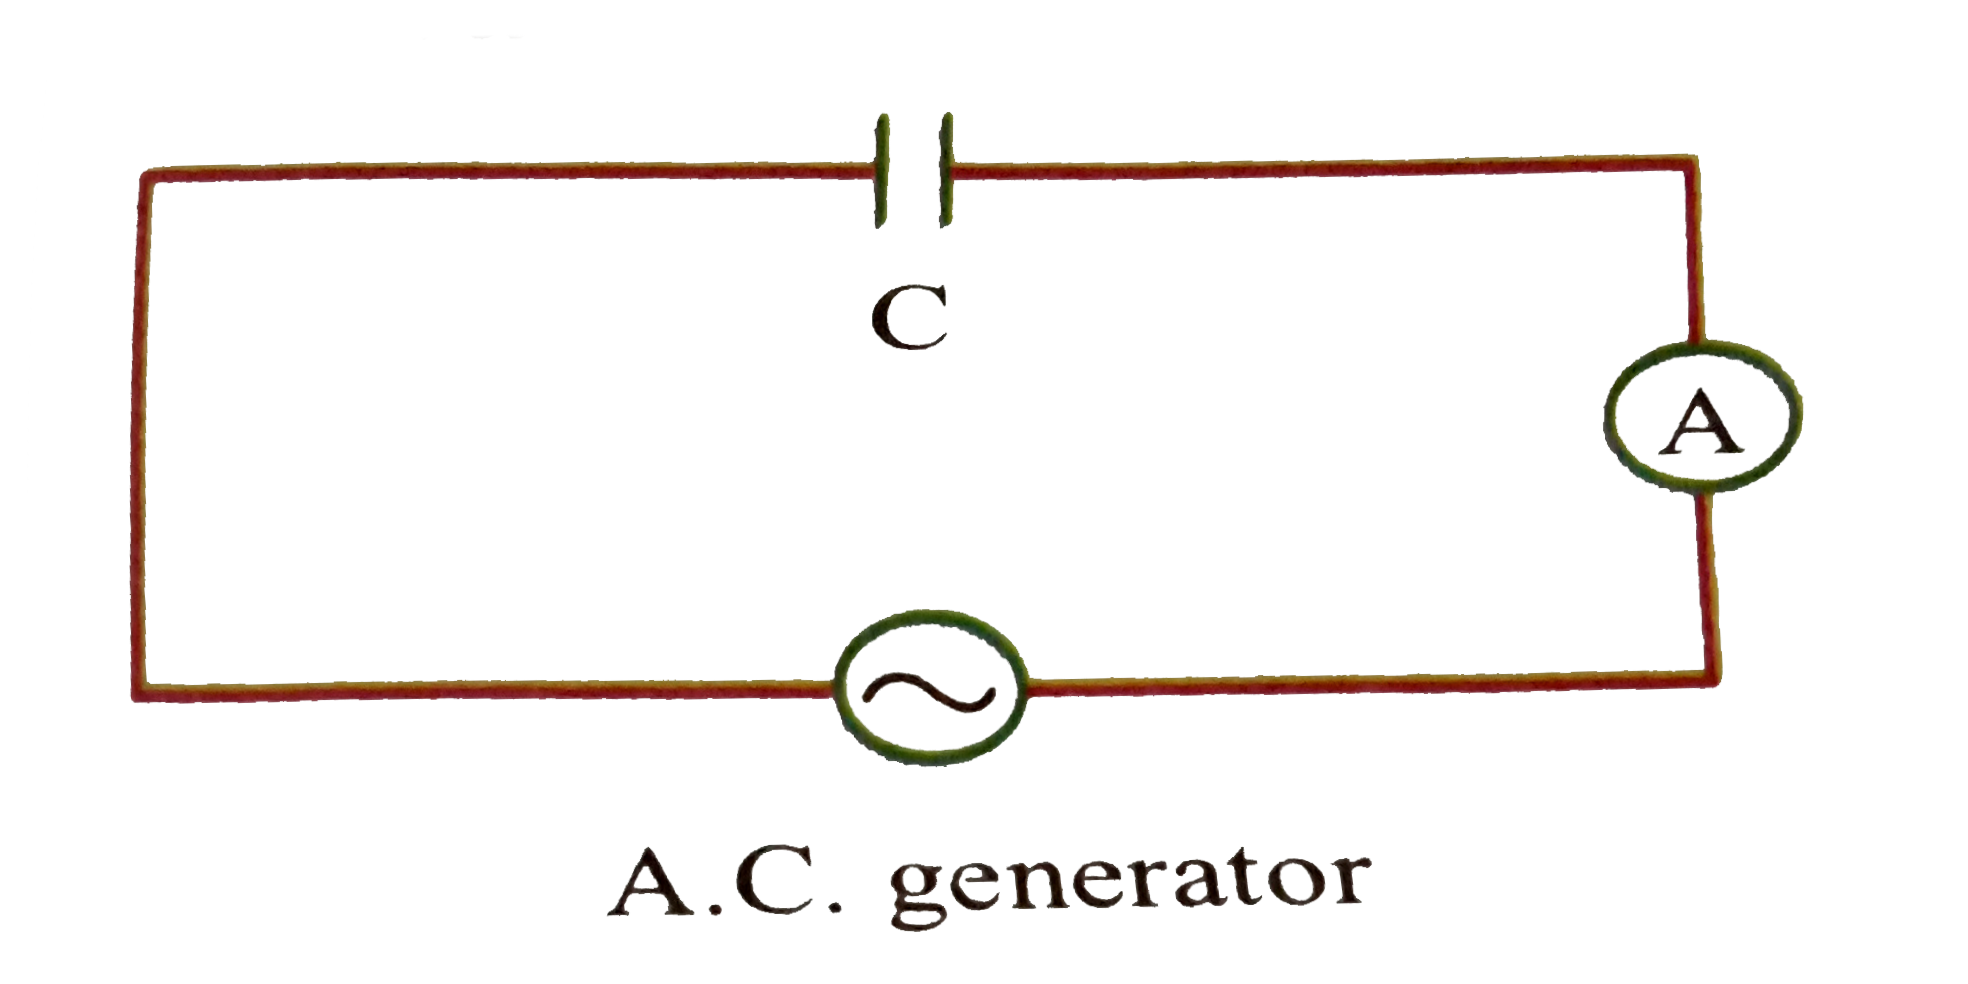
A constant voltage at different frequencies is applied across a capacitance C as shown in the figure. Which of the following graphs correctly depicts the variation of current with frequency
 A
A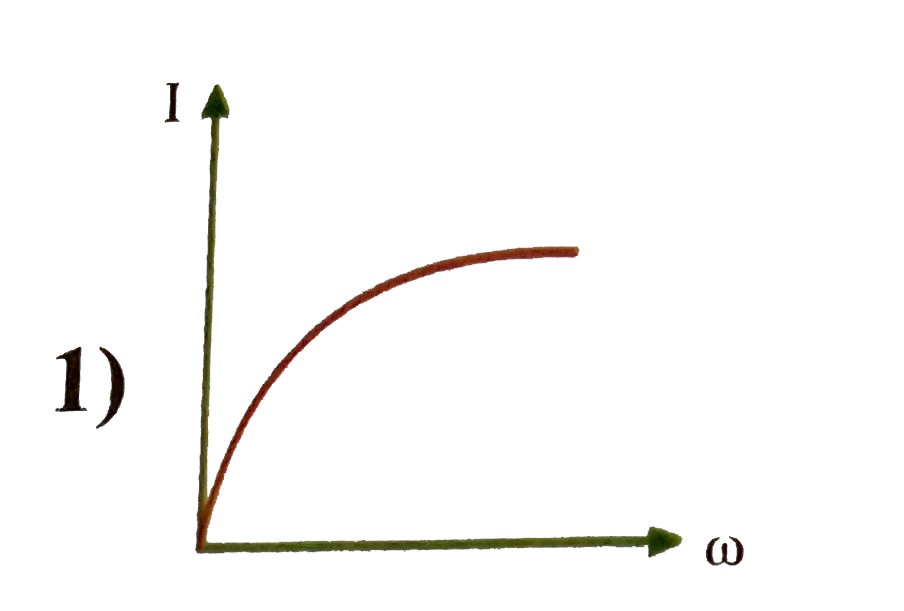 B
B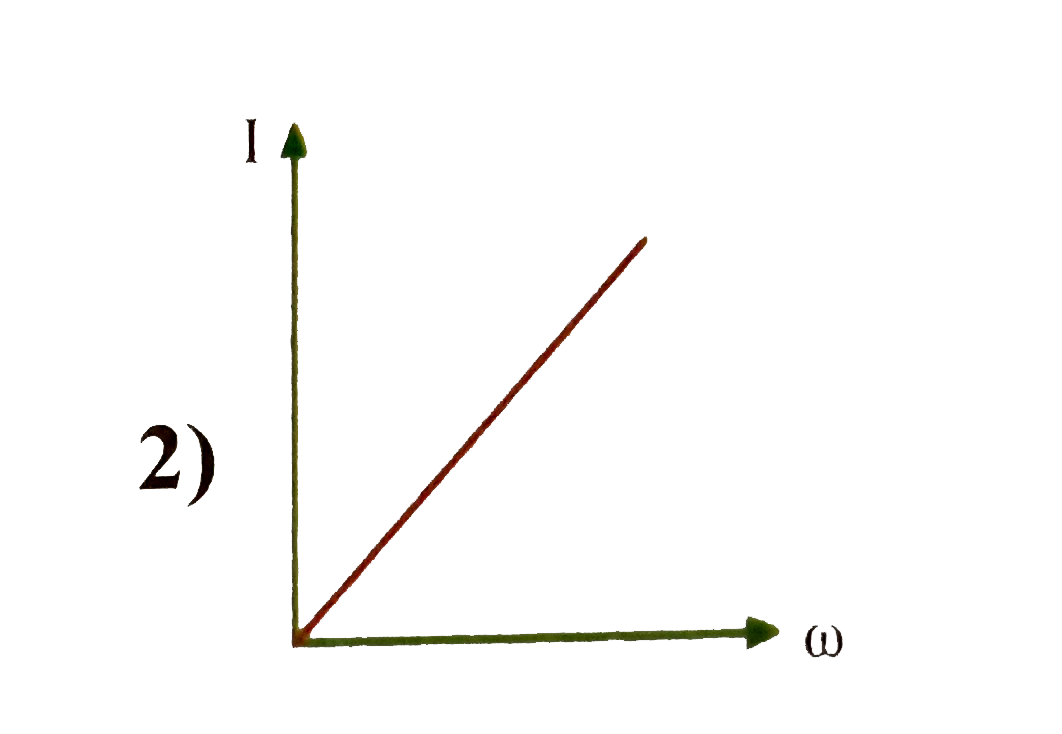 C
C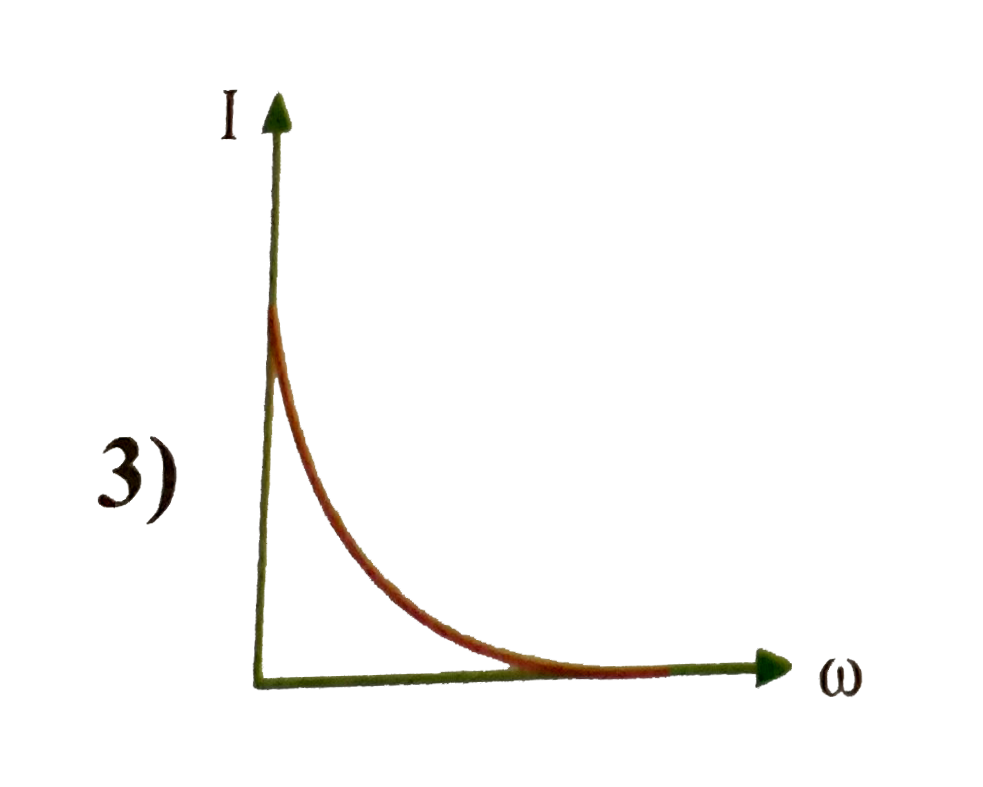 D
D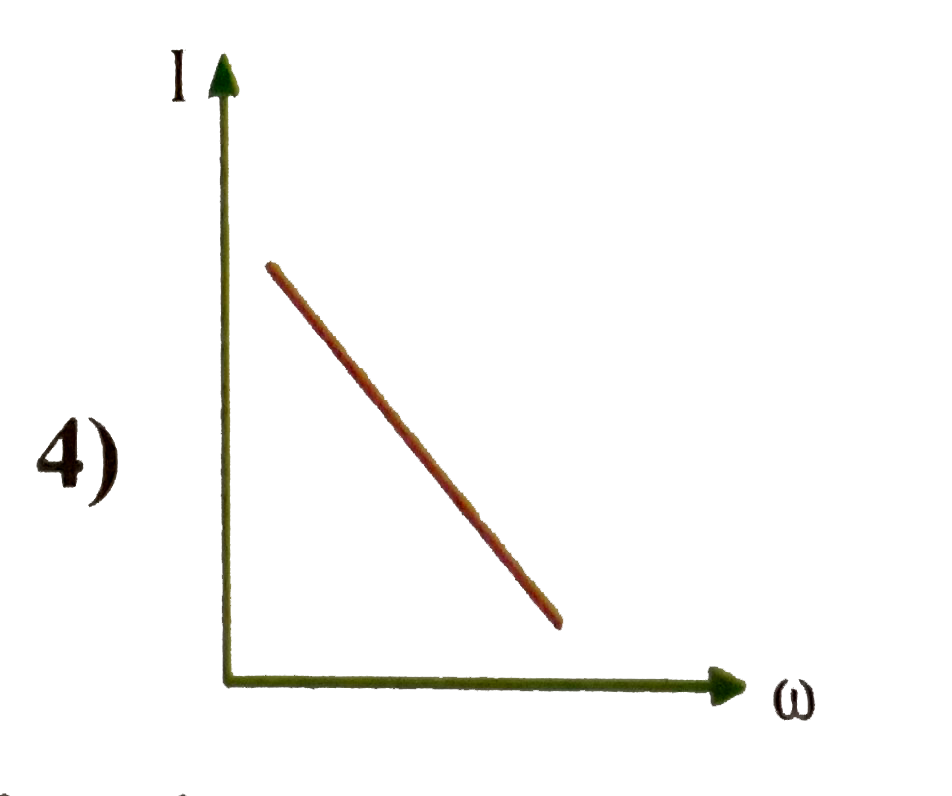
A constant voltage at different frequencies is applied across a capacitance C as shown in the figure.
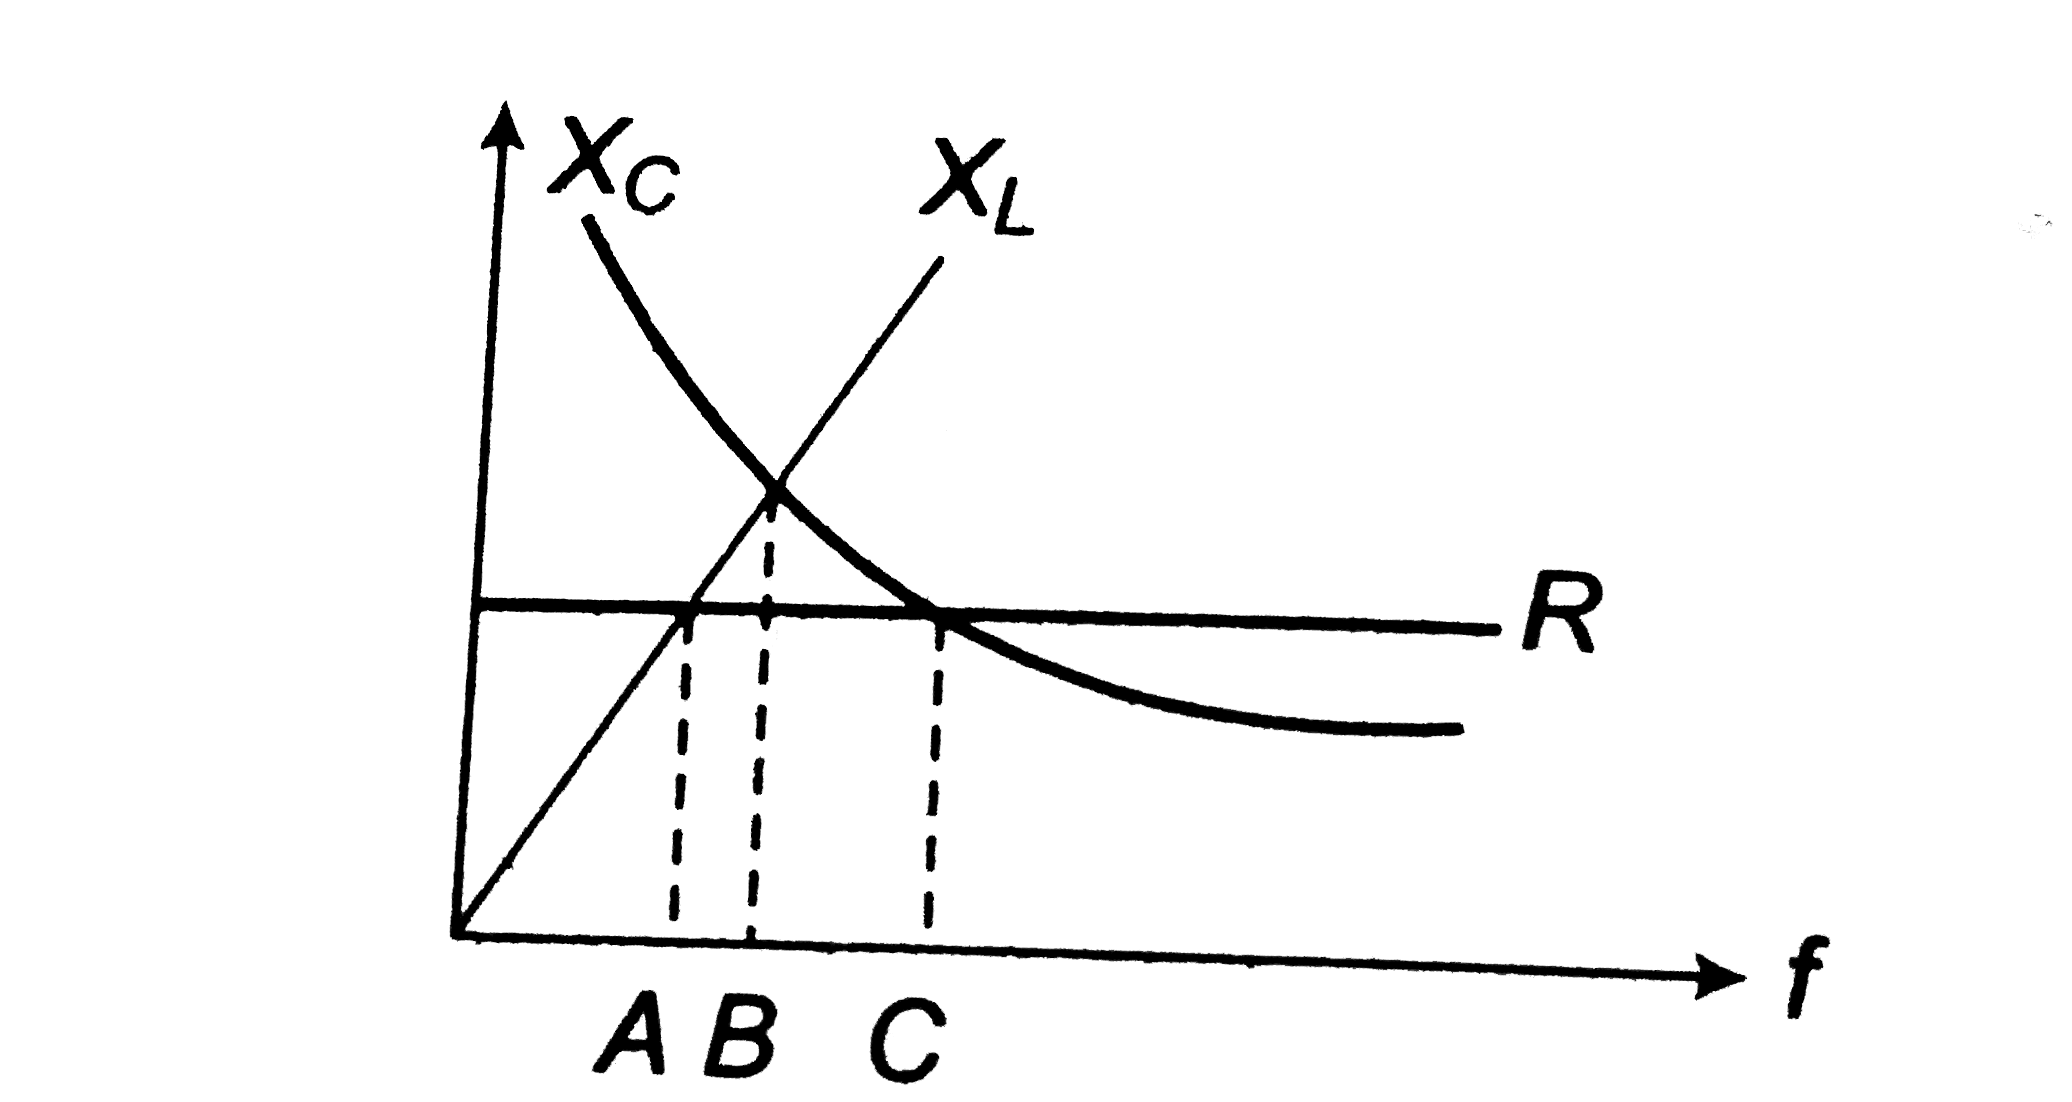
Which of the following graphs correctly depicts the variation of current with frequency?A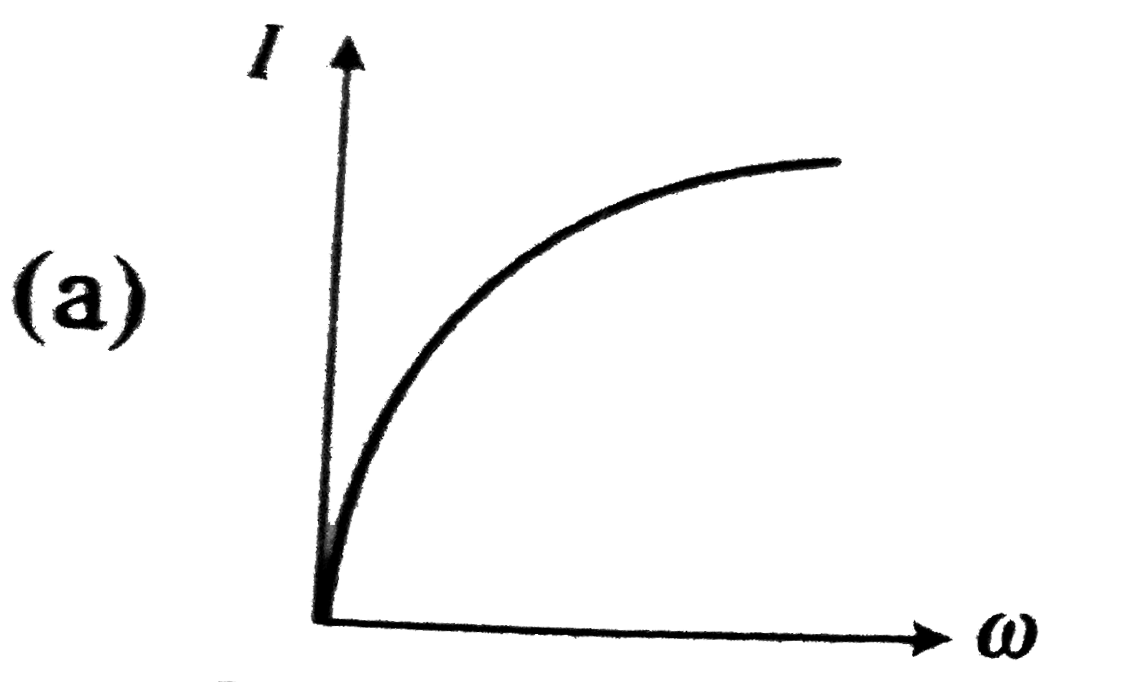 B
B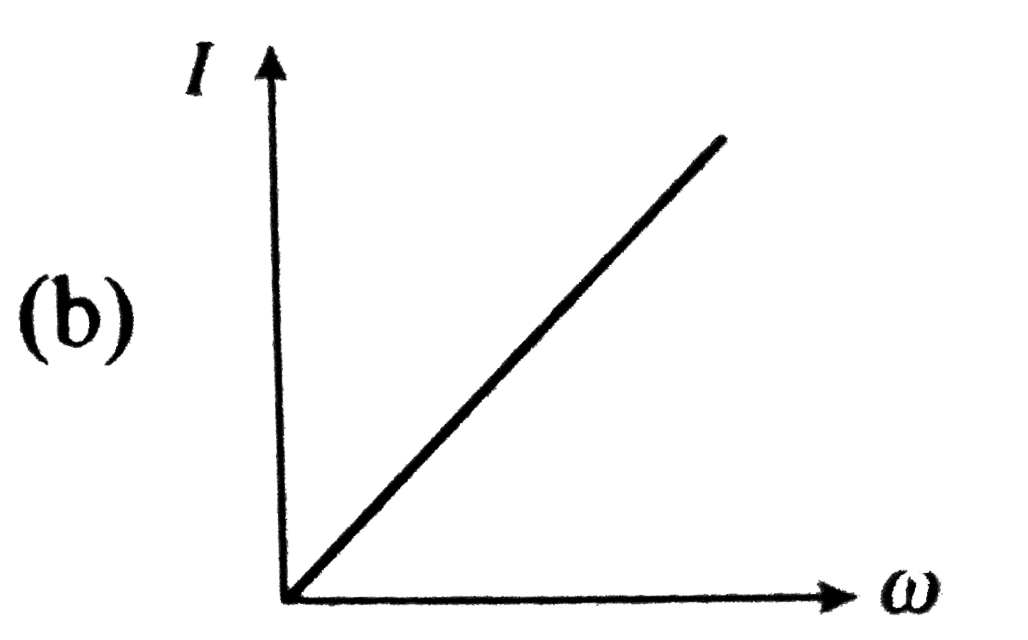 C
C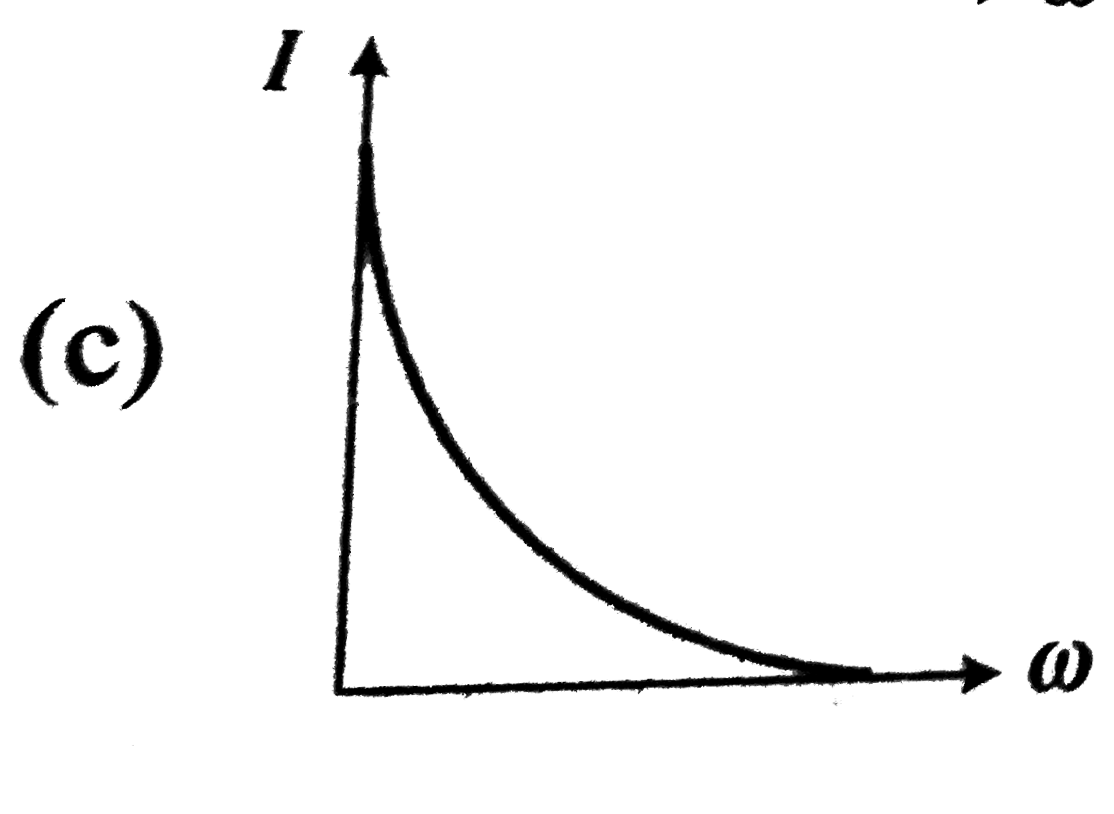 D
D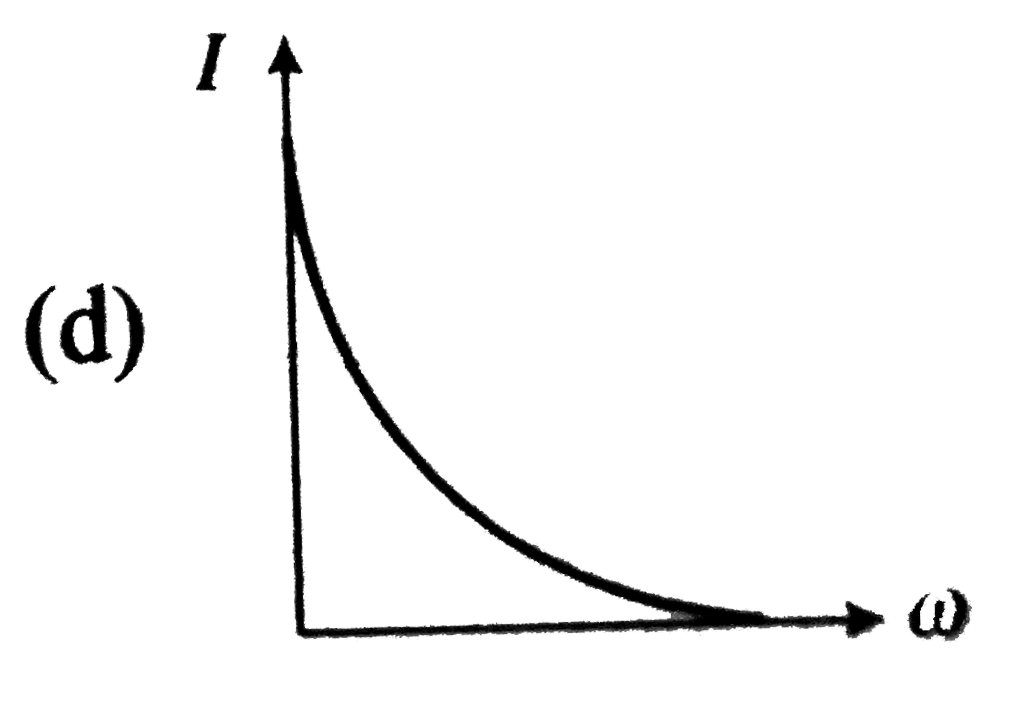
Two smooth horizontal parallel conducting rails are connected with a capacitor and a resistor at the two ends as shown. A uniform conducting rod PQ of mass 'm' and length 'l' is dragged with a constant horizontal force 'F'. The terminal velocity aquired by the conducting rod is
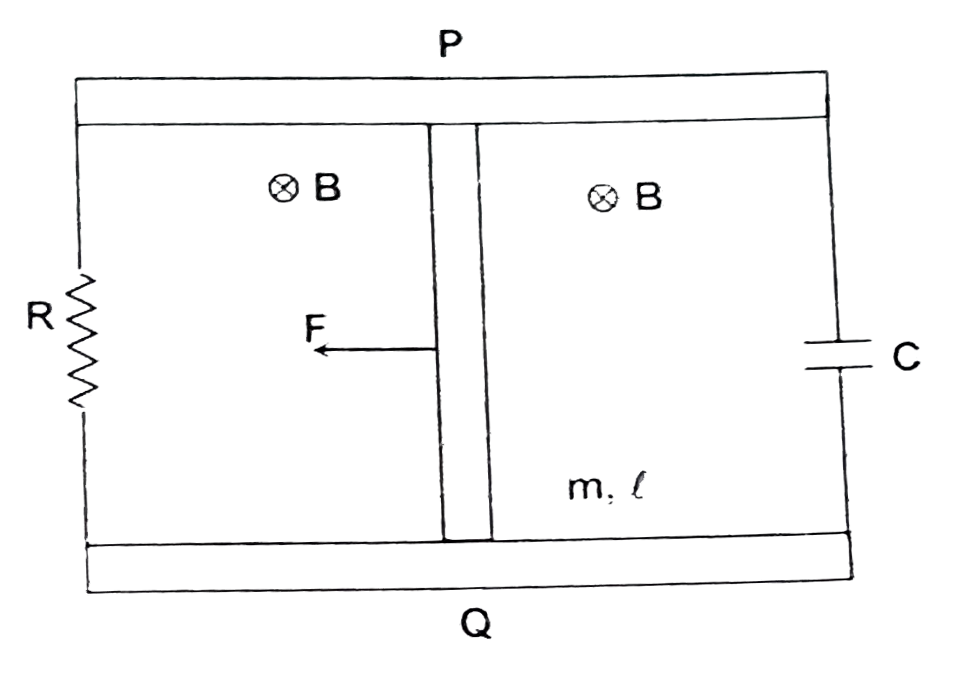 A4FRB2l2B2FRB2l2CFRB2l2DFR2B2l2
A conducting rod is moving with a constant velocity v over the parallel conducting rails which are connected at the ends through a resistor R and capacitor C as shown in the figure. Magnetic field B is into the plane. Consider the following statements.
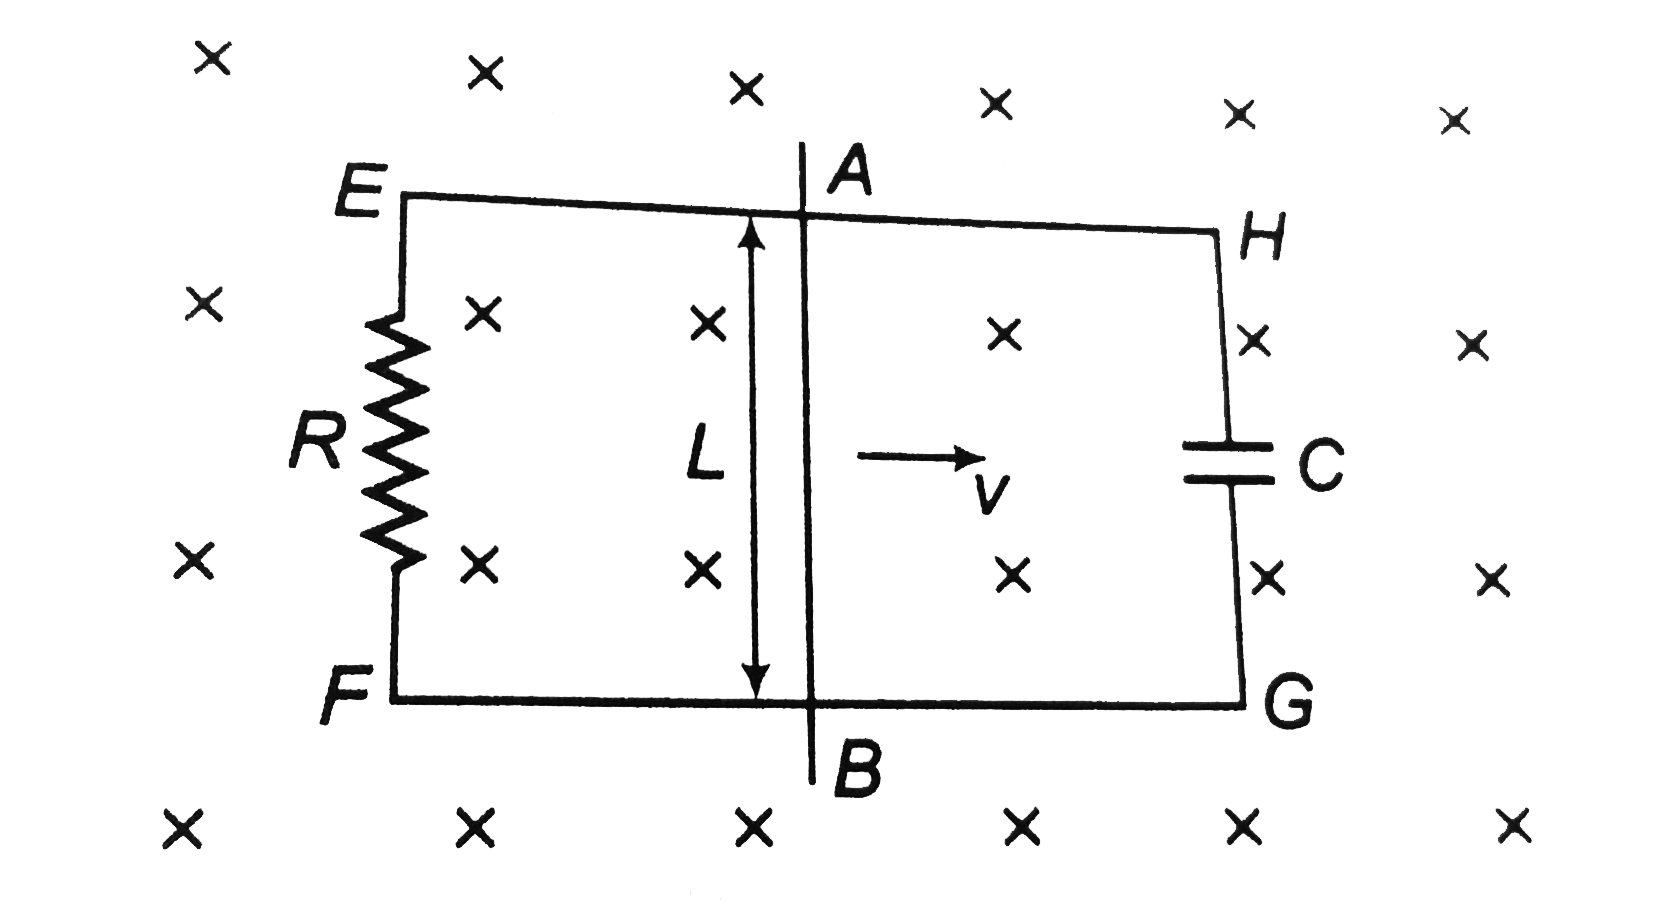
i. Current in loop AEFBA is anti clockwise, ii. Current in loop AEFBA is clockwise
iii Current through the capacitor is zero
iv Energy stored in the caspacitor is 12CB2L2v2
Which is the following options in correct?
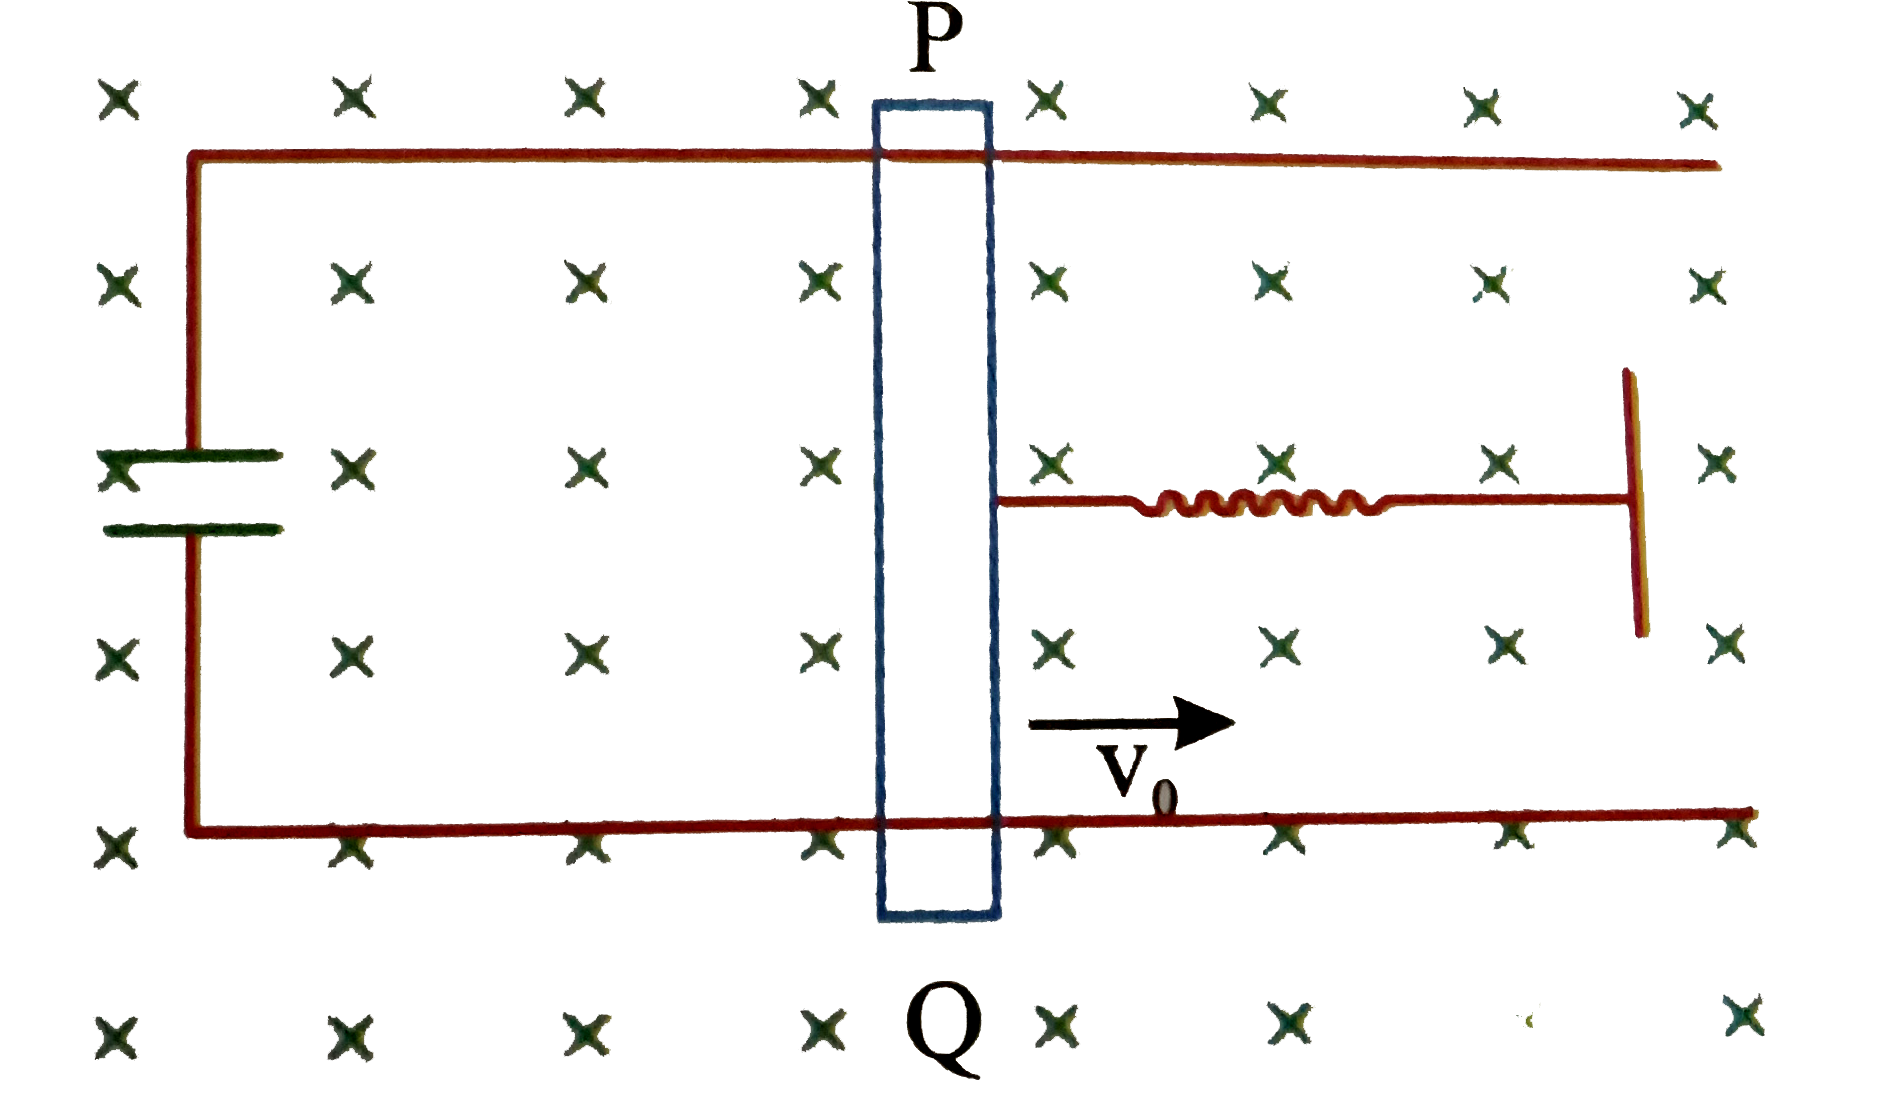
View SolutionA conducting rod PQ of mass m and length l is placed on two long parallel (smooth and conducting) rails connected to a capacitor as shown. The rod PQ is connected to a non conducting spring of spring constant k, which is initially in relaxed state. The entire arrangement is placed in a magnetic feild perpendicular to the plane of figure.
Neglect the resistance of the rails and rod.
Now, the rod is imparted a velocity v0 towards right, then acceleration of the rod as a function of its displacement x given by
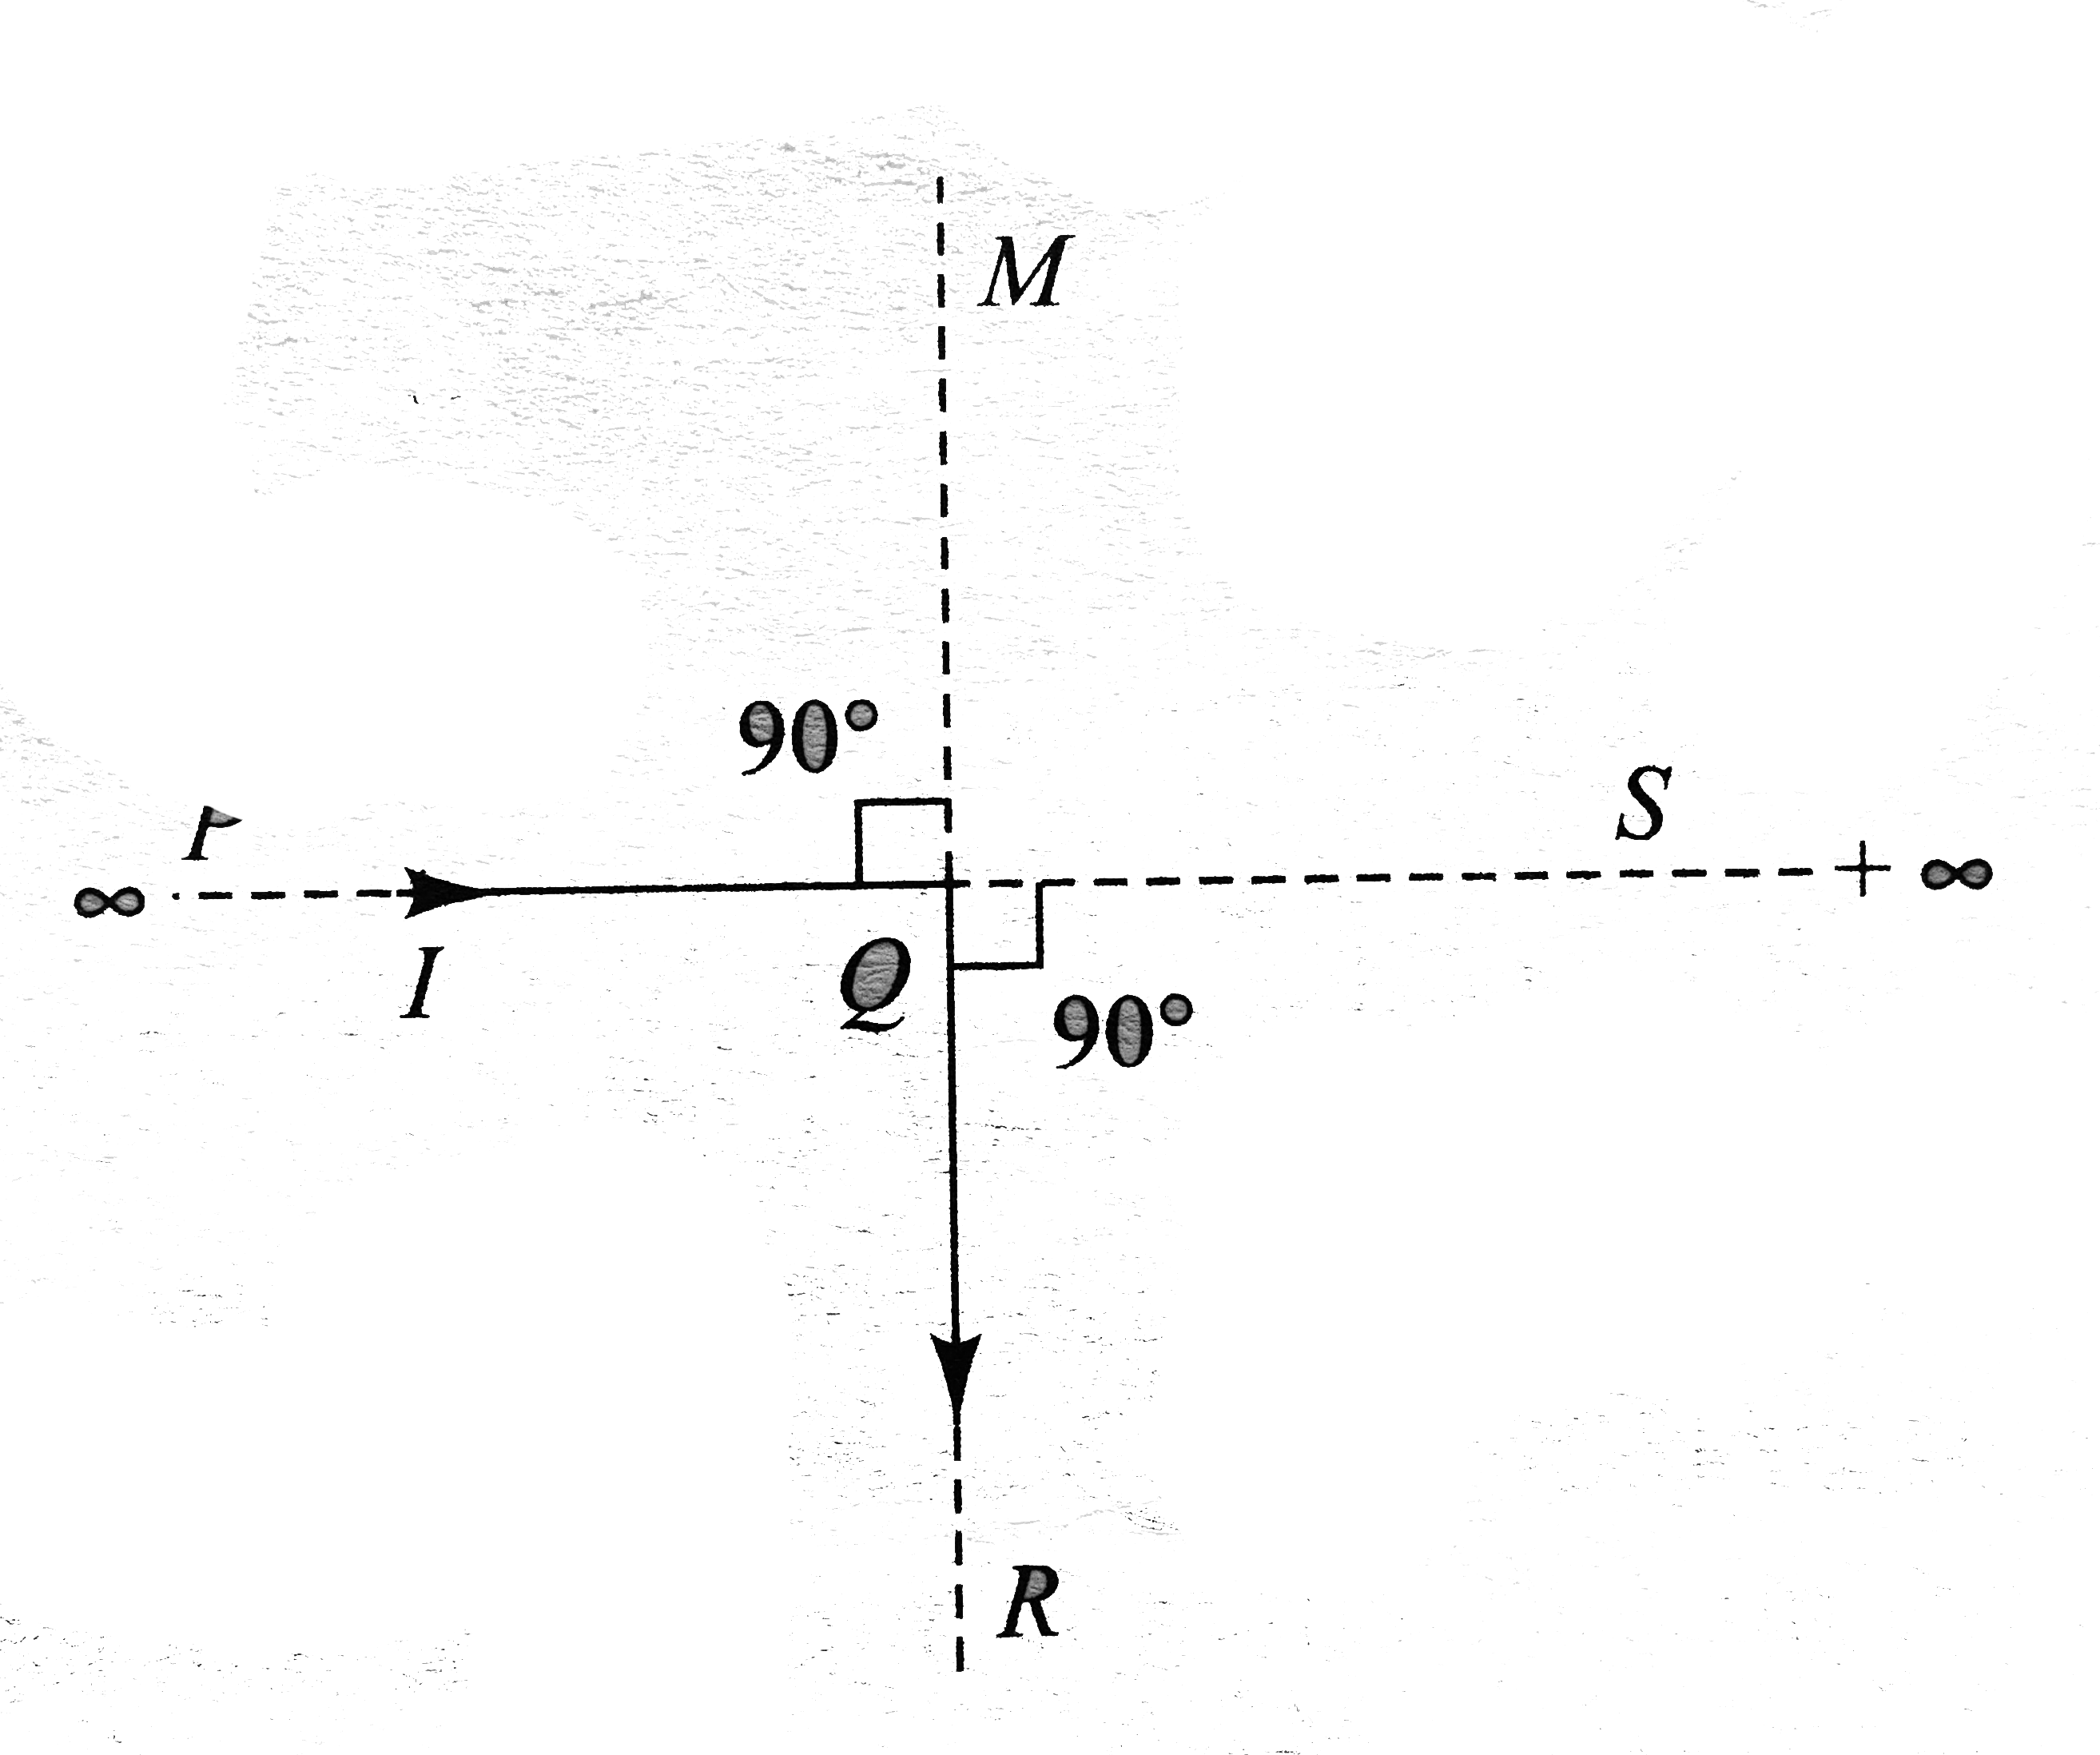
View SolutionAn infinetely long conductor PQR is bent tor form a right angle as shown in Fig. A current I flows through PQR. The magnetic field due to this current carrying conductor at the point M is B1. Now, another infinitely long straight conductor QS, is connected at Q so that the current is 12I in QR as well as in QS, is the current in PQ remaininig unchanged. The magnetic field at M is now B2. The ratio B1/B2 is given by
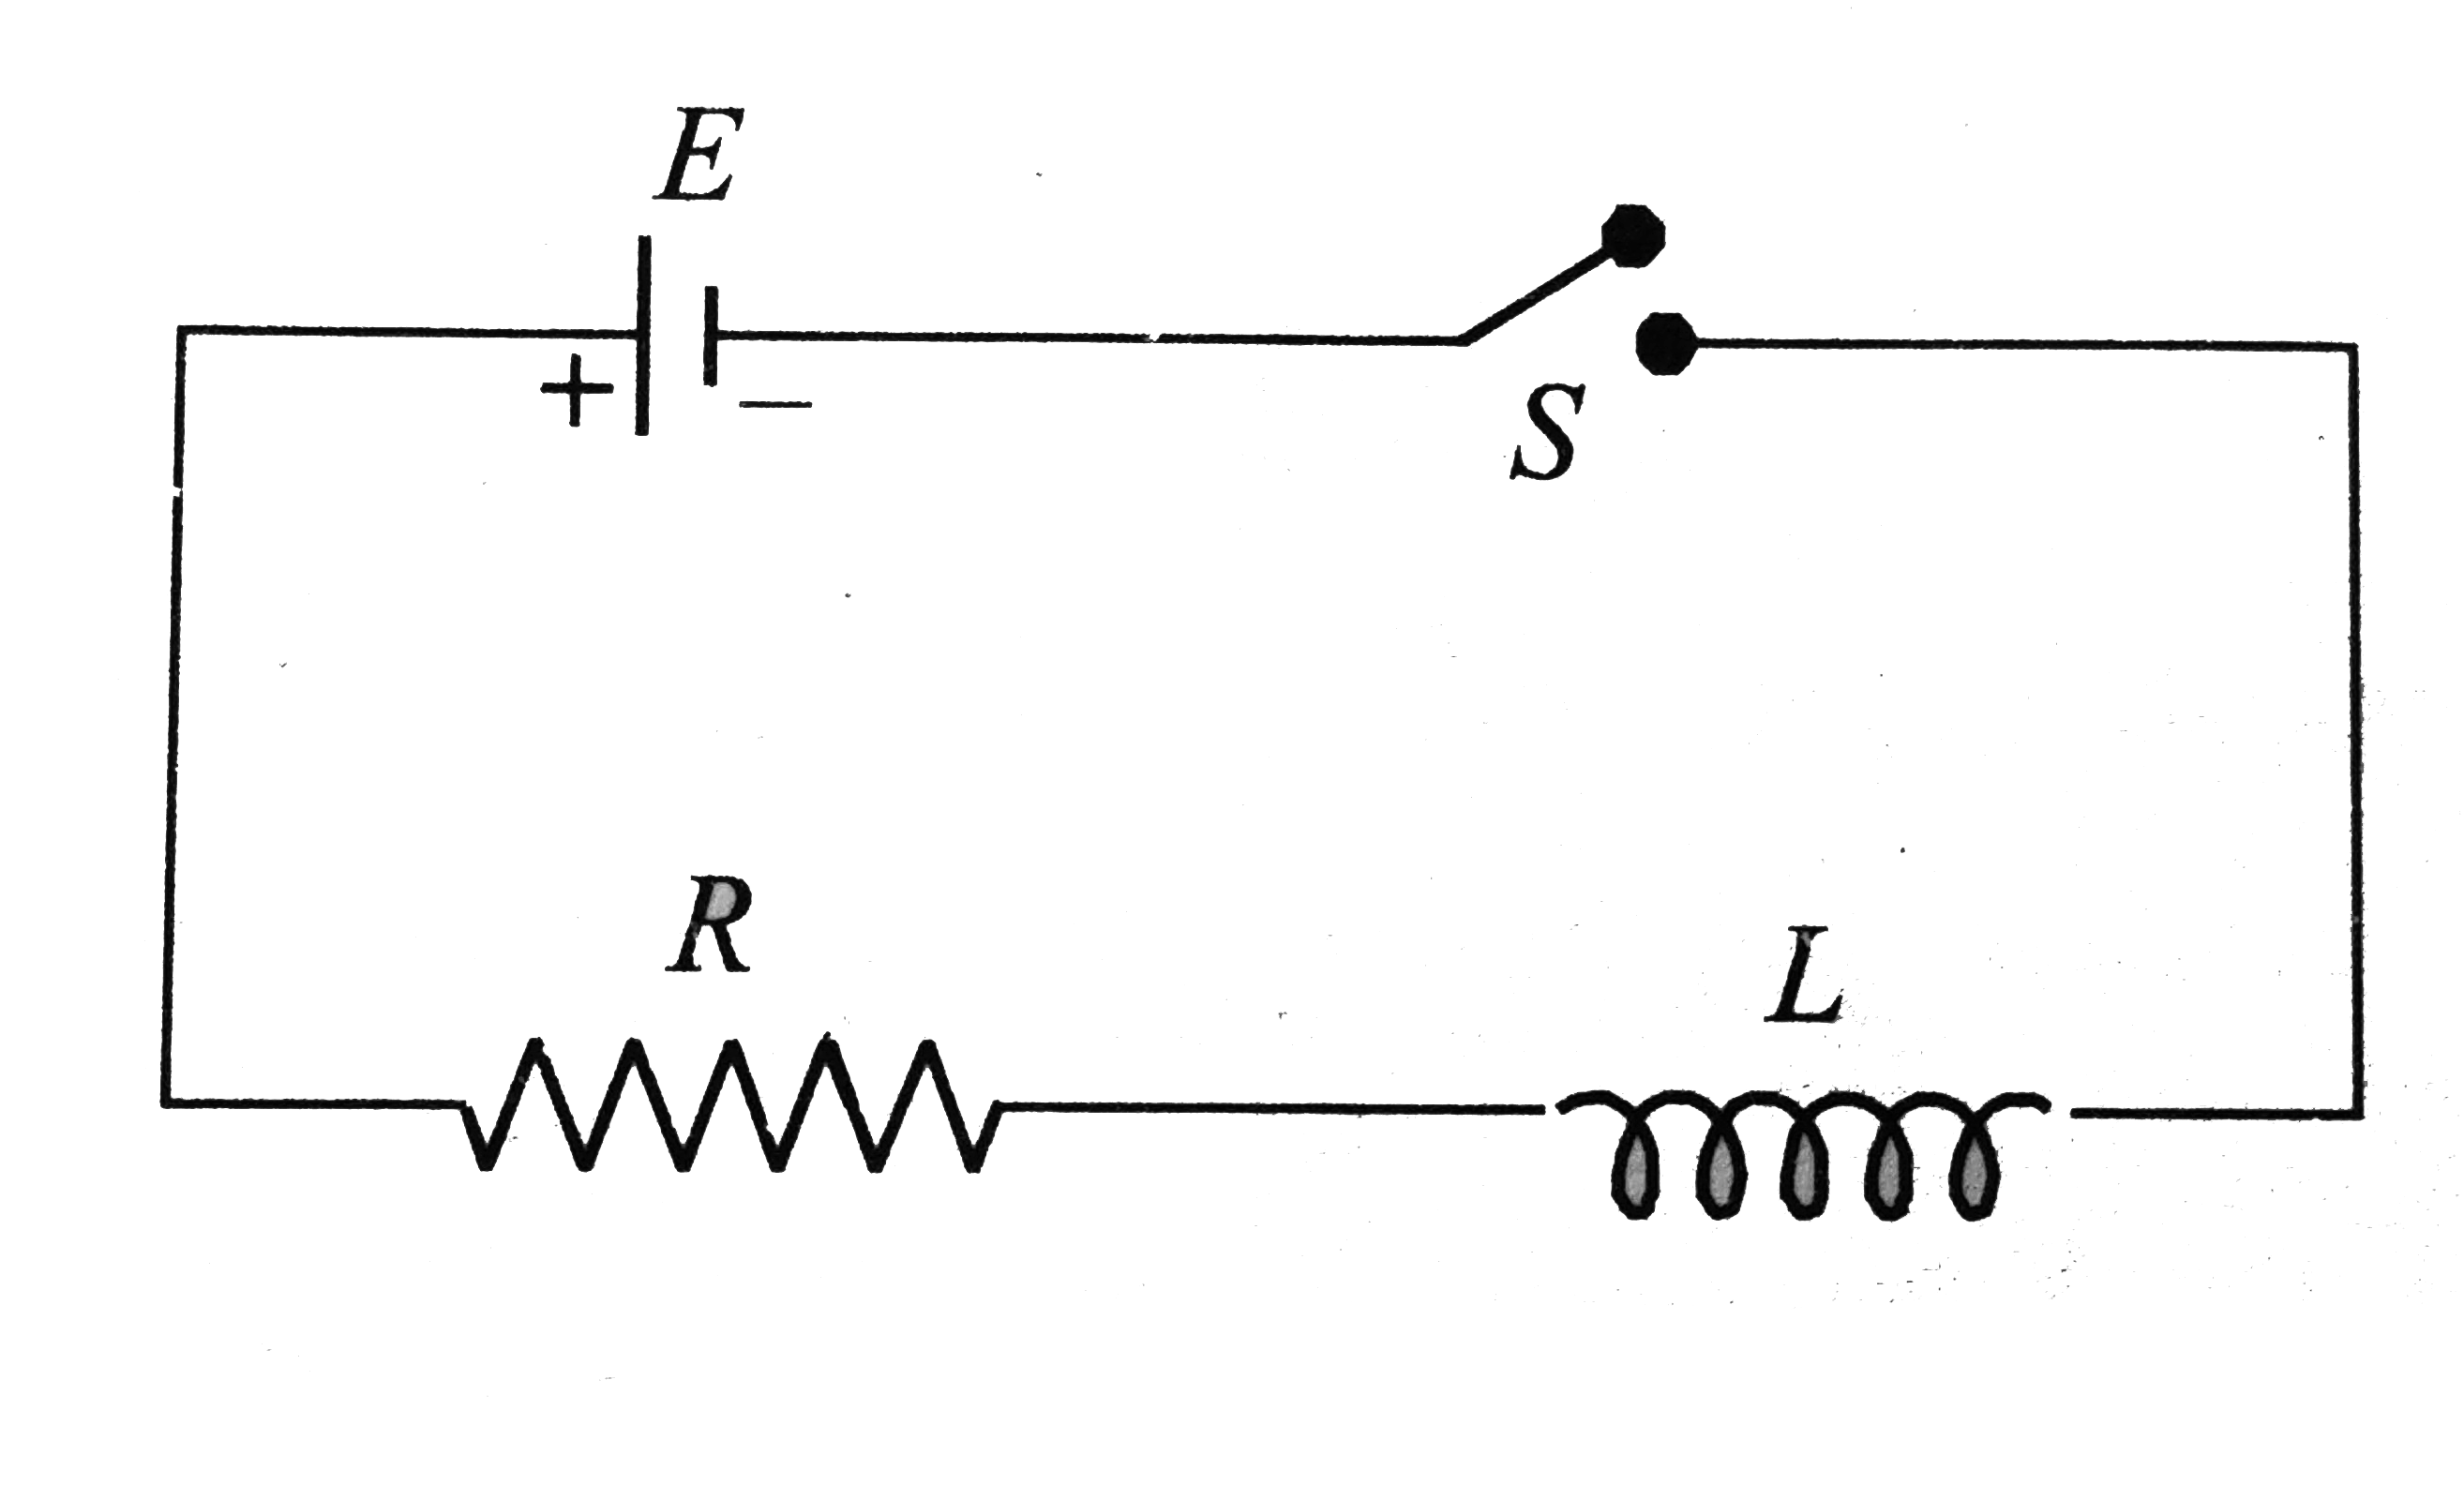
View SolutionSwitch S of the circuit shows in Fig. is closed at t=0. If e denotes the induced emf in L and i the current flowing through the circuit at time t, then which of the following graphs correctly represents the variation of e with i?
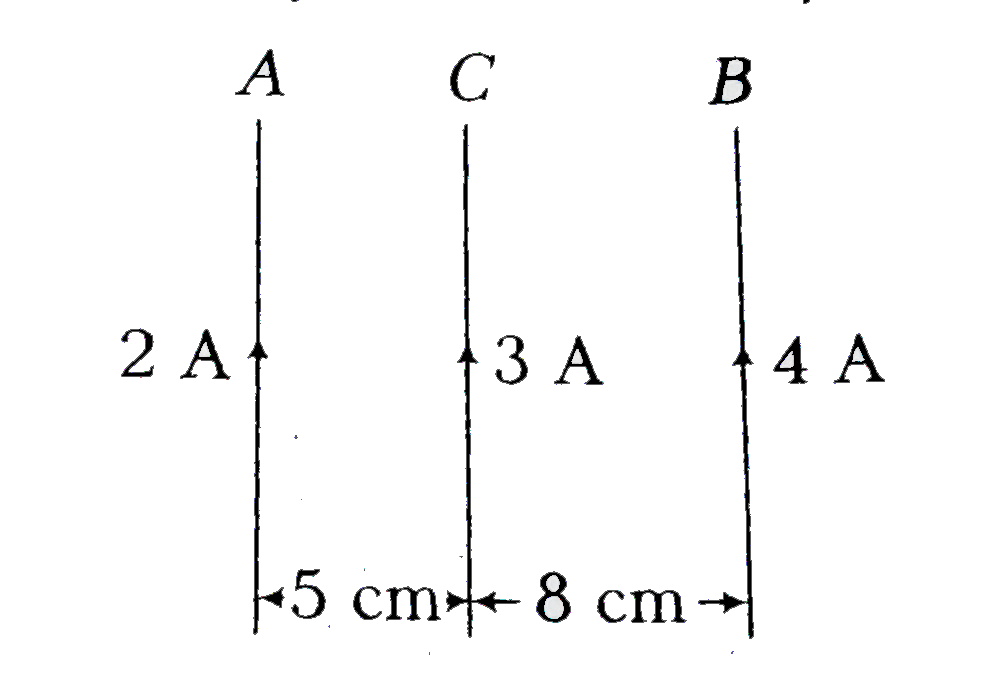
View SolutionA and B are two infinitely long straight parallel conductors. C is another straight of length 1 m parallel to A and B . The magnitude and direction of the force experienced by C
View Solution

