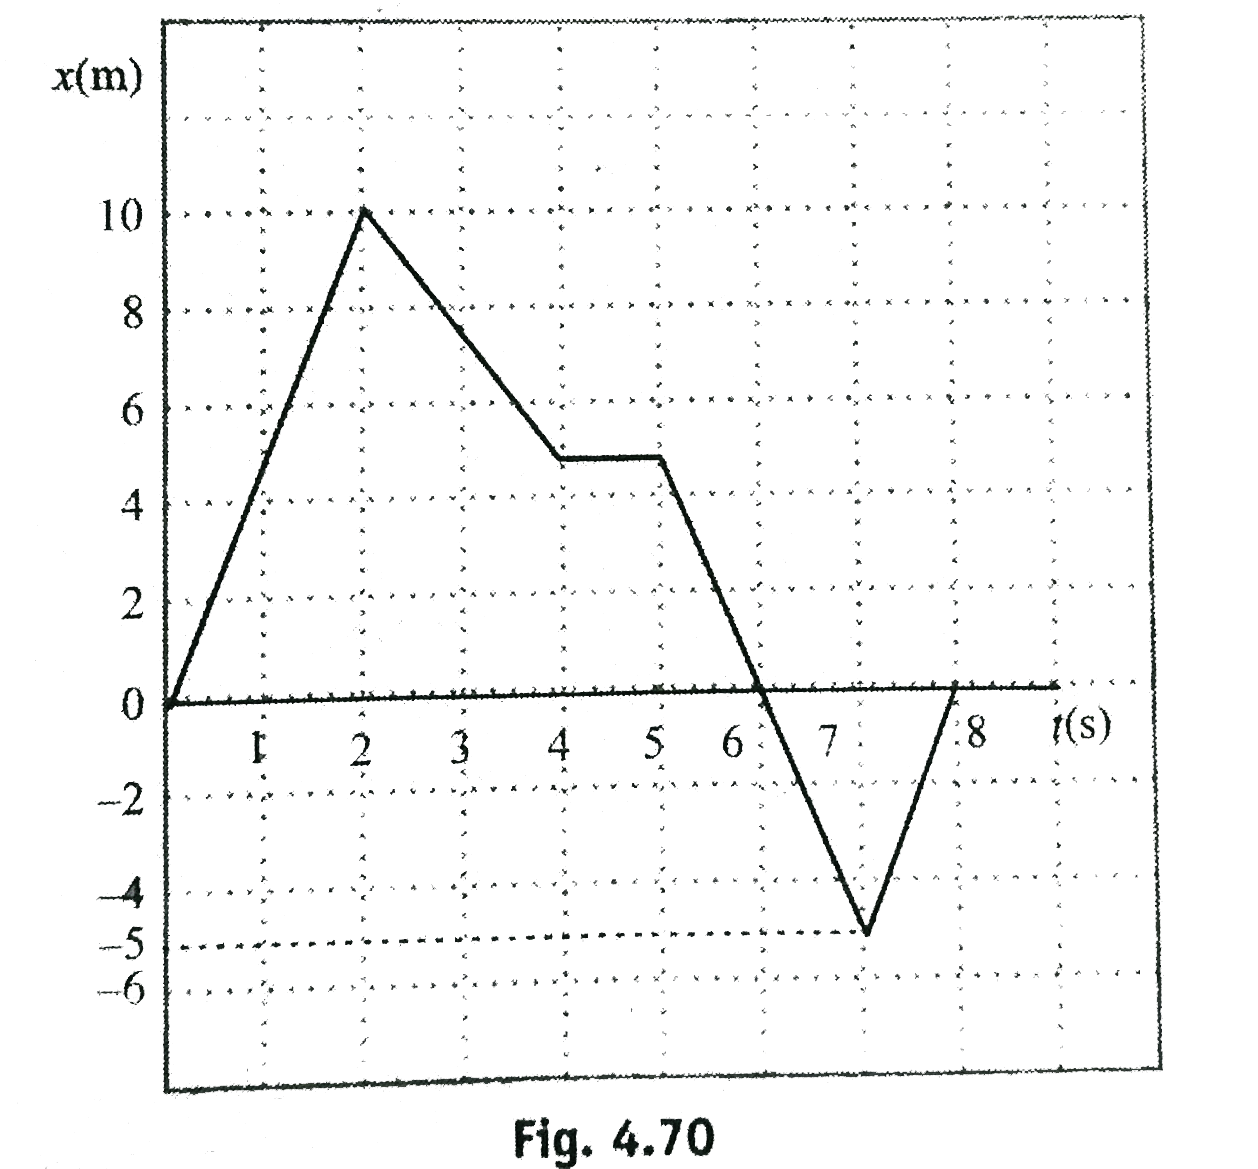
The position verus time graph time graph for a certain particle moving along the x-axis is shown in . Find the average velocity in the time intervals (a) 0 to 2s, (b) 2s to 4s, and (c) 4,s to 7s,
 .
.
We are given the values of time, but the values of the position are to obtained from the graph correspondin to the given time interval under consideration. We know that the sope of the displacement -time graph represents velocitt.
Formula to be used: vav=x2−x1t2−tt, where x1 and x2 are the initial and final values of time, respitions, respectively, and t1 and t2 are the initial and final values of time, frspectively.
a. Here x1=10m,x2=5m,t1=2,.t2=4s.
Therfore, the requited average velocity is giben by
vab10−02−0=ms−1
b. Here x1=10m,x2=5m,t1=2s,t2=4s.
So the repuired value of average velocity is given by
vav=5−104−2=−2.5ms−1
c. Here x1=5m,x2=−5m,t1=4s,t2=7s.
So the repuired value of average velocity is given by
vav=−5−57−4=−103=−3.3ms−1.
Topper's Solved these Questions
- KINEMATICS-1BOOK - CENGAGE PHYSICSCHAPTER - KINEMATICS-1EXERCISE - Solved Examples
9 Videos
- KINEMATICS-1BOOK - CENGAGE PHYSICSCHAPTER - KINEMATICS-1EXERCISE - Exercise 4.1
17 Videos
- GRAVITATIONBOOK - CENGAGE PHYSICSCHAPTER - GRAVITATIONEXERCISE - INTEGER_TYPE
1 Videos
- KINEMATICS-2BOOK - CENGAGE PHYSICSCHAPTER - KINEMATICS-2EXERCISE - Exercise Integer
9 Videos
Similar Questions
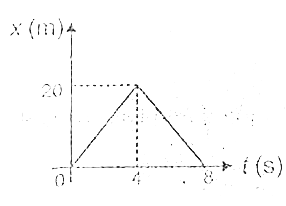
The position (X)-time (t) graph for a particle of mass 1 kg moving along x-axis is shown in figure. Find impulse on particle at t = 4 s.
View SolutionThe v-t graph for a particle moving along x-axis is shown in the figure, find
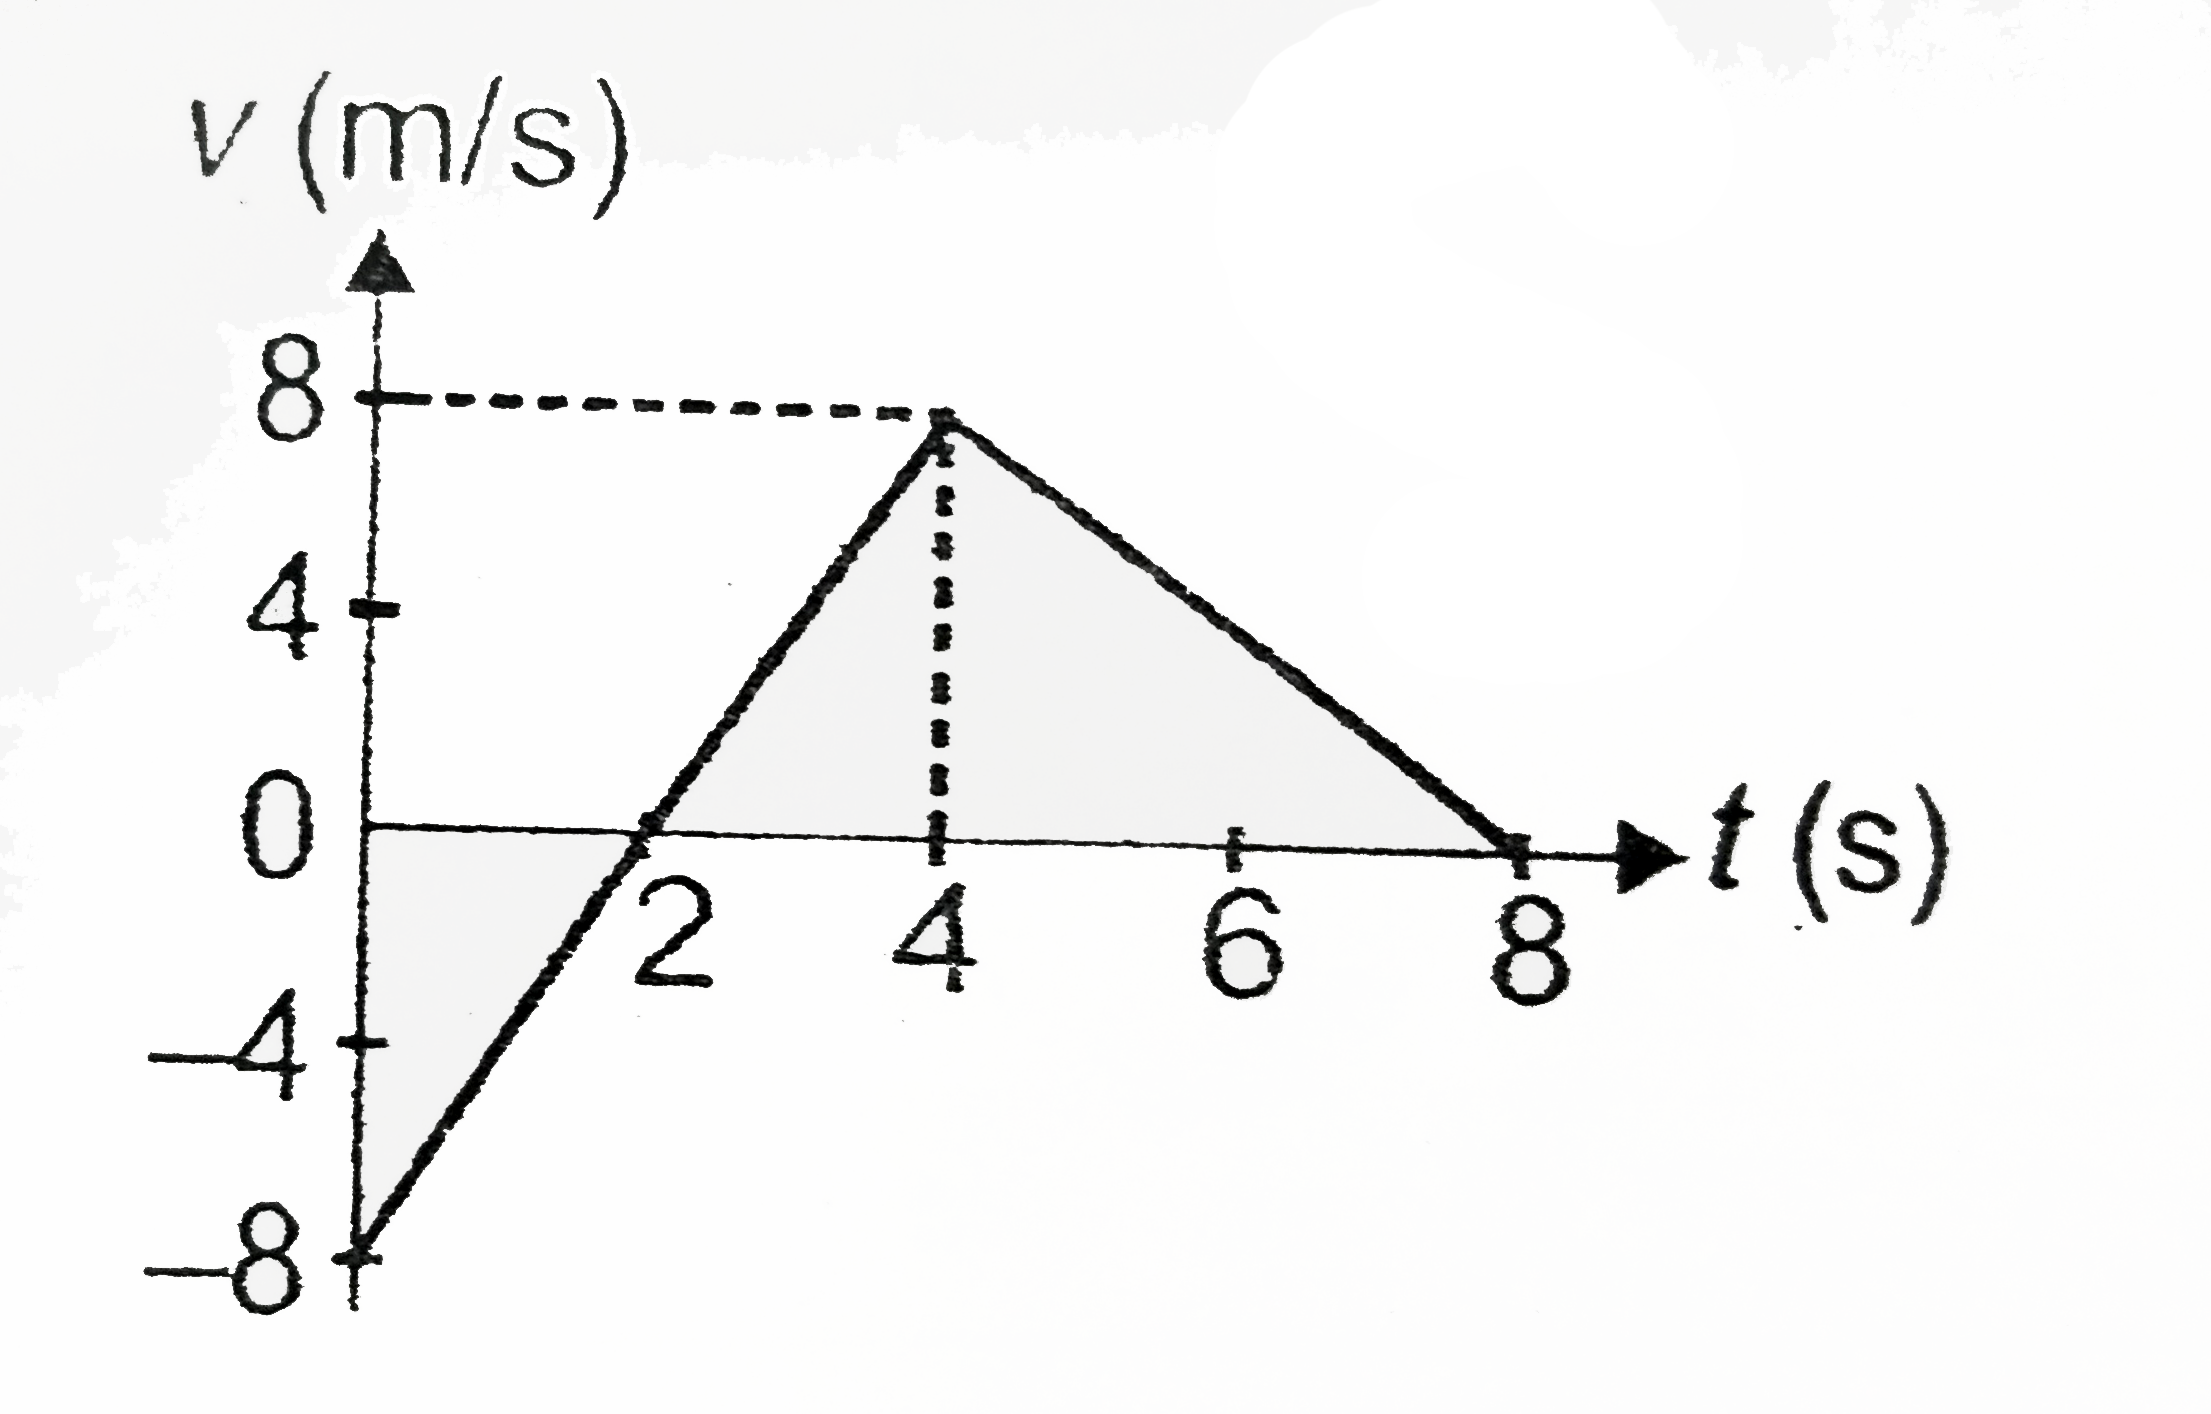
(a) Average velocity in the interval 0 to 8 s.
(b) Average speed in the interval 0 to 8 s.
(c) Average acceleration in the interval 0 to 4 s.
(d) Instantaneous acceleration at t = 2.5 s.
View Solution
Knowledge Check
The position (x) - time (t) graph for a particle moving along a straight line is shown in figure. The average speed of particle in time interval t = 0 to t = 8 s is
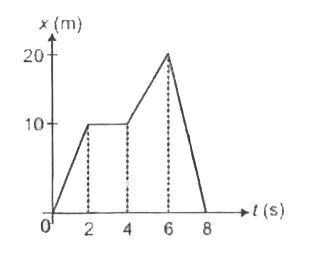 AZeroB5 m/sC7.5 m/sD9.7 m/s
The diagram shows the displacement-time graph for a particle moving in a straight line. Find the average velocity for the interval from t=0 to t=5s.
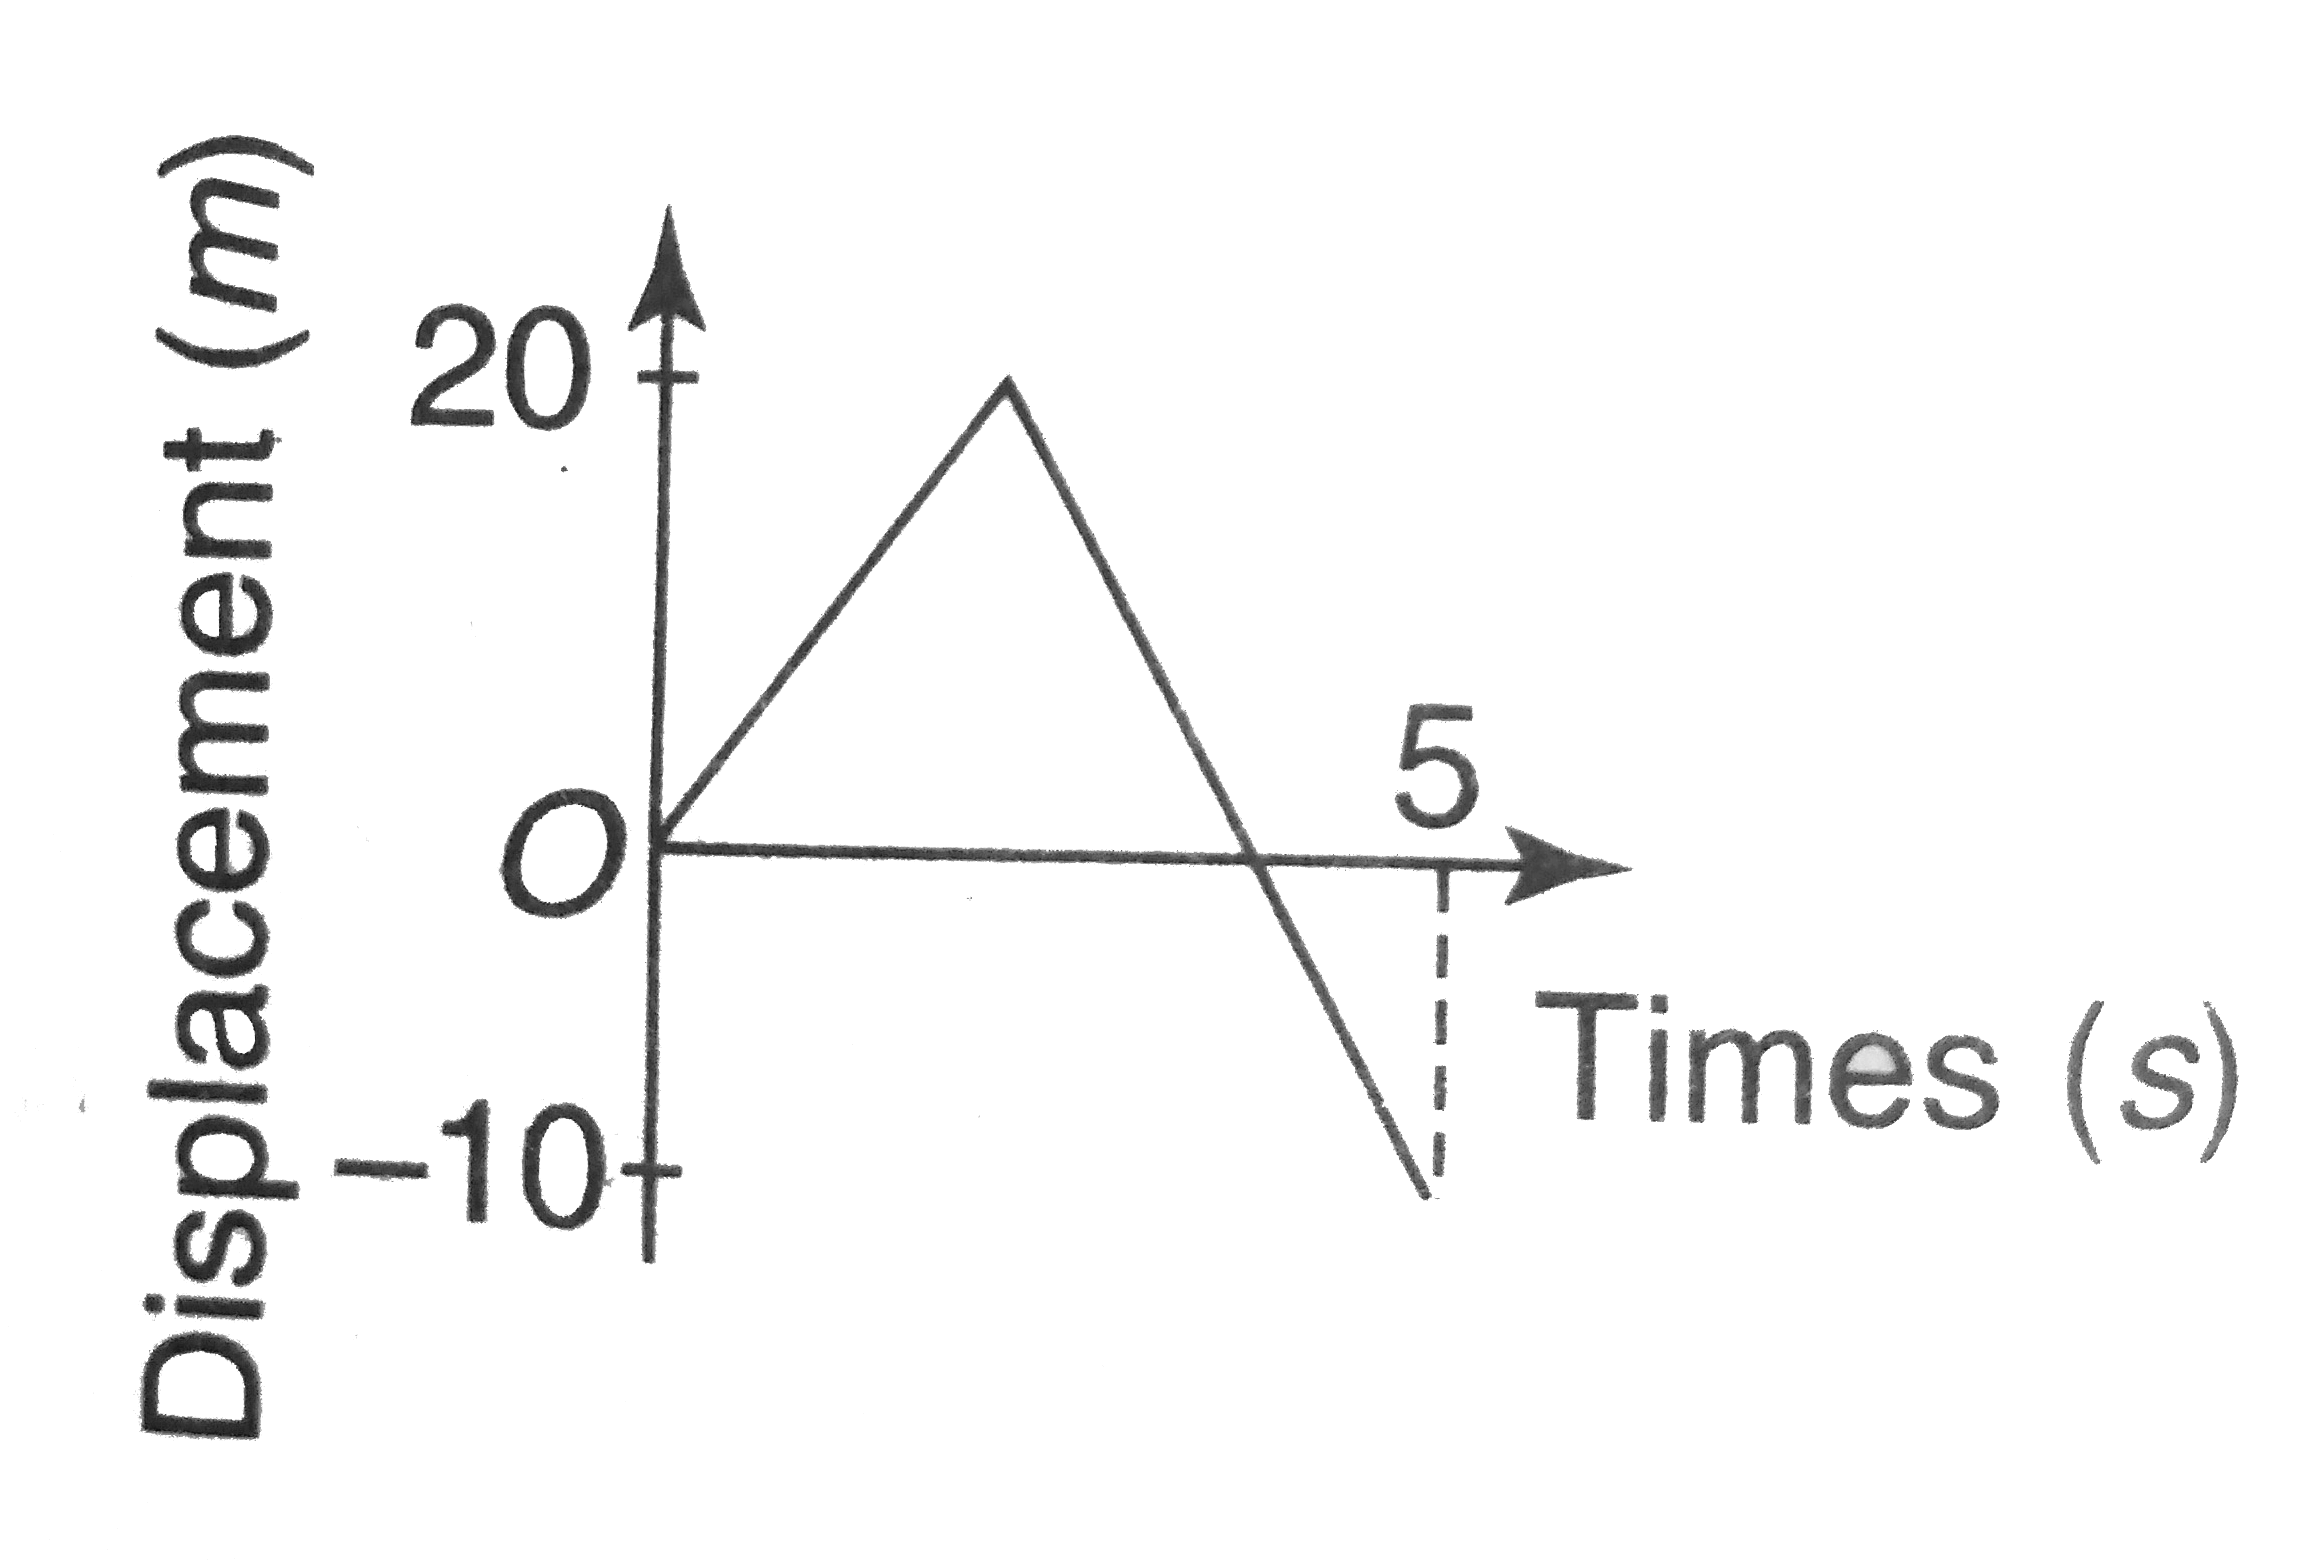 A−2ms−1B2ms−1C−4ms−1D4ms−1
The diagram shows the displacement-time graph for a particle moving in a straight line. Find the average velocity for the interval from t=0 to t=5s.
 A−2ms−1B2ms−1C−4ms−1D4ms−1
The acceleration - time graph for a particle moving along x - axis is shown in figure, If the initial velocity of particle is −5m/s, the velocity at t = 8 s is
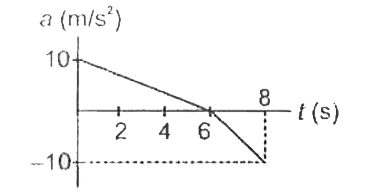
View SolutionThe position - time graph for a particle moving along a straight line is shown in figure. The total distance travelled by it in time t = 0 to t = 10 s is
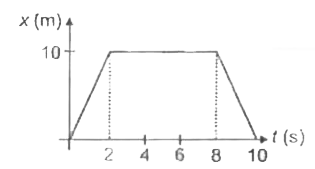
View Solution
The position versus time graph of a particle moving along a straight line is shown. What is the total distance travelled by the particle from t=0s to t=10s?
View SolutionThe position (x) of a particle moving along x - axis veries with time (t) as shown in figure. The average acceleration of particle in time interval t = 0 to t = 8 s is
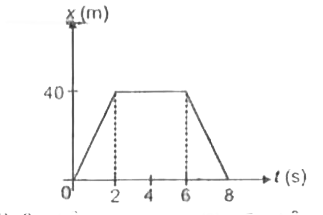
View SolutionThe velocity time graph for a particle moving along x-axis is shown in the figure. The corresponding displacement time graph is correctly shown by
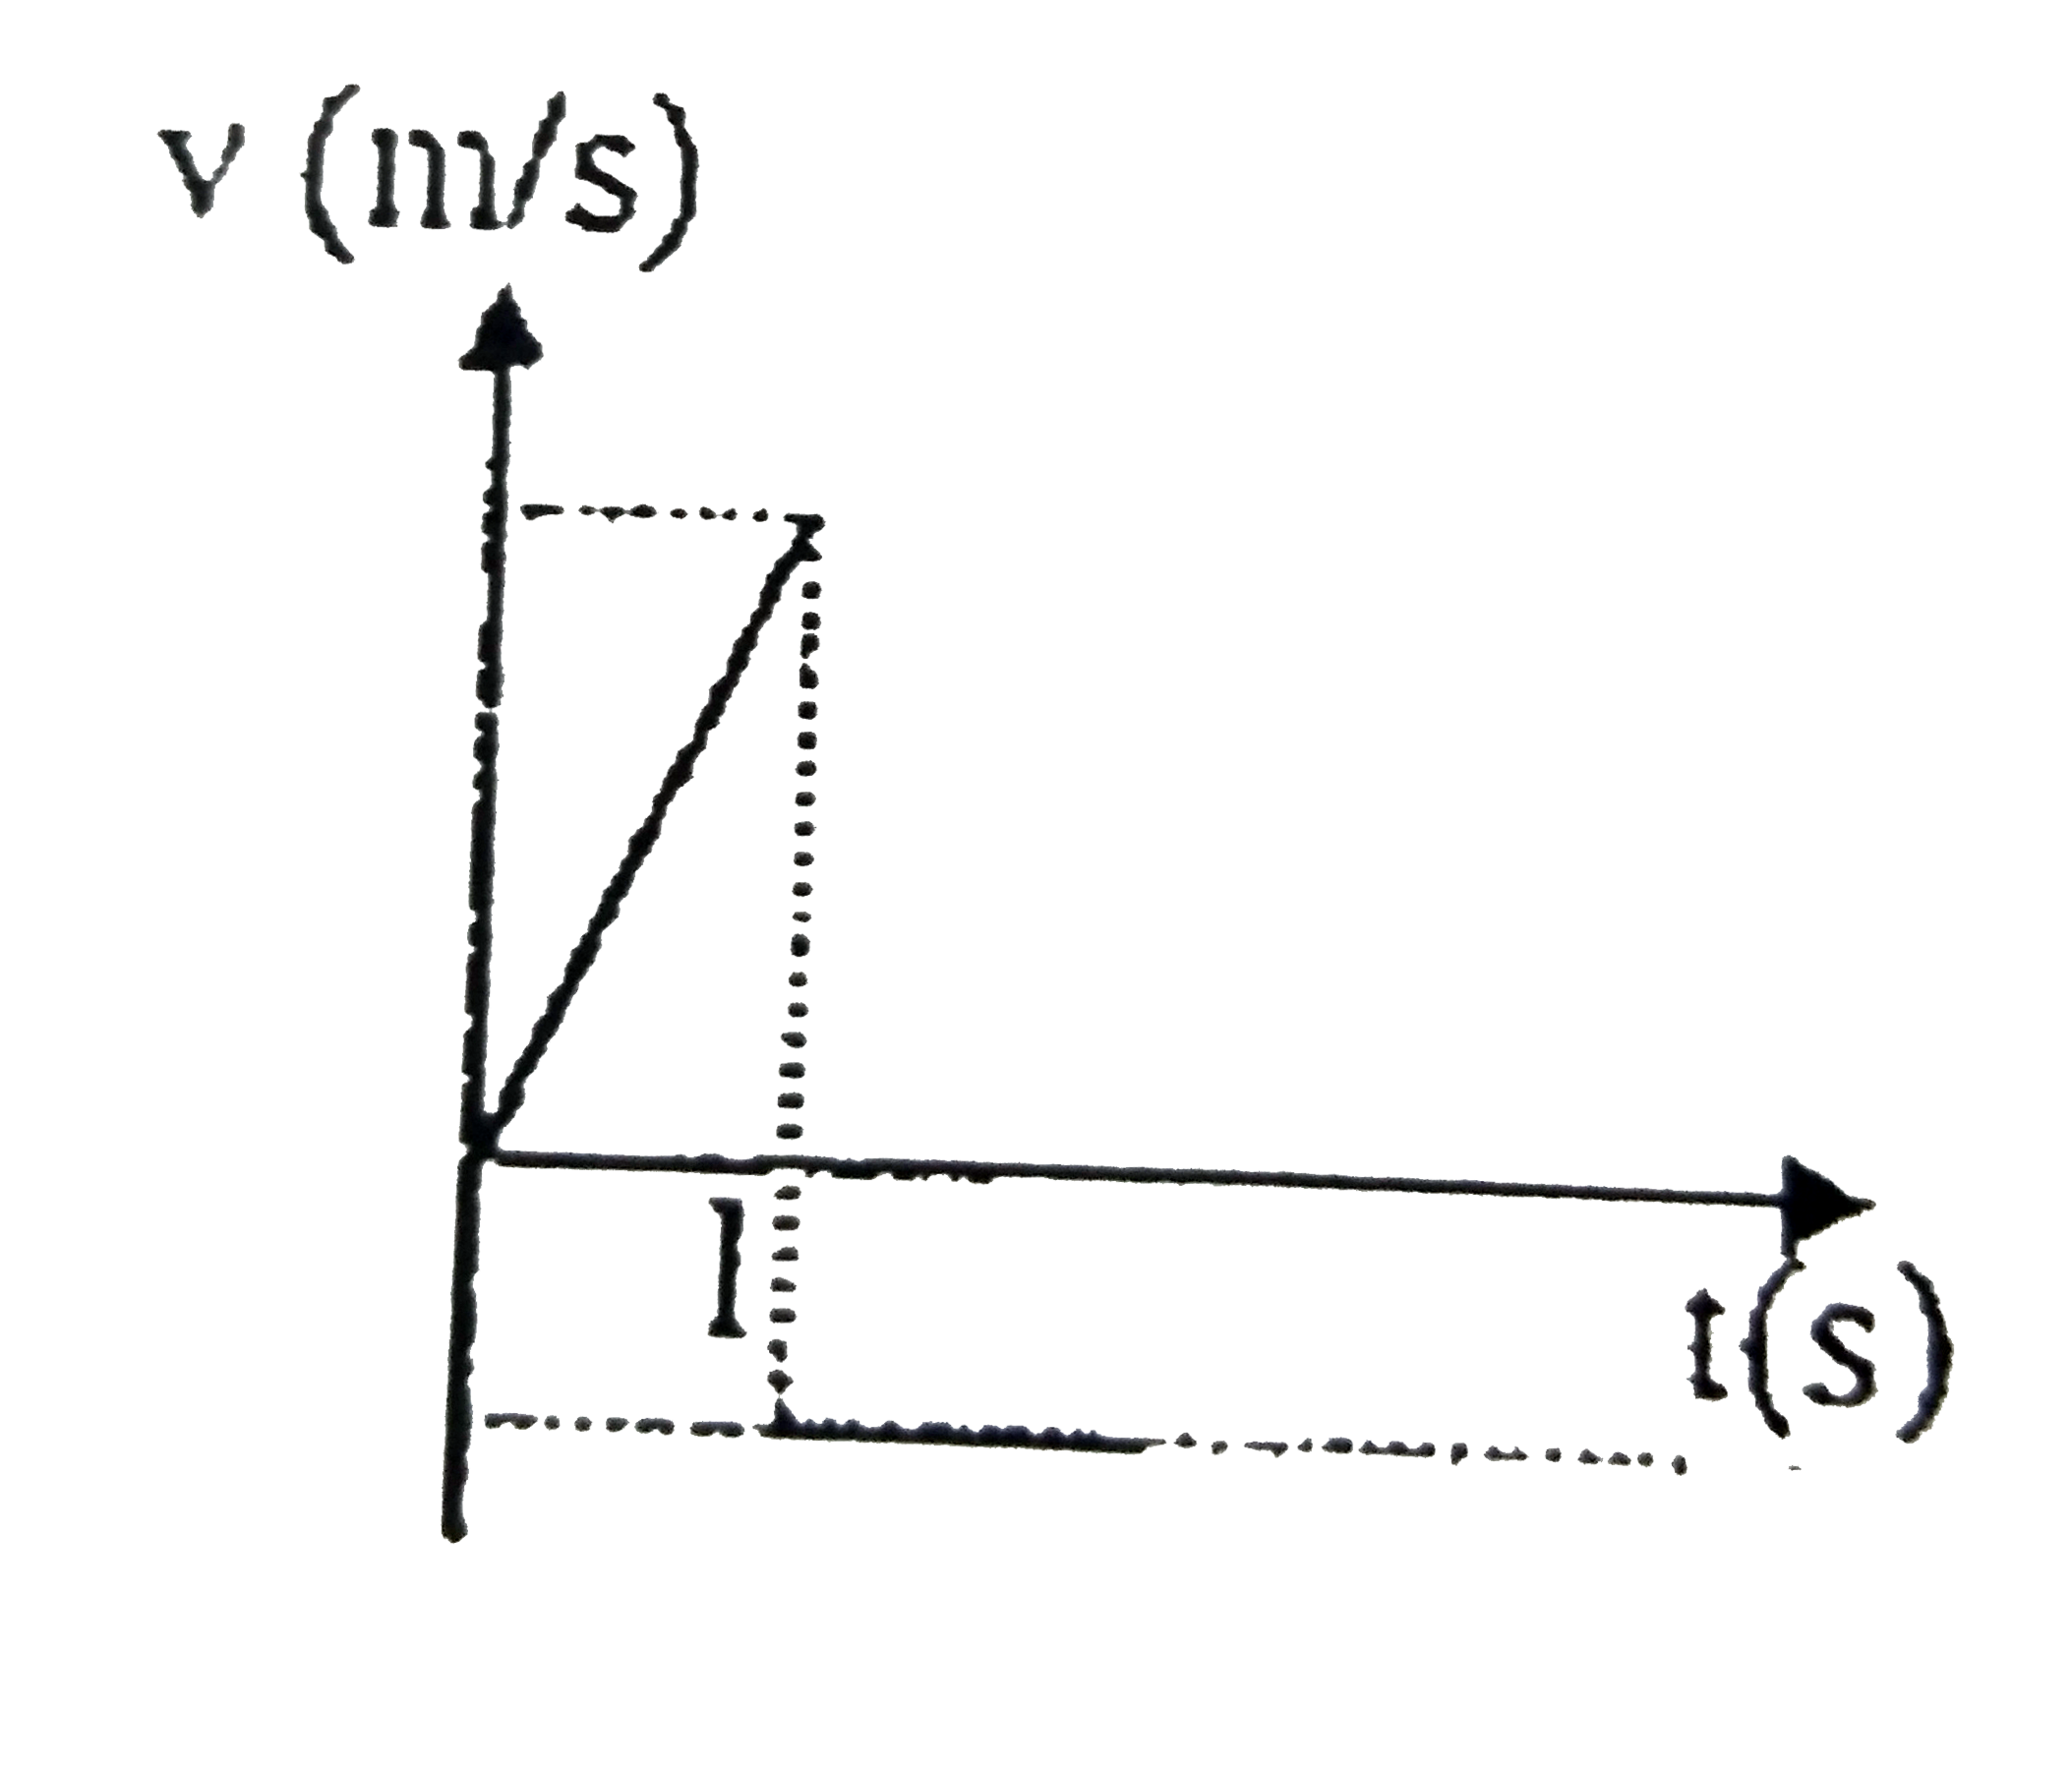
View Solution
