The v-s graph for an airplane travelling on a straight runway is shown. Determine the acceleration of the plane at s=50m and s=150m. Draw the a-s graph. 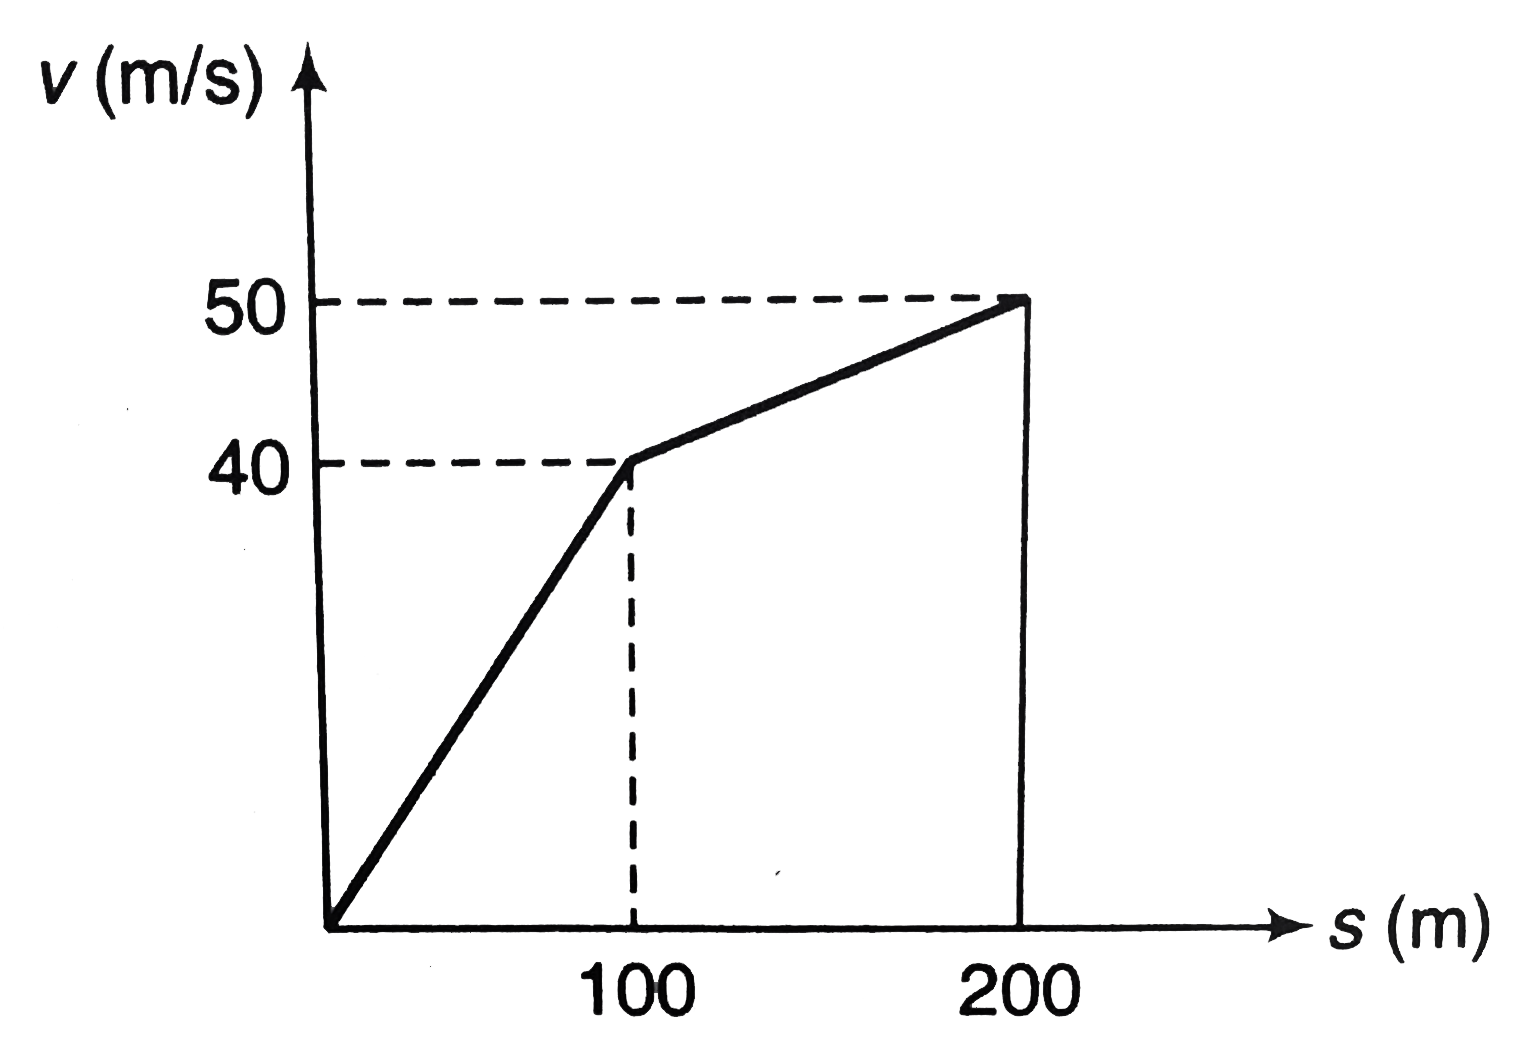
The correct Answer is:A
a=vdvdx=v (slope of v-s graph)
At s=50m
v=20m/s and dvds=40100=0.4 per sec
∴a=20×0.4=8m/s2
At s=150m
v=(40+50)=45m/s
and dvds=10100=0.1 per sec
∴a=45×0.1=4.5m/s2
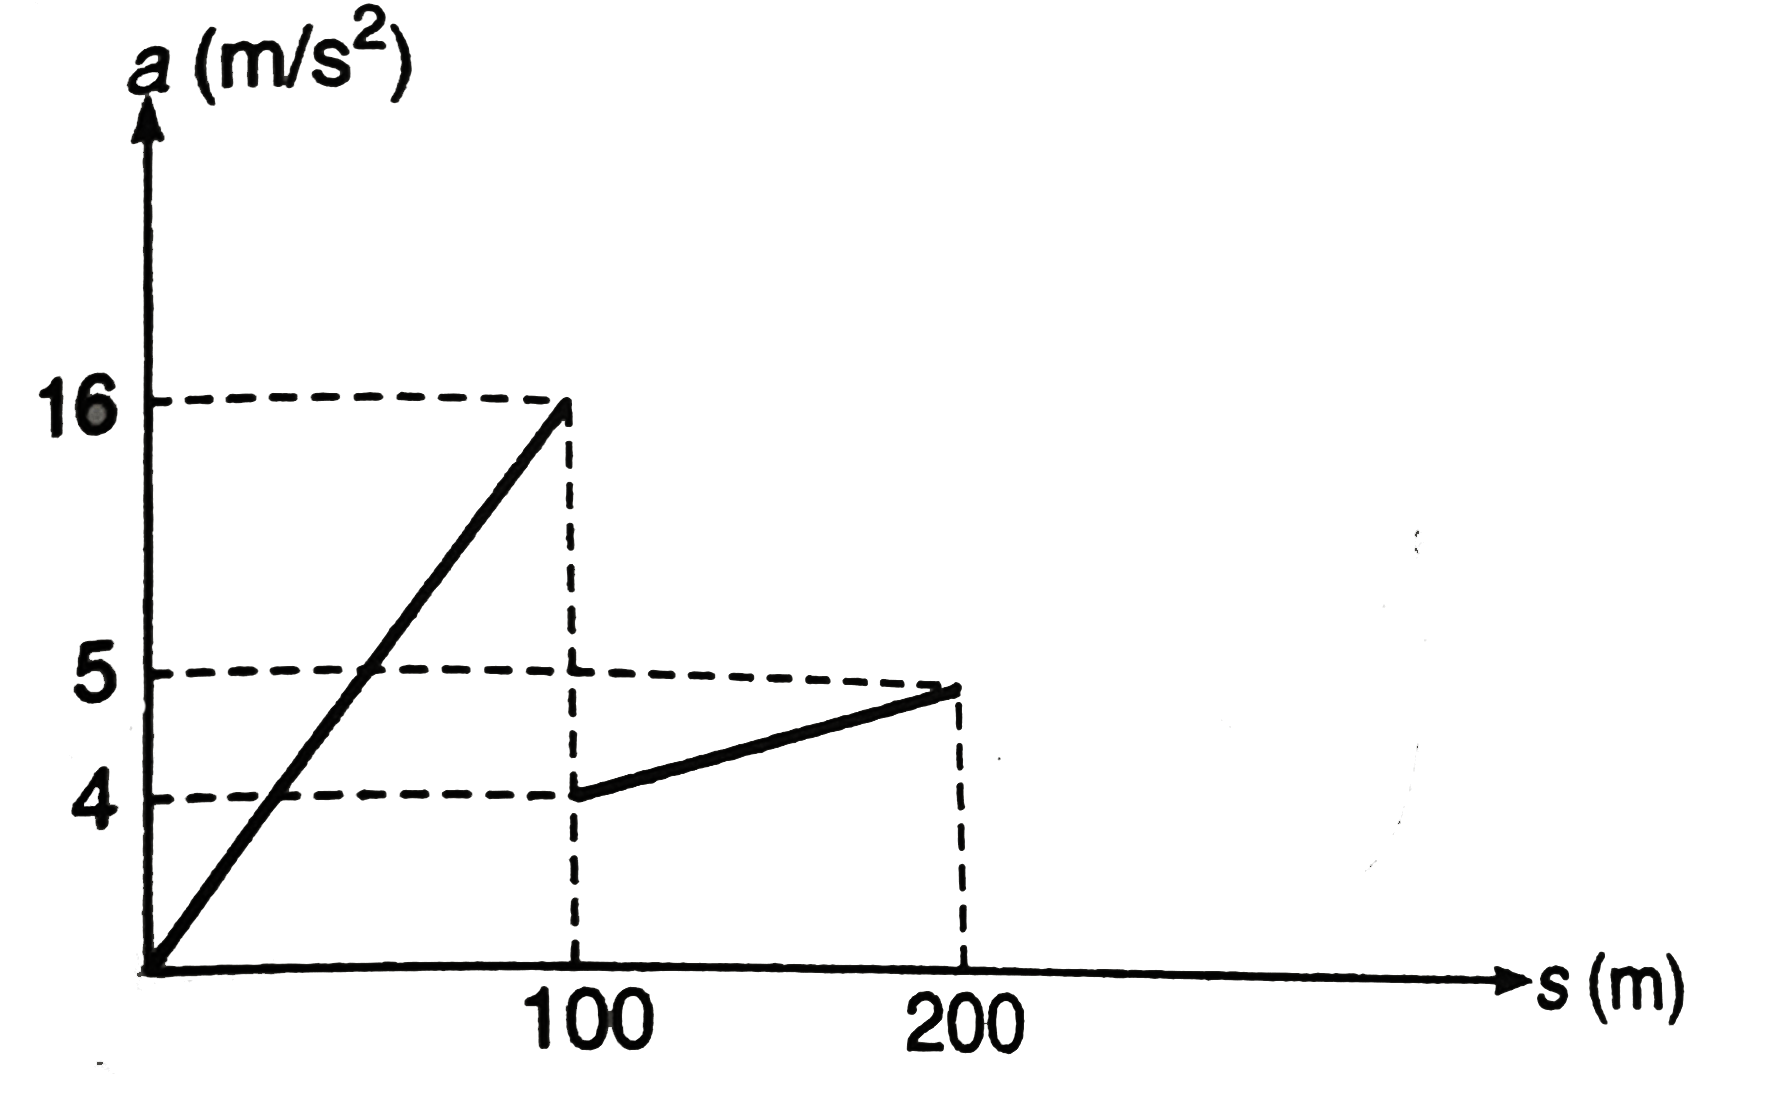
a-s graph
From s=0 to s=100mv=0.4s
and dvds=0.4
∴a=v.dvds=0.16s
i.e a-s graph is a straight line passing through origin
of slope 0.16 per (sec)2.
At s=100m,=0.16XX100=16m/s2
From s=100m to s=200m
v=0.1s+30
dvds=0.1
∴a=vdvds=(0.1s+30)(0.1)=(0.01s+3)
i.e. a-s graph is straight line of slope 0.01(sec)−2 and
intercept 3m/s2.
At s=100m,a=4m/s2
and at s=200m,a=5m/s2
Corresponding a-s graph is as shown in figure.
Topper's Solved these Questions
- KINEMATICSBook:DC PANDEYChapter:KINEMATICSExercise:SCQ_TYPE
Explore 41 Videos
- KINEMATICSBook:DC PANDEYChapter:KINEMATICSExercise:MCQ_TYPE
Explore 23 Videos
- KINEMATICSBook:DC PANDEYChapter:KINEMATICSExercise:Comprehension
Explore 7 Videos
- GRAVITATIONBook:DC PANDEYChapter:GRAVITATIONExercise:(C) Chapter Exercises
Explore 45 Videos
- KINEMATICS 1Book:DC PANDEYChapter:KINEMATICS 1Exercise:INTEGER_TYPE
Explore 15 Videos
Similar Questions
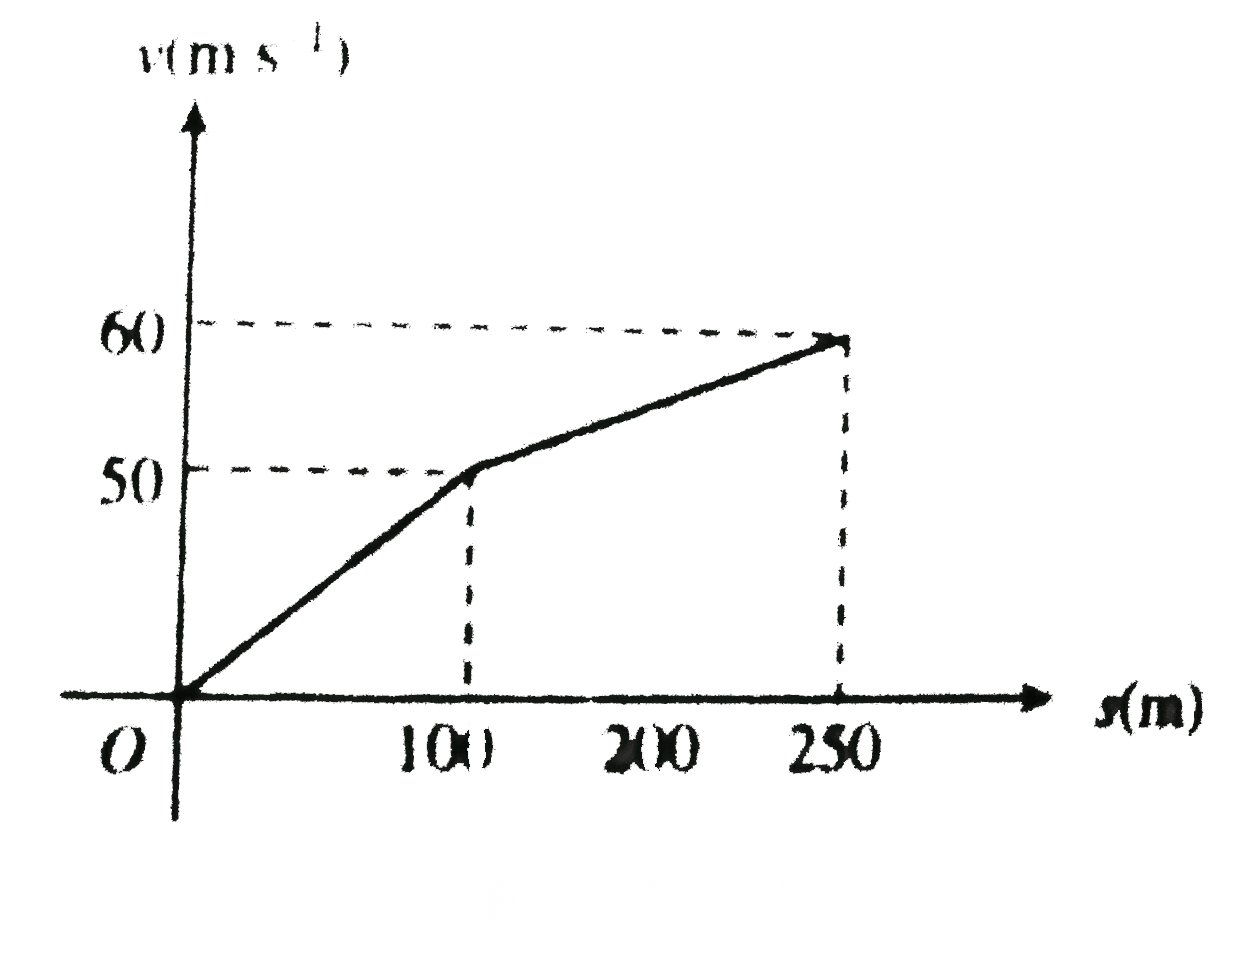
The velocity-displacement for a fer plane on a straight runway is shown in . Determine the speed and acceleration of the jet plane at s=150m.
 .
.
View SolutionThe displacement-time graph for a particle moving in a straight line is as shown in the figure. Determine the velocity of the particle at t=1s,3s and 6s. Sketch the velocity-time graph.
View Solution
Knowledge Check
The velocity –position graph of a particle moving along a straight line is shown. Then acceleration of the particle at s = 15 m is :
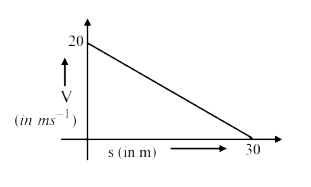 A23ms−2B−23ms−2C203ms−2D−203ms−2
The velocity-time graph of a particle moving along a straight line is shown is . The rate of acceleration and deceleration is constant and it is equal to 5ms−2. If the a average velocity during the motion is 20ms−1, Then
 .
.
The value of t is.A5sB10sC20sD5√2sThe velocity-time graph of a particle moving along a straight line is shown is Fing. The rate of acceleration and deceleration is constant and it is equal to 5ms−2. If the a average velocity during the motion is 20ms−1, Then
 .
.
The distace travelled with uniform velcoty is .A375 mB125mC300mD450m
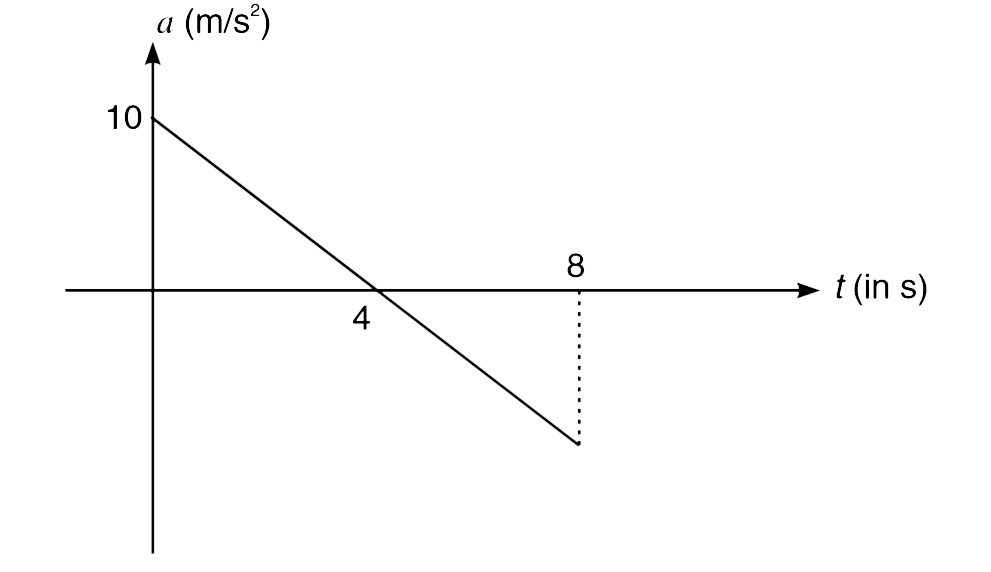
Acceleration vs time graph for a particle moving along a straight line is as shown. If the initial velocity of the particle is u=10m/s, draw a plot of its velocity vs time for 0<t<8.
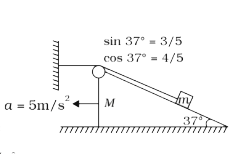
View SolutionAs shown in the figure, if acceleration of M with respect to ground is 5m/s2, then :
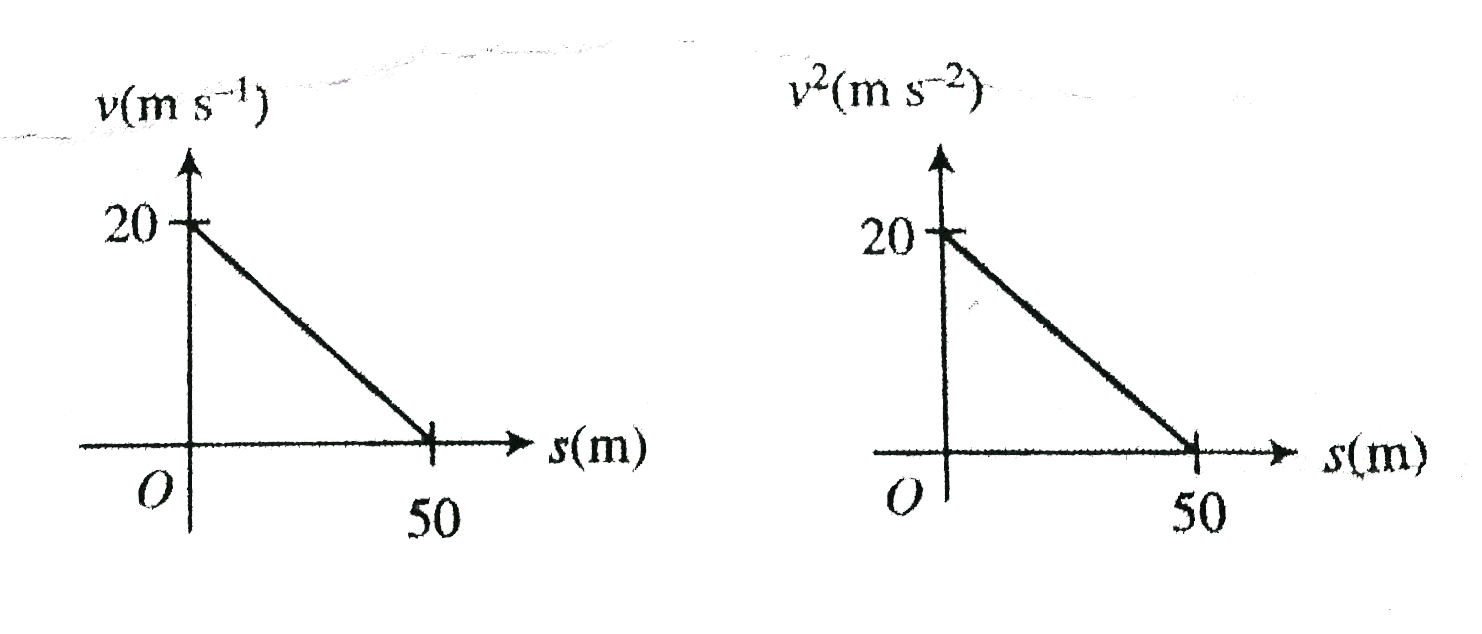
View SolutionThe v−s and v2−s graph are given for two particles. Find the accelerations of the particles at s=0.
 .
.
View SolutionThe displacement vs time graph of a particle undergoing S.H>M. Is shown below . The acceleration of the particle at t=2/3s is

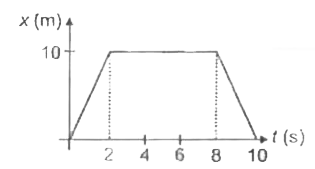
View SolutionThe position - time graph for a particle moving along a straight line is shown in figure. The total distance travelled by it in time t = 0 to t = 10 s is
View Solution

