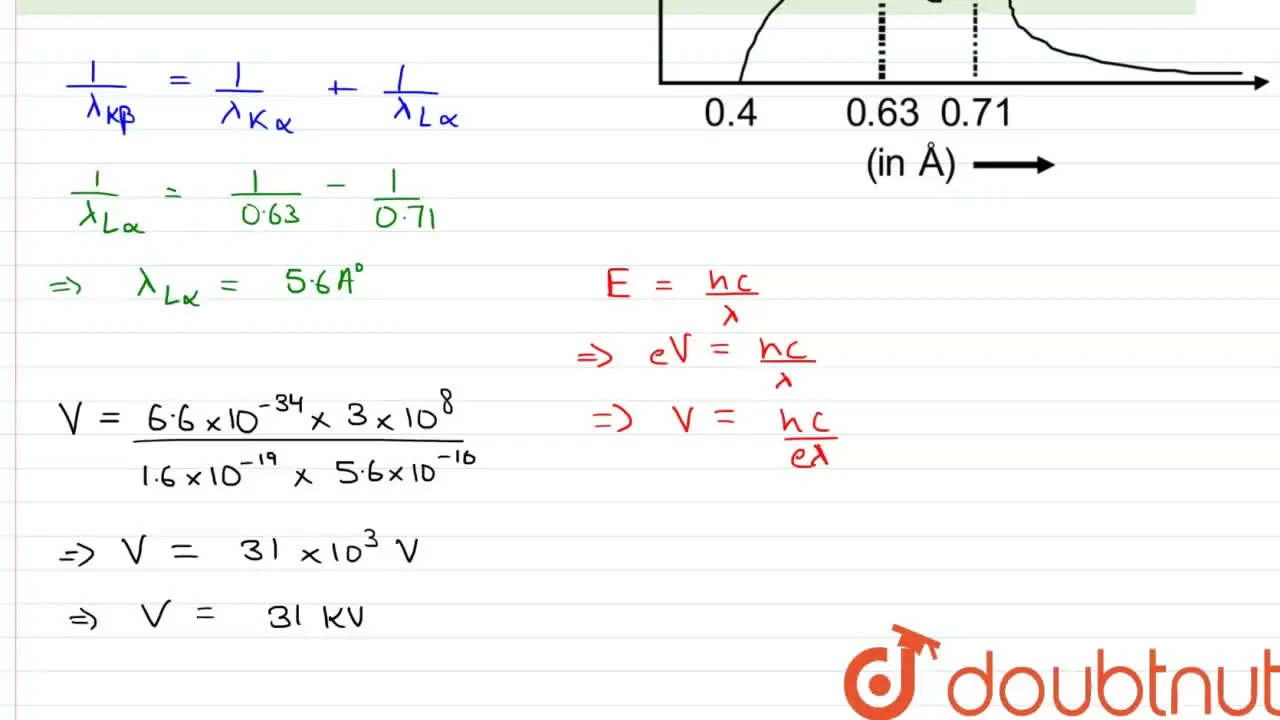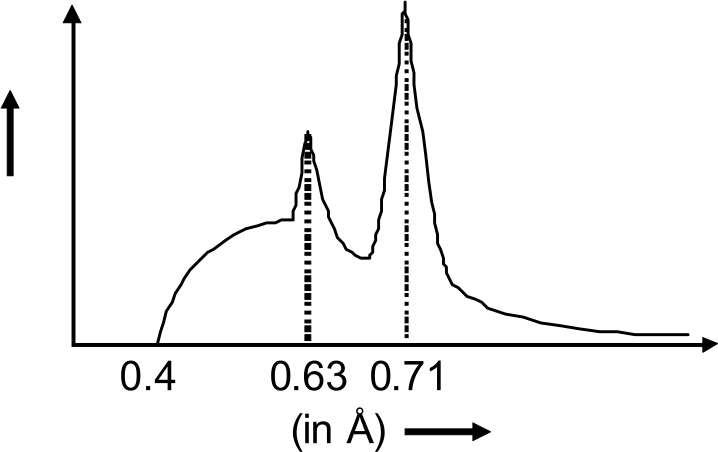
Figure shows intensity versus wavelength graph of X-rays coming from coolidge-tube with molybdenum as target element :
The two peaks shown in graph correspond to Kα and Kβ X-rays
Voltage applied across Coolidge tube is (approximately)
20 kV
16 kV
31 kV
18 kV
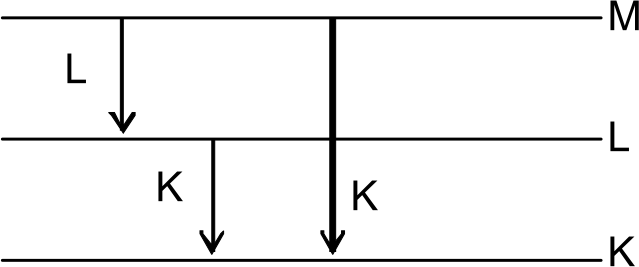
1λKb=1λKα+1λLα
1λLα=5.6Å
eV=hcλ
V=hceλ=31×103 volts
Related Playlists
Similar Questions
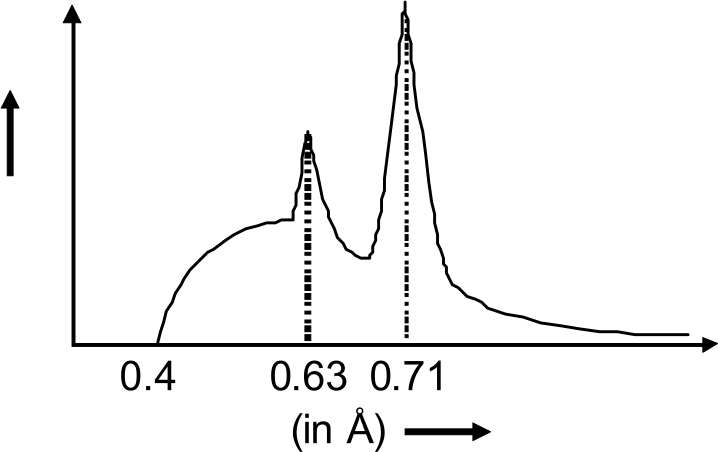
Figure shows intensity versus wavelength graph of X-rays coming from coolidge-tube with molybdenum as target element :
The two peaks shown in graph correspond to Kα and Kβ X-rays
Wavelength of Lα X-rays from Coolidge tube will be (approximately)View SolutionCutoff wavelength of X-rays coming from a Coolidge tube depends on the
View SolutionConsider a photon of continuous X-ray coming from a Coolidge tube. Its energy comes from
View SolutionFind the cut off wavelength for the continuous X - rays coming from an X-ray tube operating at 40 kV.
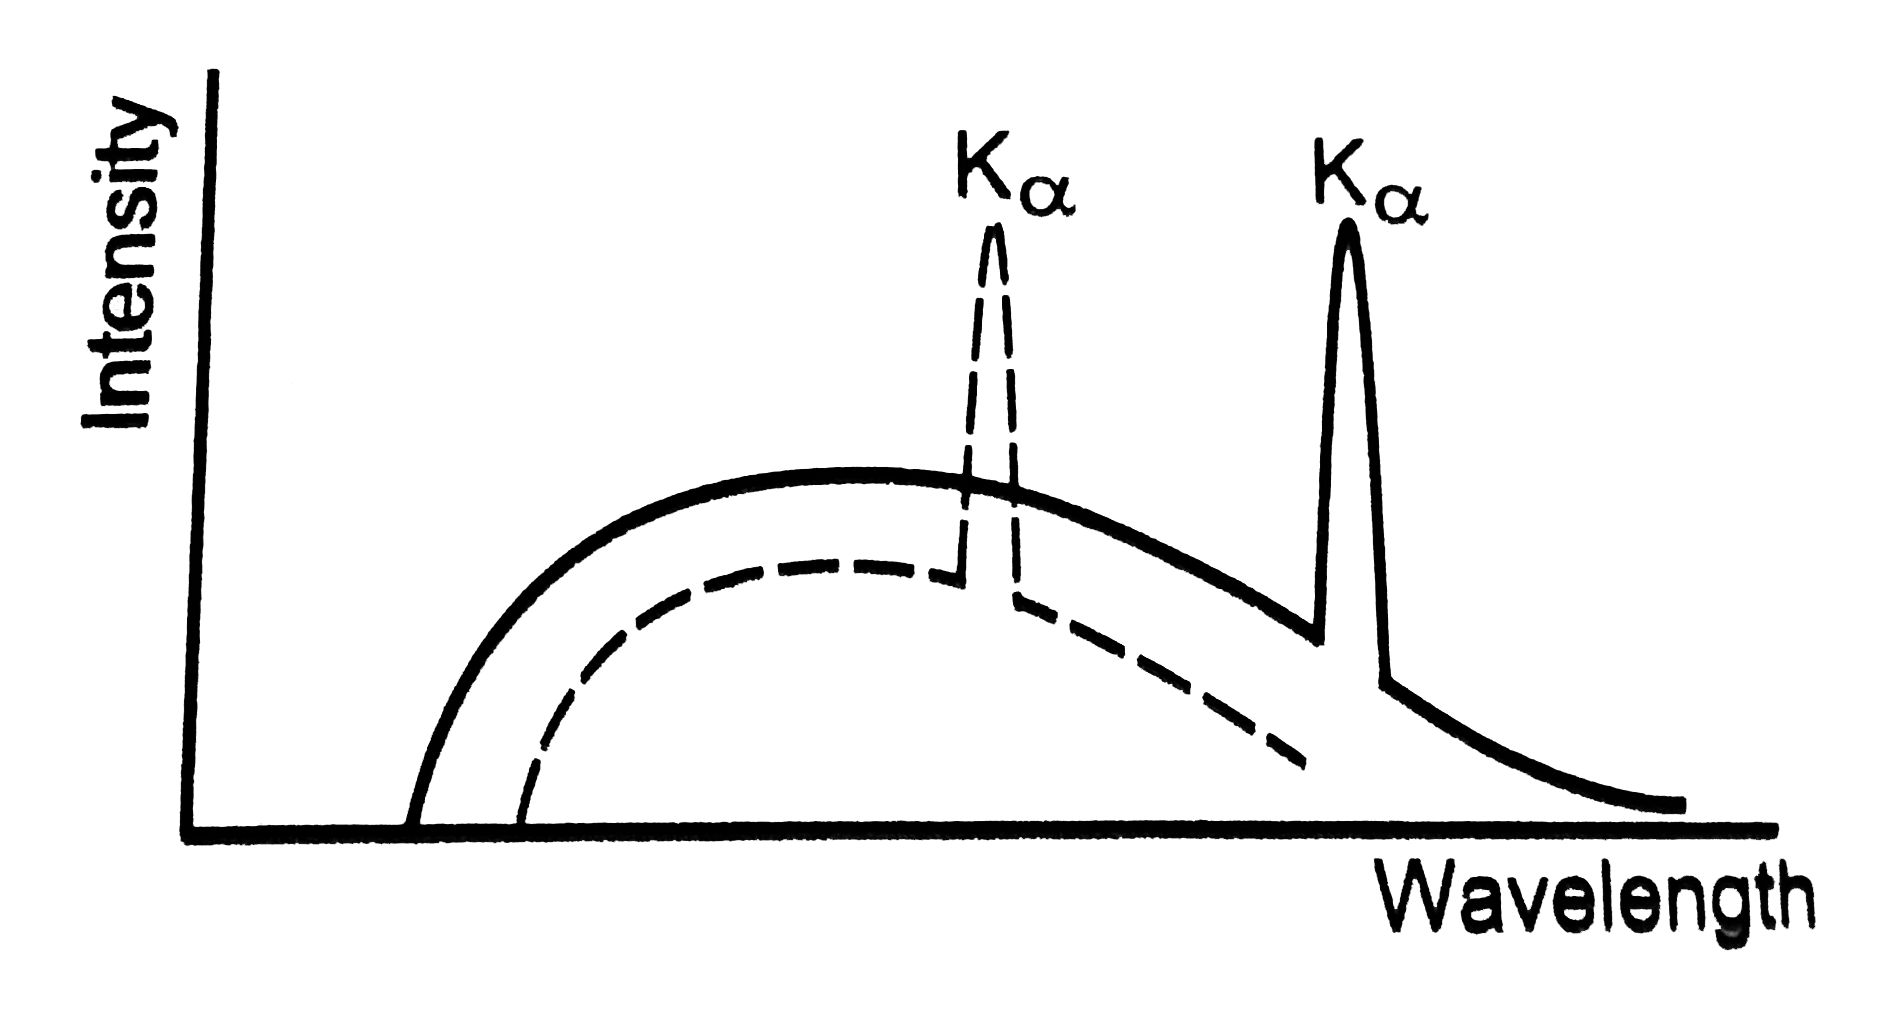
View SolutionFigure shows the intensity-wavelength relations of X-rays coming from two different Coolidge tube. The solid curve represents the relation for the tube A in which the potential difference between the target and the filament is Va and the atomic number of the target material is ZA. These quantities are Vβ and Zβ for the other tube. Then,
 View Solution
Explain how the intensity and penetrating power of X-ray are controlled in a Coolidge X-ray tube.
View SolutionThe continuous x - ray spectrum obtained from a Coolidge tube is of the form
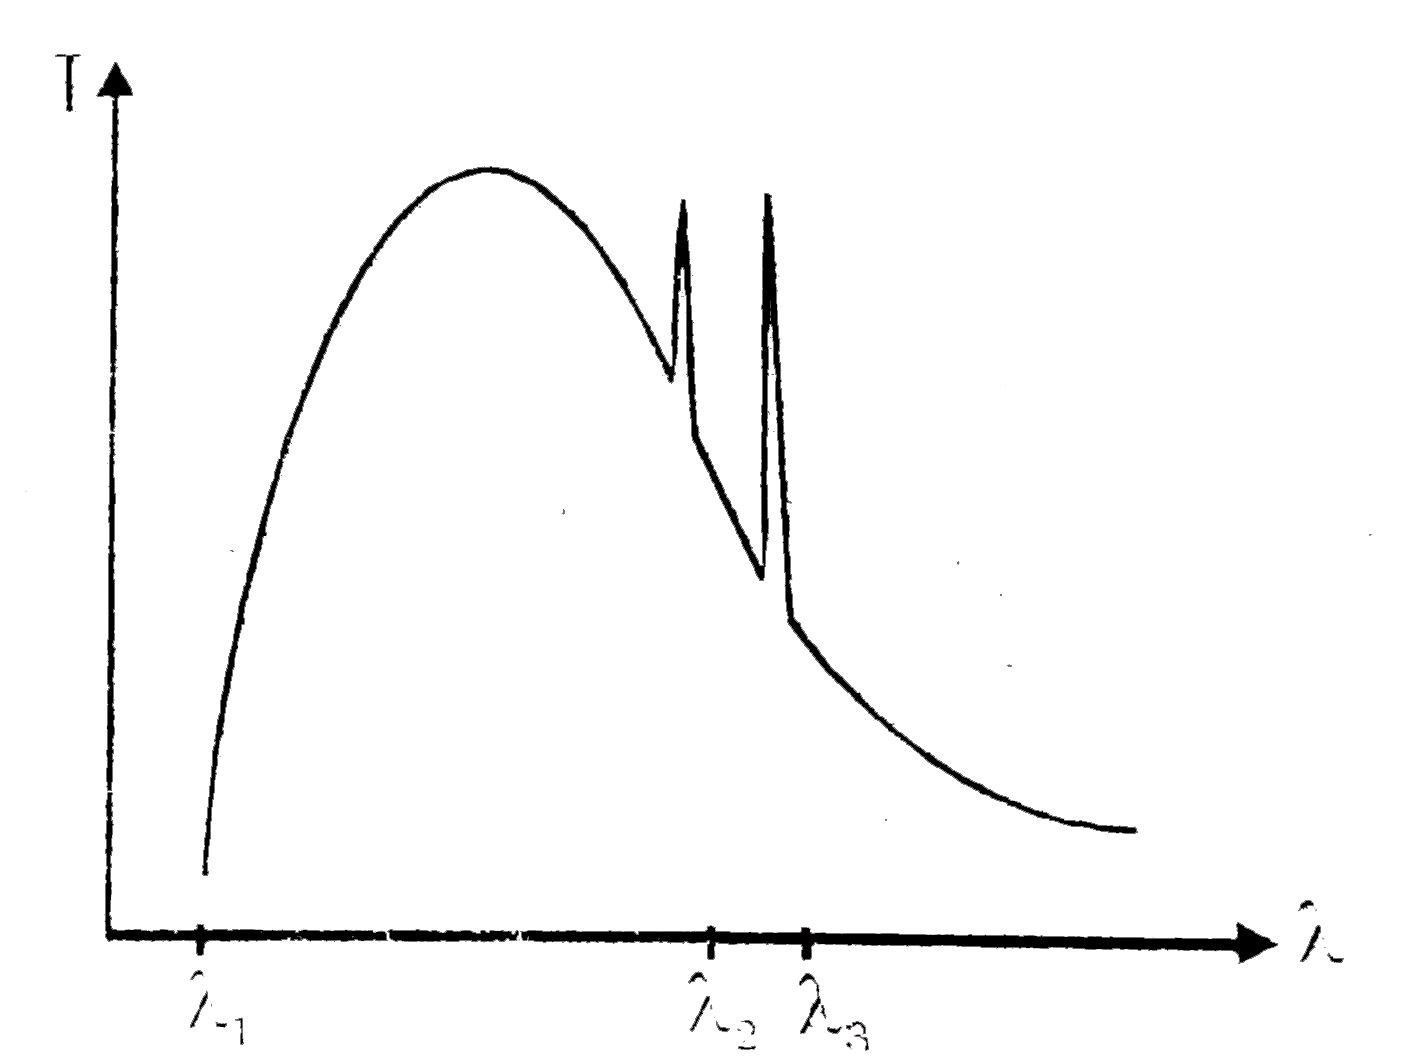
View SolutionIntensity of x-rays coming from an x-ray tube is plotted against wavelength as shown:-
 View Solution
One of the following wavelength is absent and the rest are present in the X-rays coming from a Coolidge tube. Which one is the absent wavelength?
View SolutionThe X-ray coming from a Coolidge tube has a cutoff wavelength of 80 pm. Find the kinetic energy of the electrons hitting the target.
View Solution

