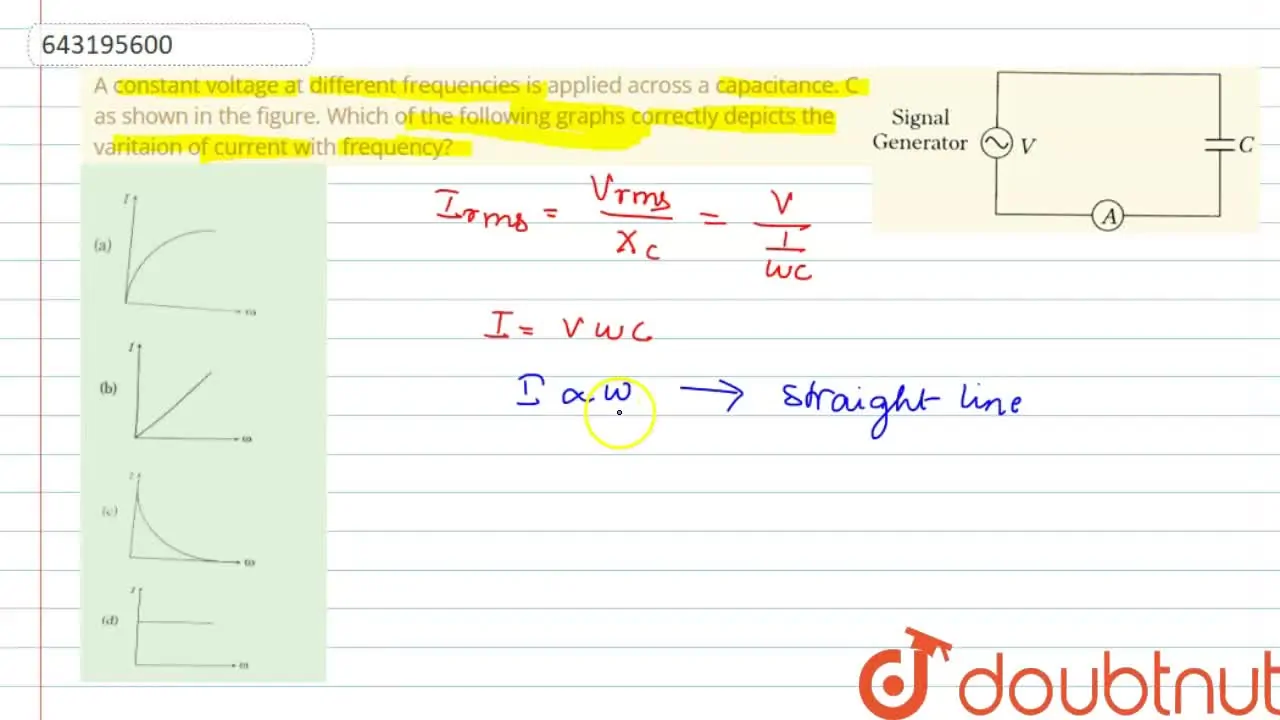
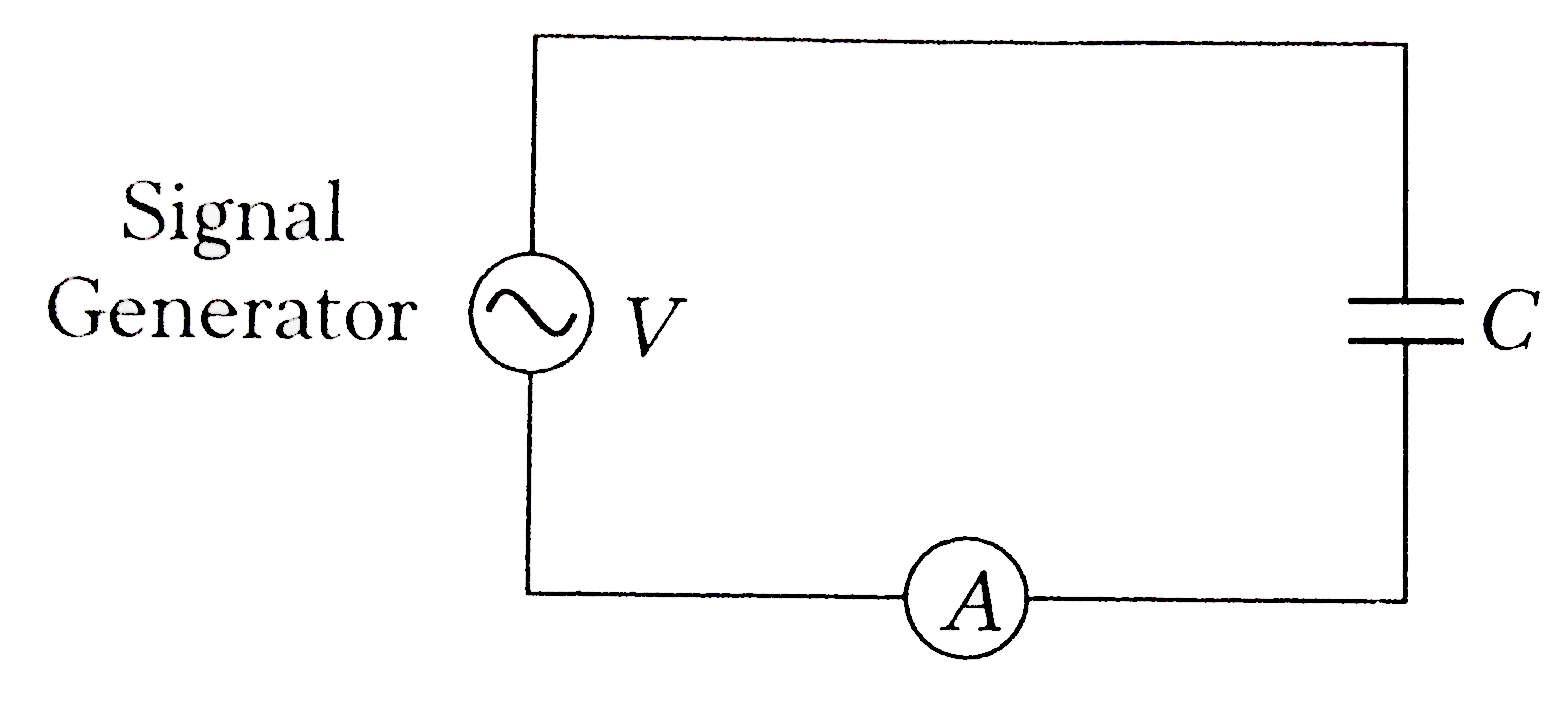
A constant voltage at different frequencies is applied across a capacitance. C as shown in the figure. Which of the following graphs correctly depicts the varitaion of current with frequency?
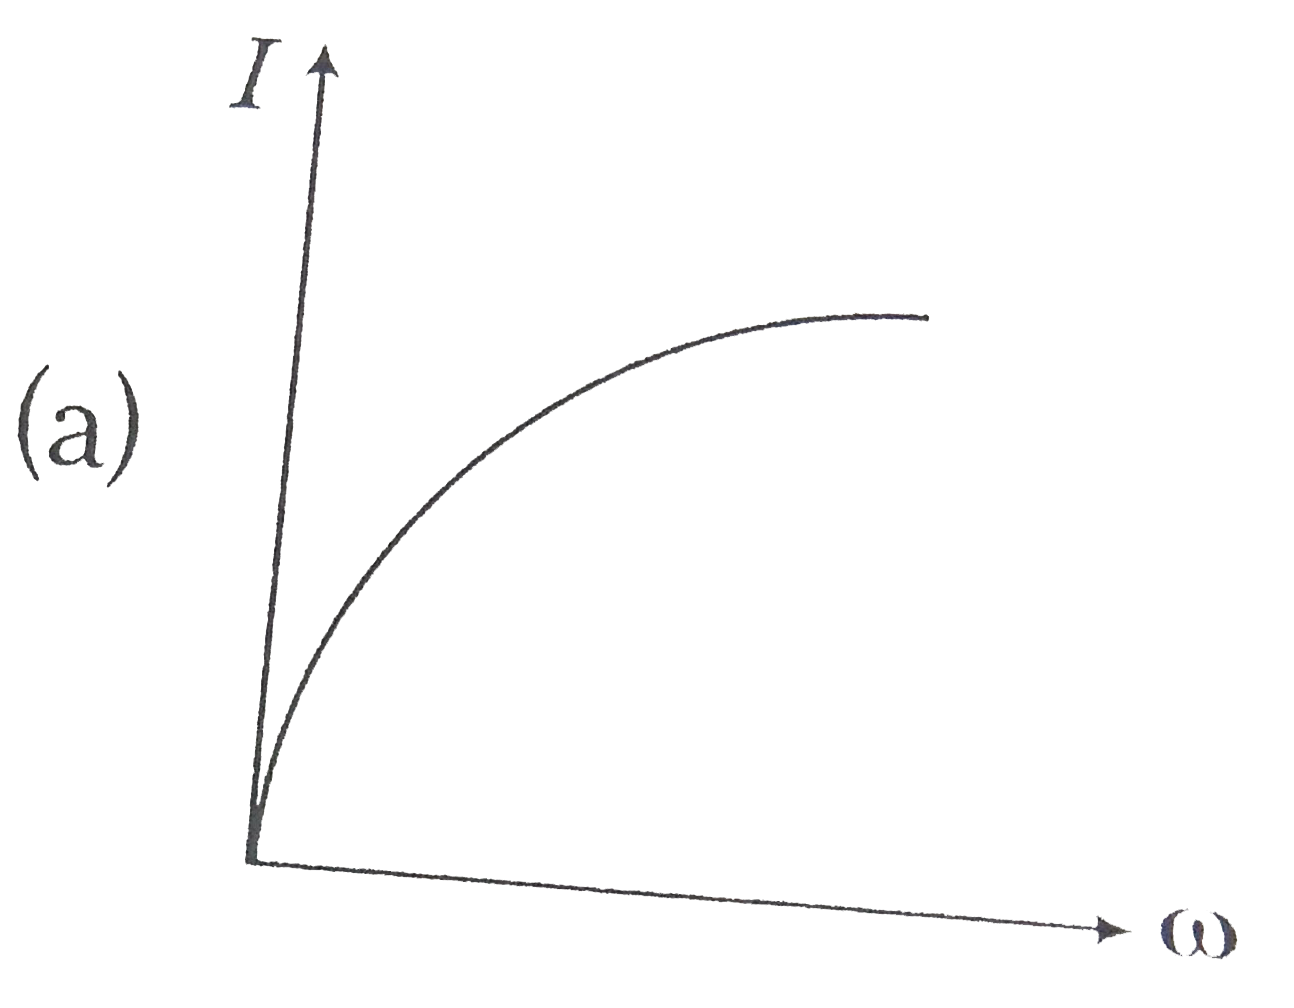
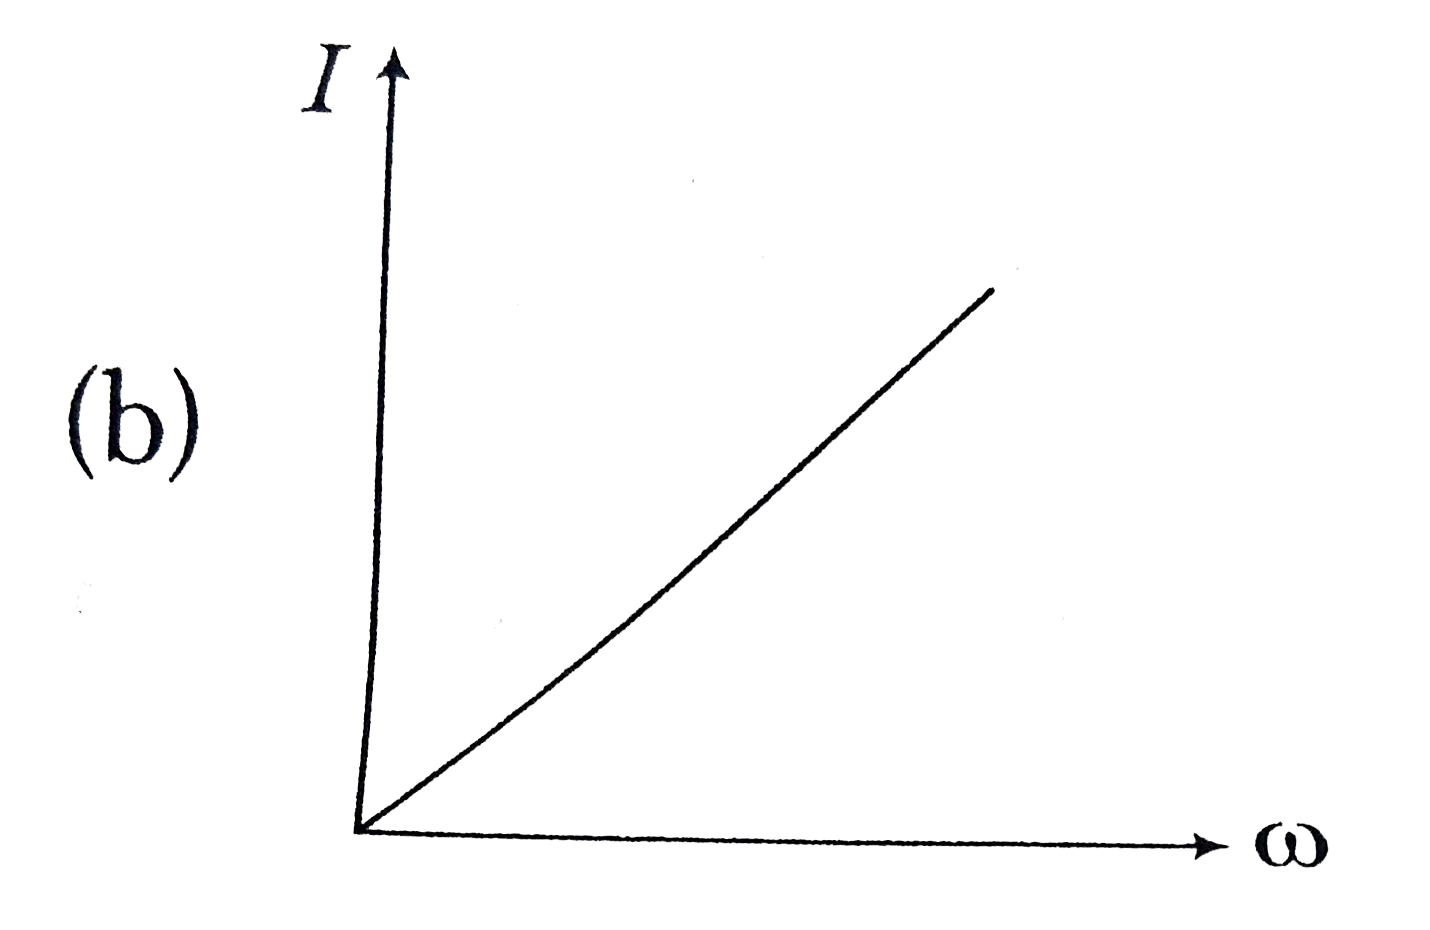
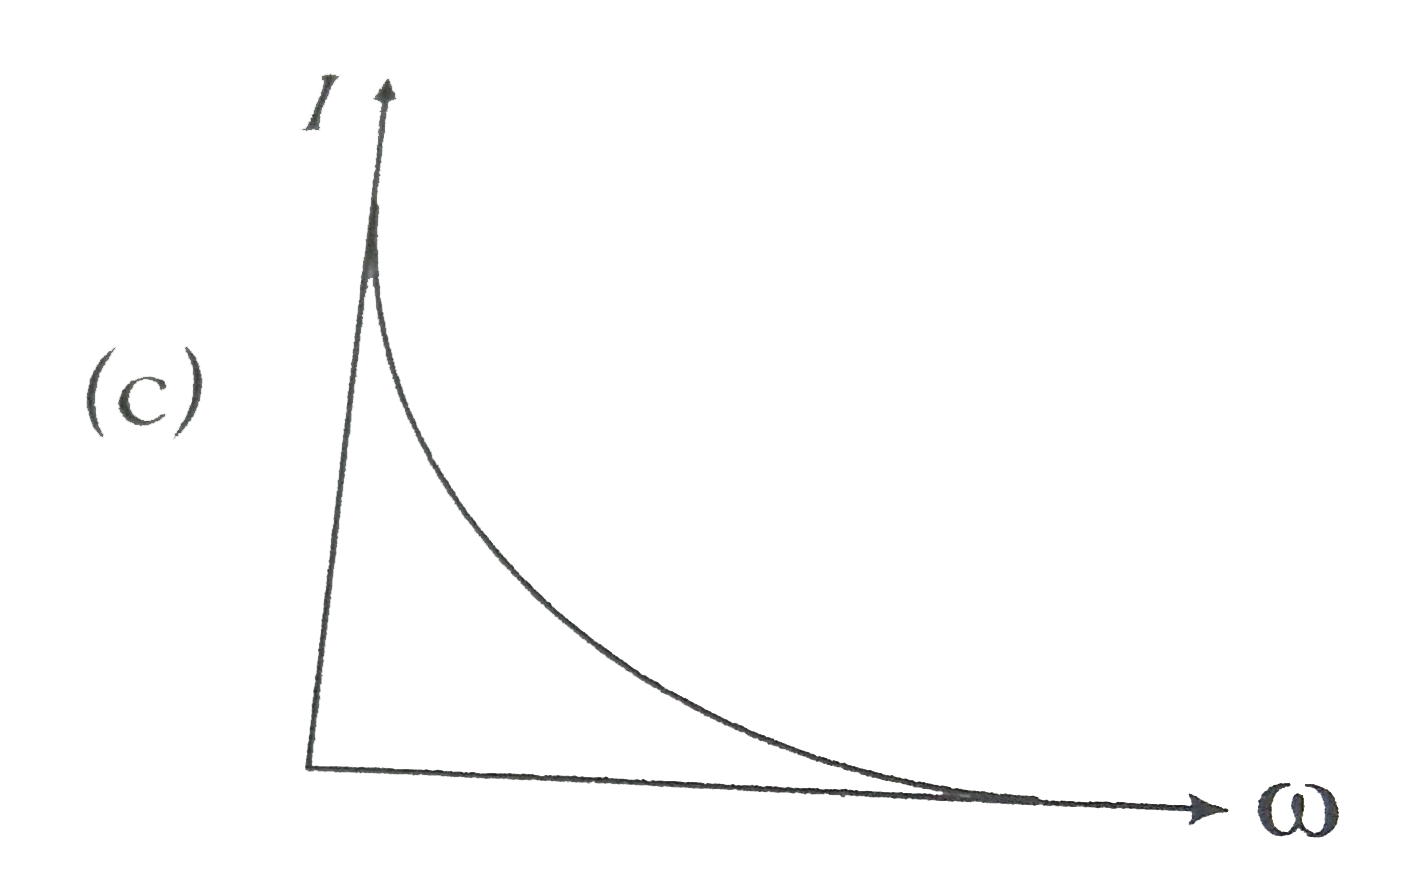
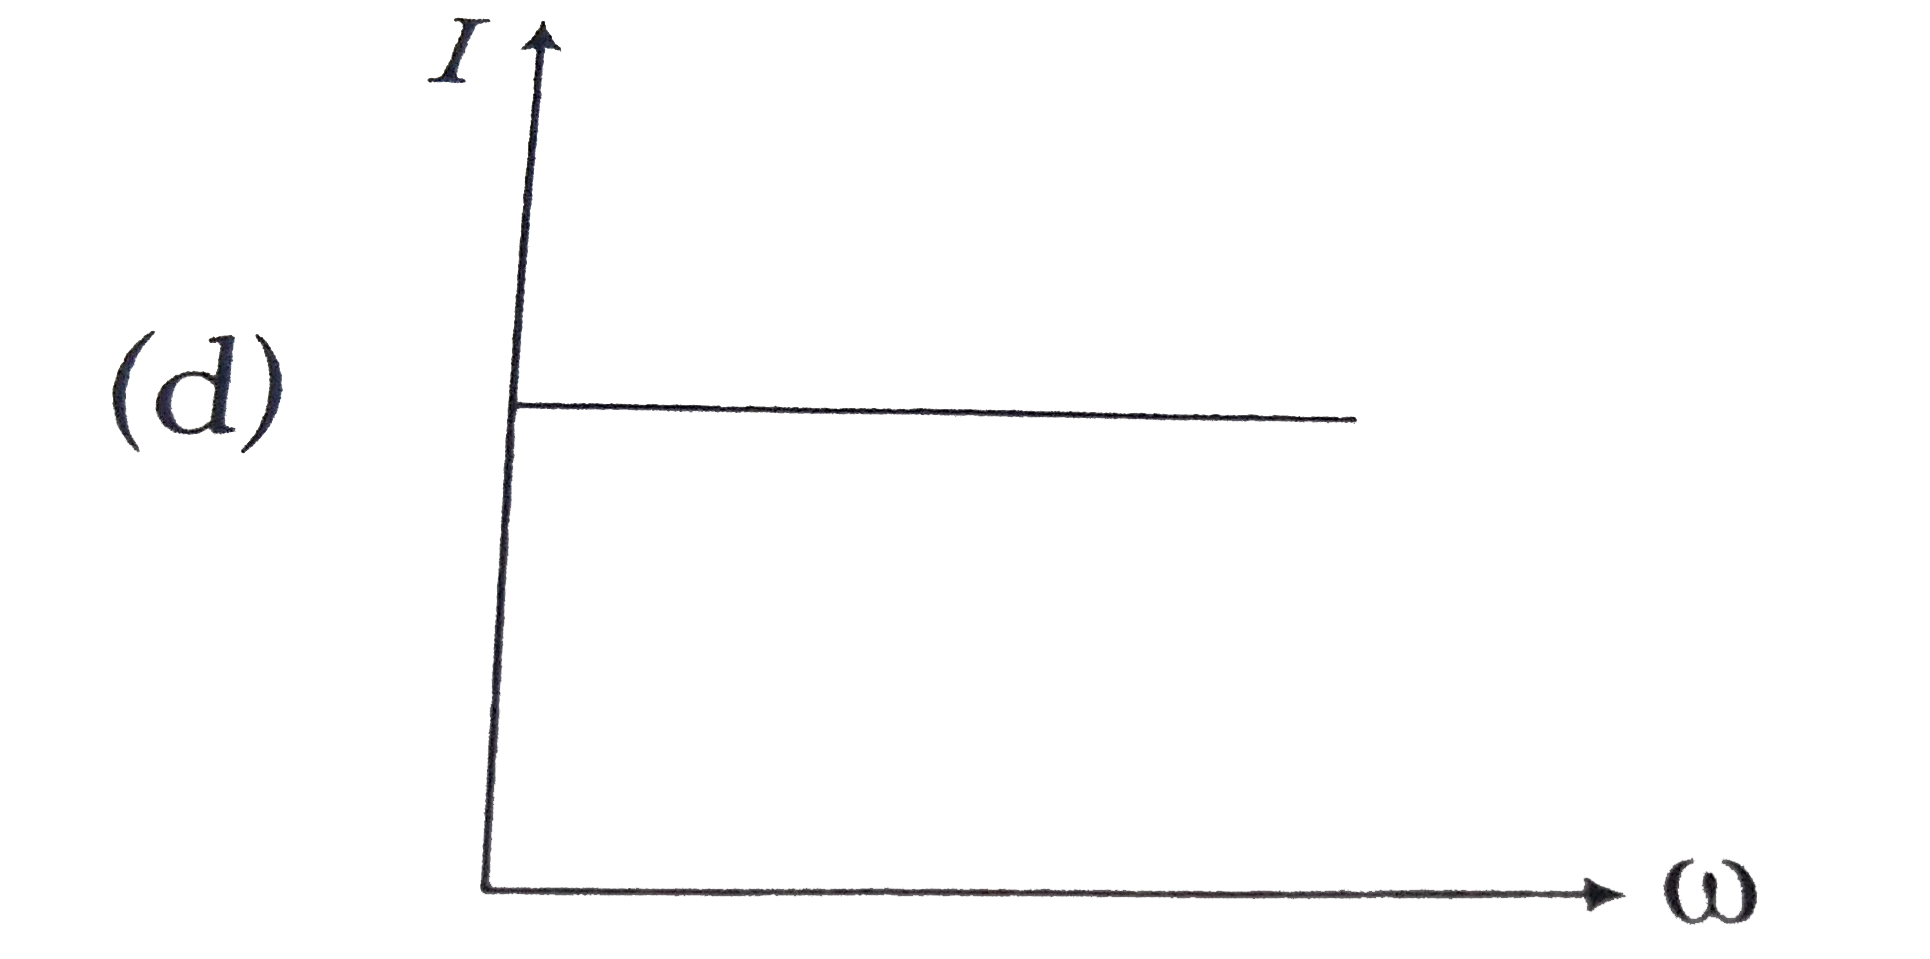
The correct Answer is:B
For capacitivie circuits,
Similar Questions
The velocity -displacement graph of a particle is as shown in the figure. Which of the following graphs correctly represents the variation of acceleration with displacement?
 View Solution
Voltage across a capacitor varies as shown in the diagram. Which diagram correctly represents the current time curve?
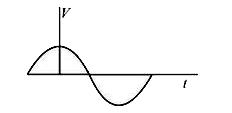 View Solution
Identify the graph which correctly reperesents the variation of capacitive reactance XC with frequency
View SolutionIdentify the graph which correctly reperesents the variation of capacitive reactance XC with frequency
View SolutionA constant potential difference is applied across a resistance. Consider variation of resistance with temperature. Which graph represents best the variation of power produced in resistance versus resistance?
View SolutionWhich of the following graph depicts spring constant k versus length l of the spring correctly
View SolutionAC voltage source (V,ω) is applied across a parallel LC circuit as shown in figure. Find the impedance of the circuit and phase of current.
 View Solution
The current I in an inductance coil varies with time according to the graph given in the figure.
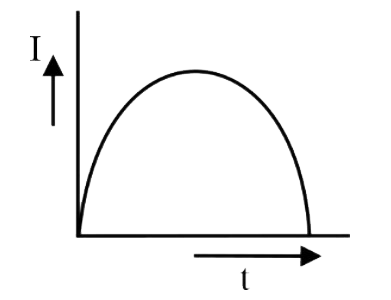
Which one of the following graphs gives the variation of voltage with time across the inductor?View SolutionThe figure represents the voltage applied across a pure inductor. The diagram which correctly represents the variation of curent i with time t is given by
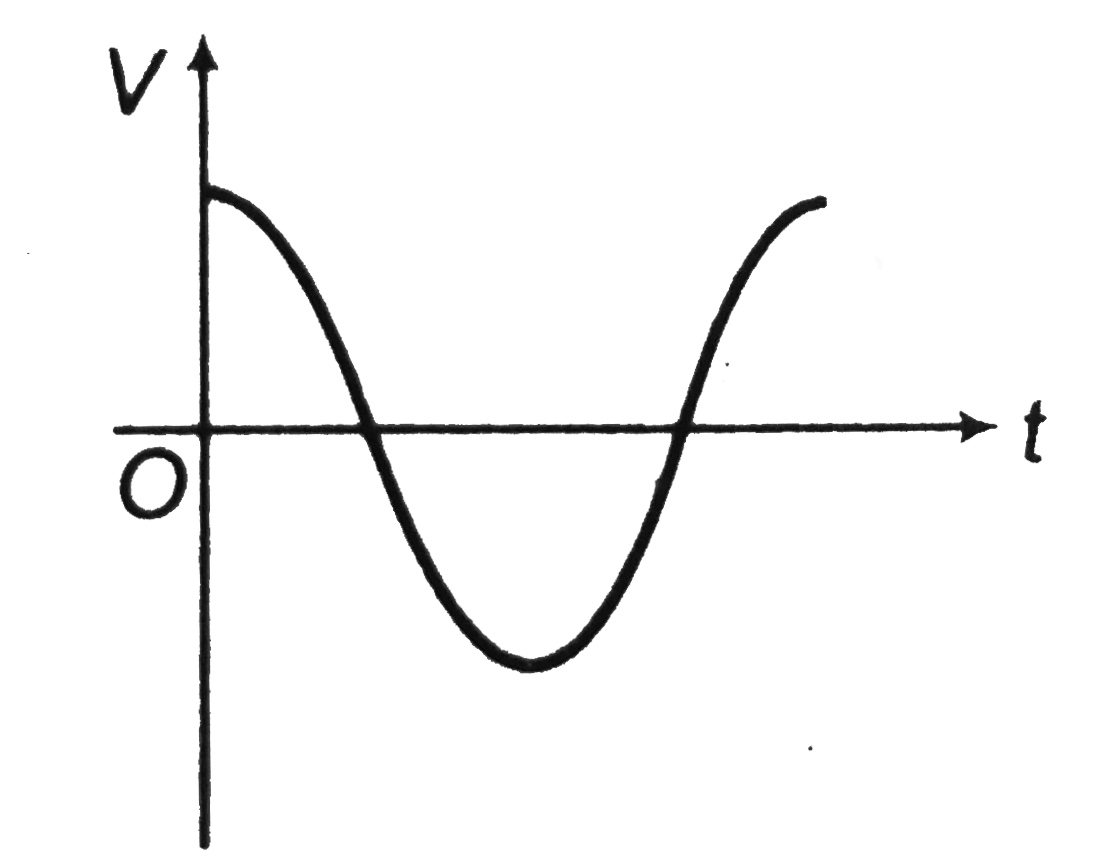 .View Solution
For the series LCR circuit shown in the figure, what is the resonance frequency and the amplitude of the current at the resonating frequency
 View Solution

