Identify the graph which correctly reperesents the variation of capacitive reactance XC with frequency
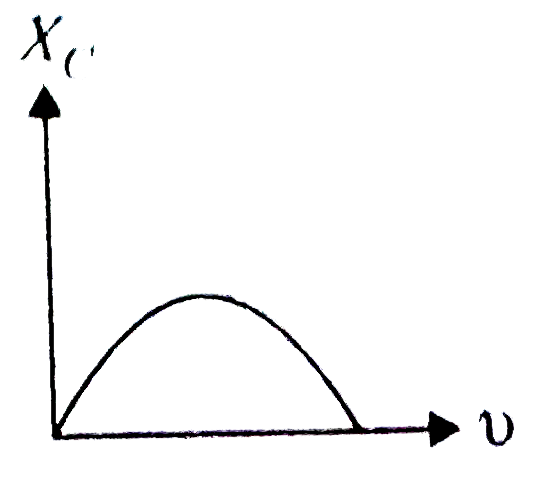


The correct Answer is:C
To determine the variation of capacitive reactance XC with frequency f, we start by analyzing the relationship between these two quantities.
1. Understand the Formula for Capacitive Reactance:
The formula for capacitive reactance is given by:
XC=12πfC
where XC is the capacitive reactance, f is the frequency, and C is the capacitance.
2. Identify the Relationship:
From the formula, we can see that XC is inversely proportional to the frequency f. This means:
XC∝1f
As the frequency increases, the capacitive reactance decreases, and vice versa.
3. Graphical Representation:
Since XC decreases as f increases, the graph of XC versus f will not be a straight line. Instead, it will be a hyperbolic curve. Specifically, it will be a rectangular hyperbola.
4. Characteristics of the Graph:
- The graph will approach the axes but never touch them, indicating that as frequency approaches zero, XC approaches infinity, and as frequency approaches infinity, XC approaches zero.
- The shape of the graph will be such that it is in the first quadrant, with XC on the y-axis and f on the x-axis.
5. Conclusion:
The correct graph that represents the variation of capacitive reactance XC with frequency f is a rectangular hyperbola.
The formula for capacitive reactance is given by:
XC=12πfC
where XC is the capacitive reactance, f is the frequency, and C is the capacitance.
From the formula, we can see that XC is inversely proportional to the frequency f. This means:
XC∝1f
As the frequency increases, the capacitive reactance decreases, and vice versa.
Since XC decreases as f increases, the graph of XC versus f will not be a straight line. Instead, it will be a hyperbolic curve. Specifically, it will be a rectangular hyperbola.
- The graph will approach the axes but never touch them, indicating that as frequency approaches zero, XC approaches infinity, and as frequency approaches infinity, XC approaches zero.
- The shape of the graph will be such that it is in the first quadrant, with XC on the y-axis and f on the x-axis.
The correct graph that represents the variation of capacitive reactance XC with frequency f is a rectangular hyperbola.
Topper's Solved these Questions
- ALTERNATING CURRENT Book:NCERT FINGERTPS ENGLISHChapter:ALTERNATING CURRENT Exercise:HOTS
Explore 8 Videos
- ALTERNATING CURRENT Book:NCERT FINGERTPS ENGLISHChapter:ALTERNATING CURRENT Exercise:NCERT
Explore 7 Videos
- ATOMS Book:NCERT FINGERTPS ENGLISHChapter:ATOMS Exercise:Assertion And Reason
Explore 15 Videos
Similar Questions
Which of the following curves correctly represent the variation of capacitve reactance (XC) with frequency (f) ?
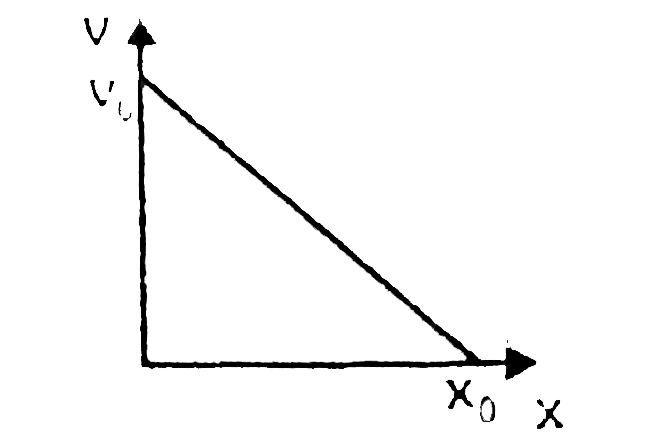
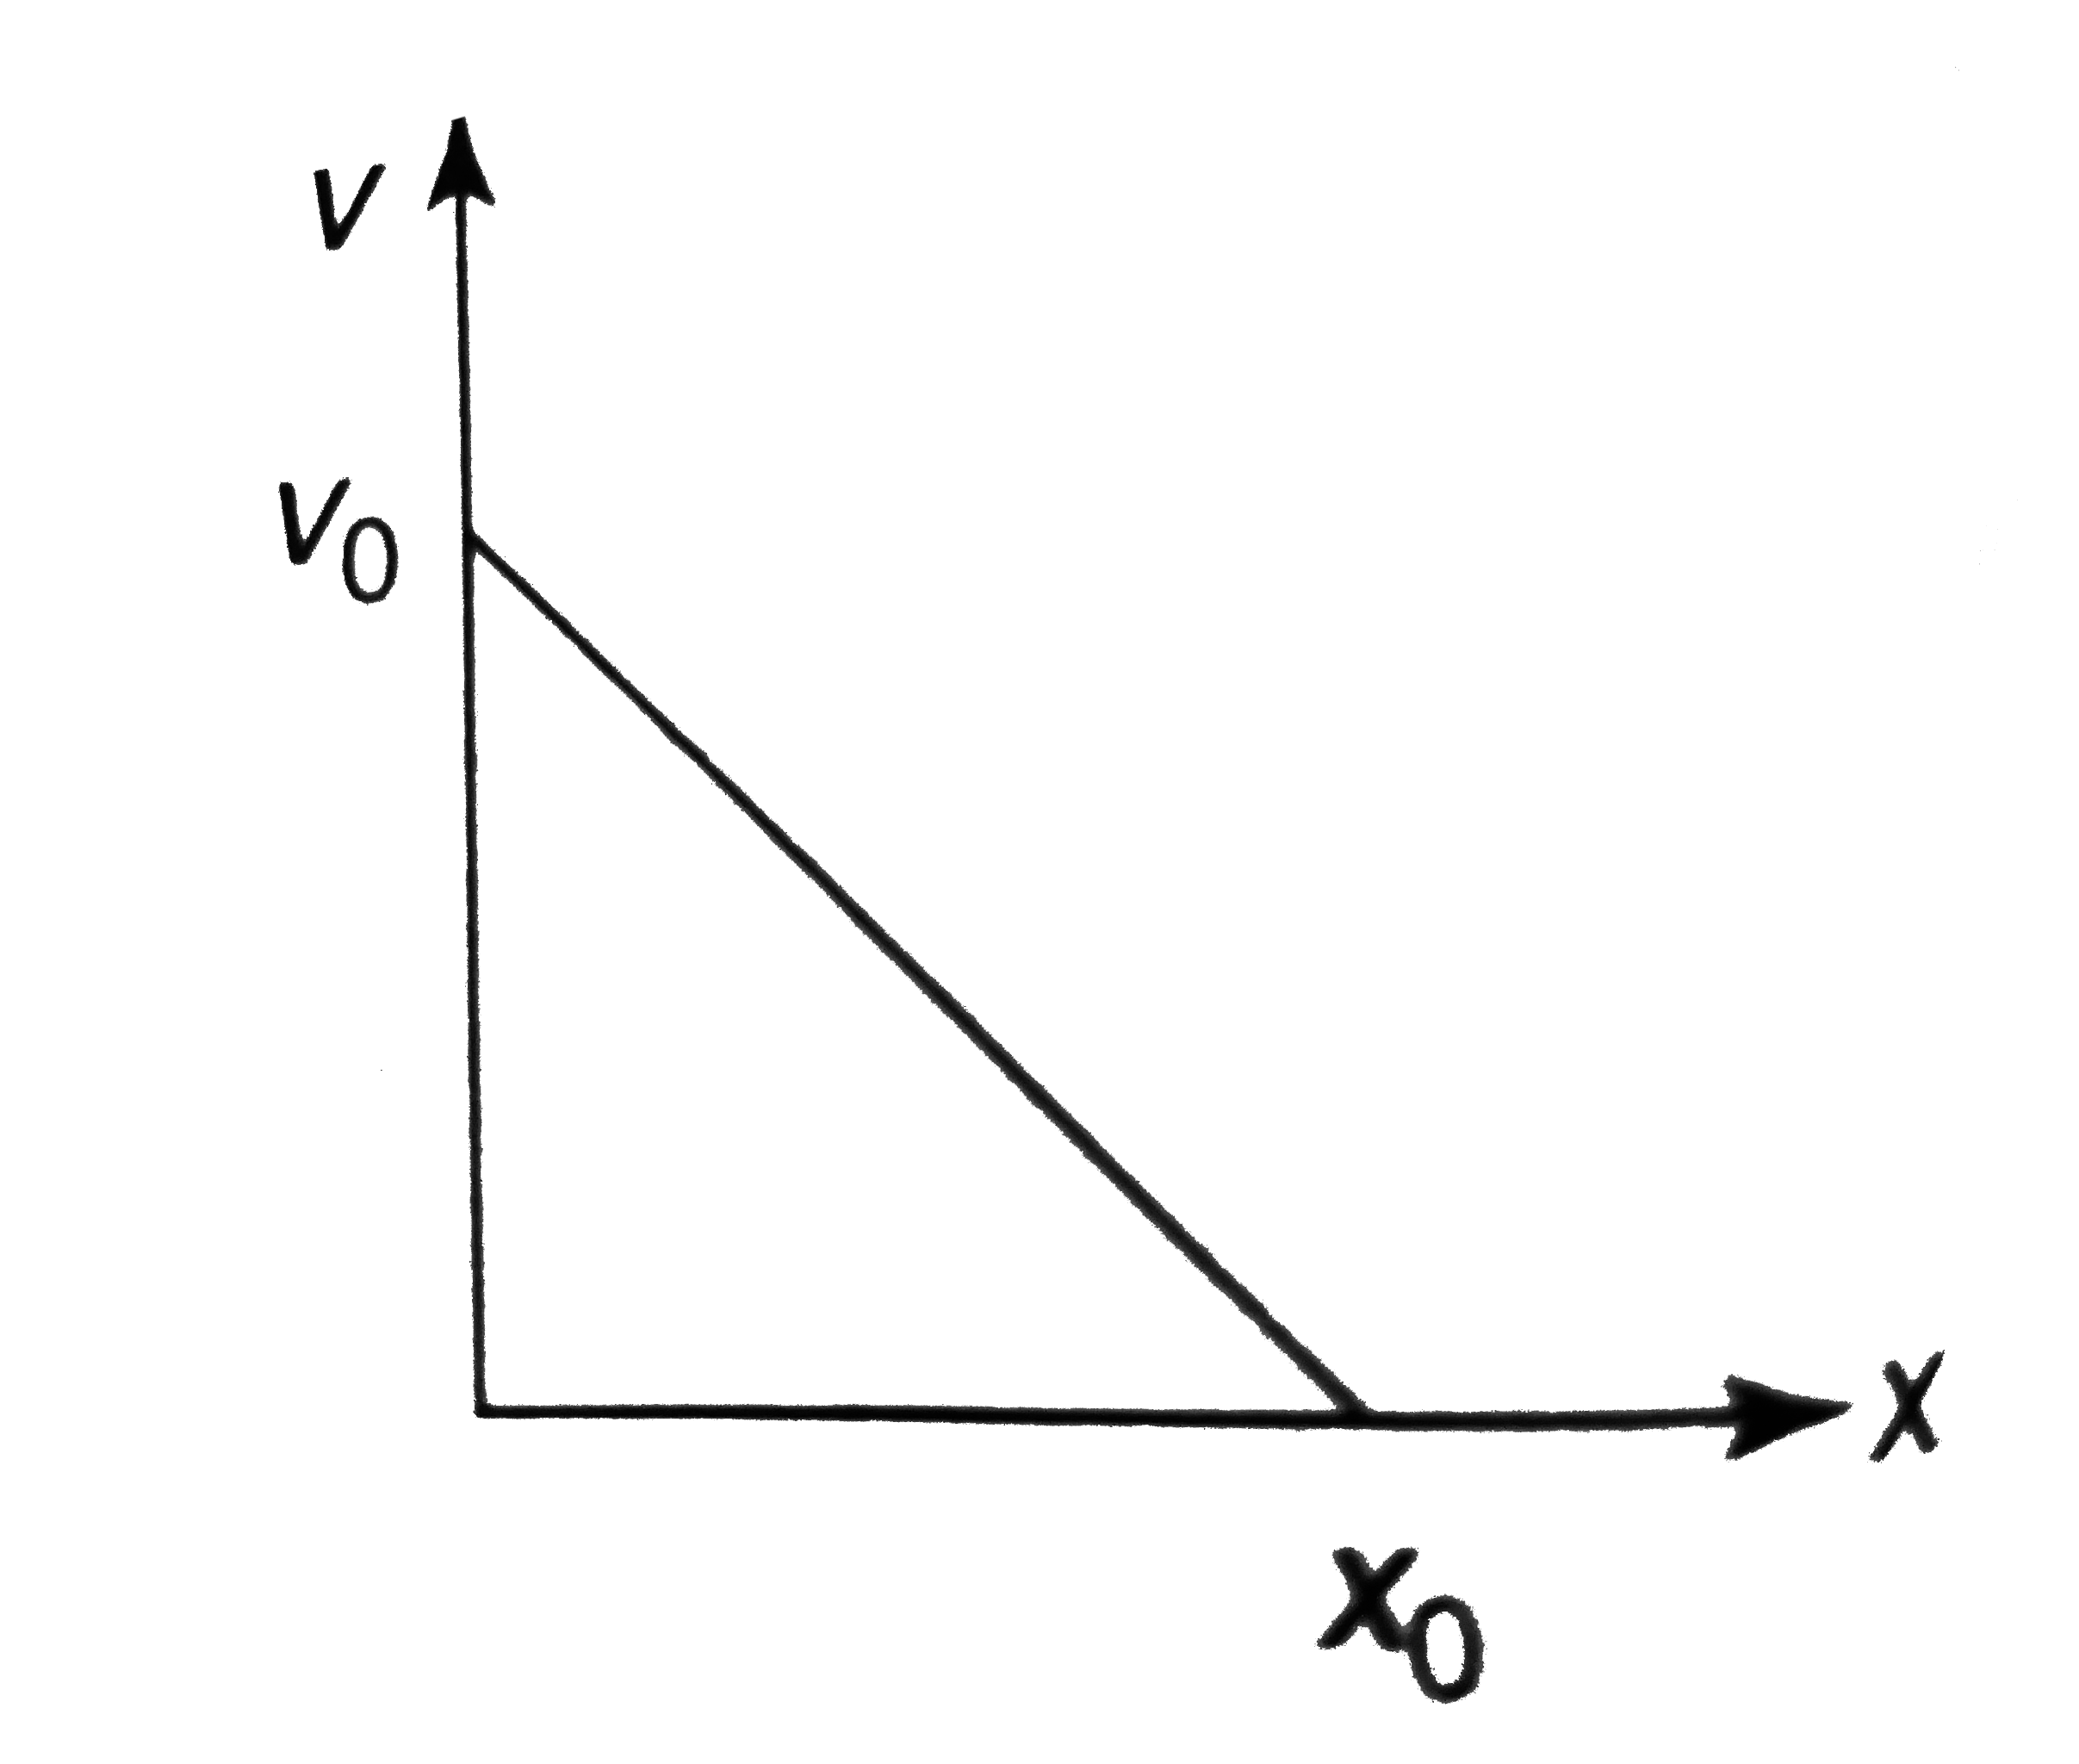
View SolutionThe given graph shows the variation of velocity with displacement. Which one of the graph given below correctly represents the variation of acceleration with displacement :-
View Solution
Knowledge Check
Which of the following graphs represent the correct variation of inductive reactance XL with frequency υ?
A B
B C
C D
D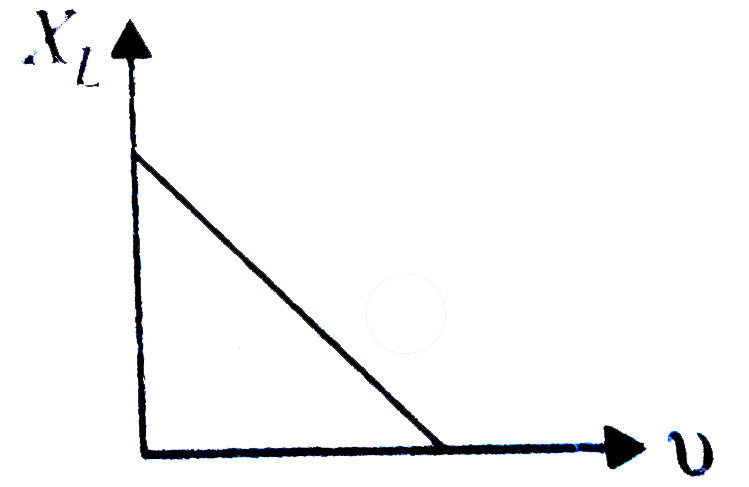
The velocity -displacement graph of a particle is as shown in the figure. Which of the following graphs correctly represents the variation of acceleration with displacement?
 A
A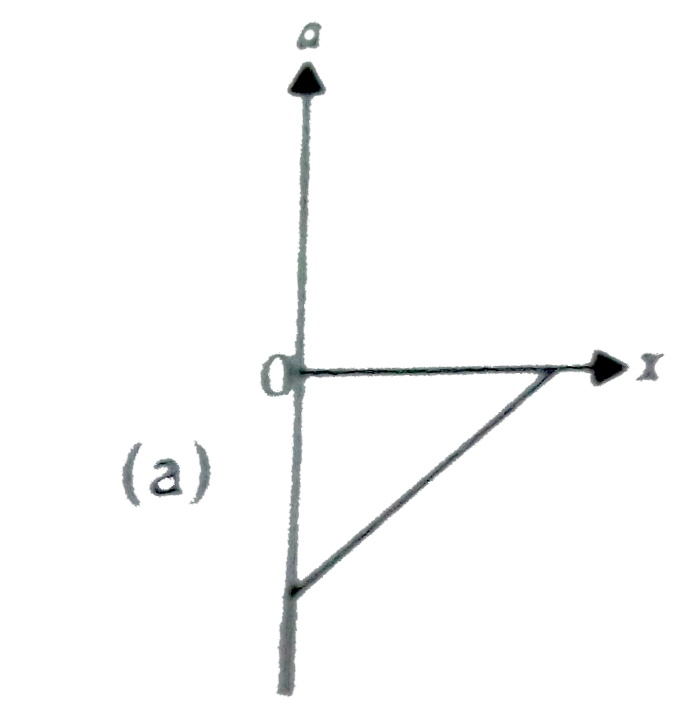 B
B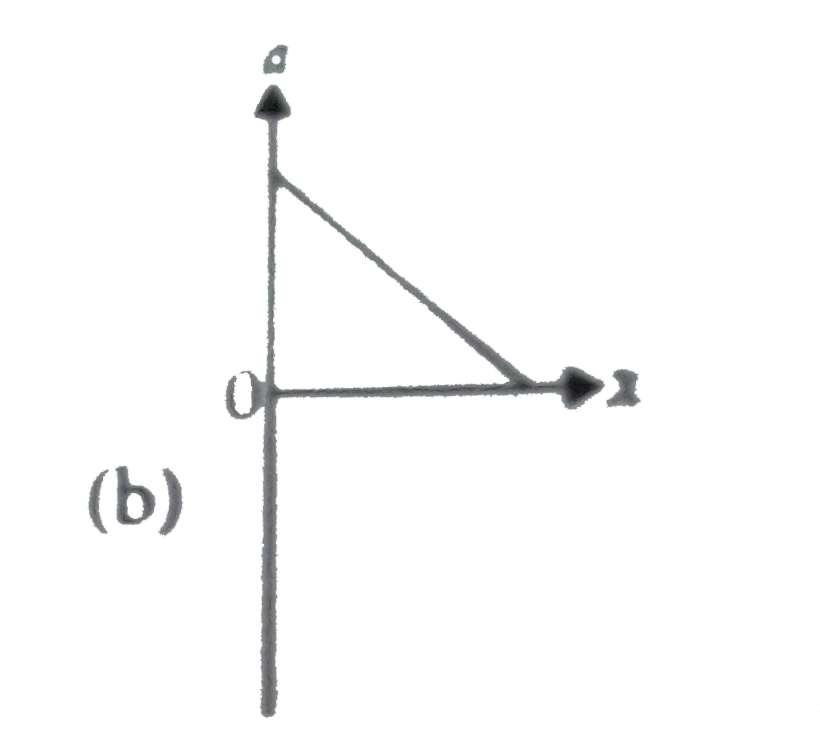 C
C D
D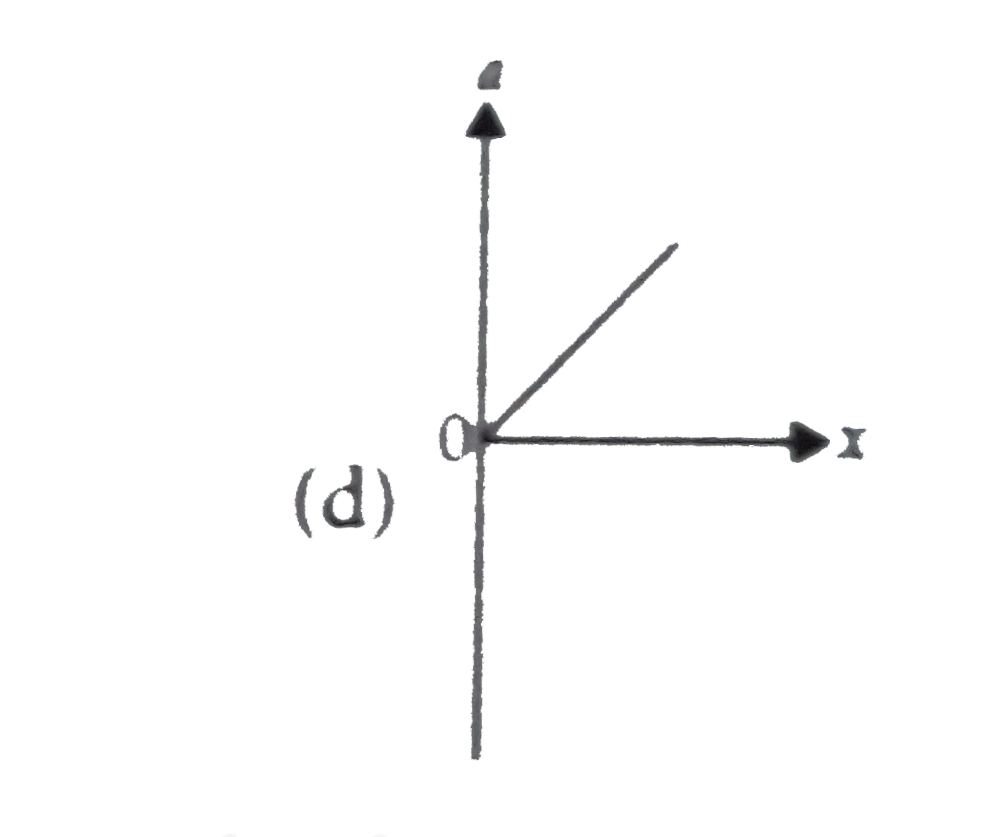
The given graph shows the variation of velocity with displacement. Which one of the graphs given below correctly represents the variation of acceleration with displacement ?
View SolutionExplain the term 'capacitive reactance'.Show graphically the variation of capacitive reactance with frequency of the applied alternating voltage.
An a.c. voltage E=E0sinωt is applied a across a pure capacitor C.Show mathematically that the current flowing through it leads the applied voltage by a phase angle of π/2
View SolutionWhich of the following graphs correctly represents the variation of g on the - Earth?
View SolutionWhich of the following graph correctly represents the variation of molar conductance (Δm) with dilution for a strong electrolyte ?
View SolutionFor a particle executing simple harmonic motion, the displacement x is given by x=Acosωt. Identify the graph, which represents the variation of potential energy (U) as a function of time t and displacement x.
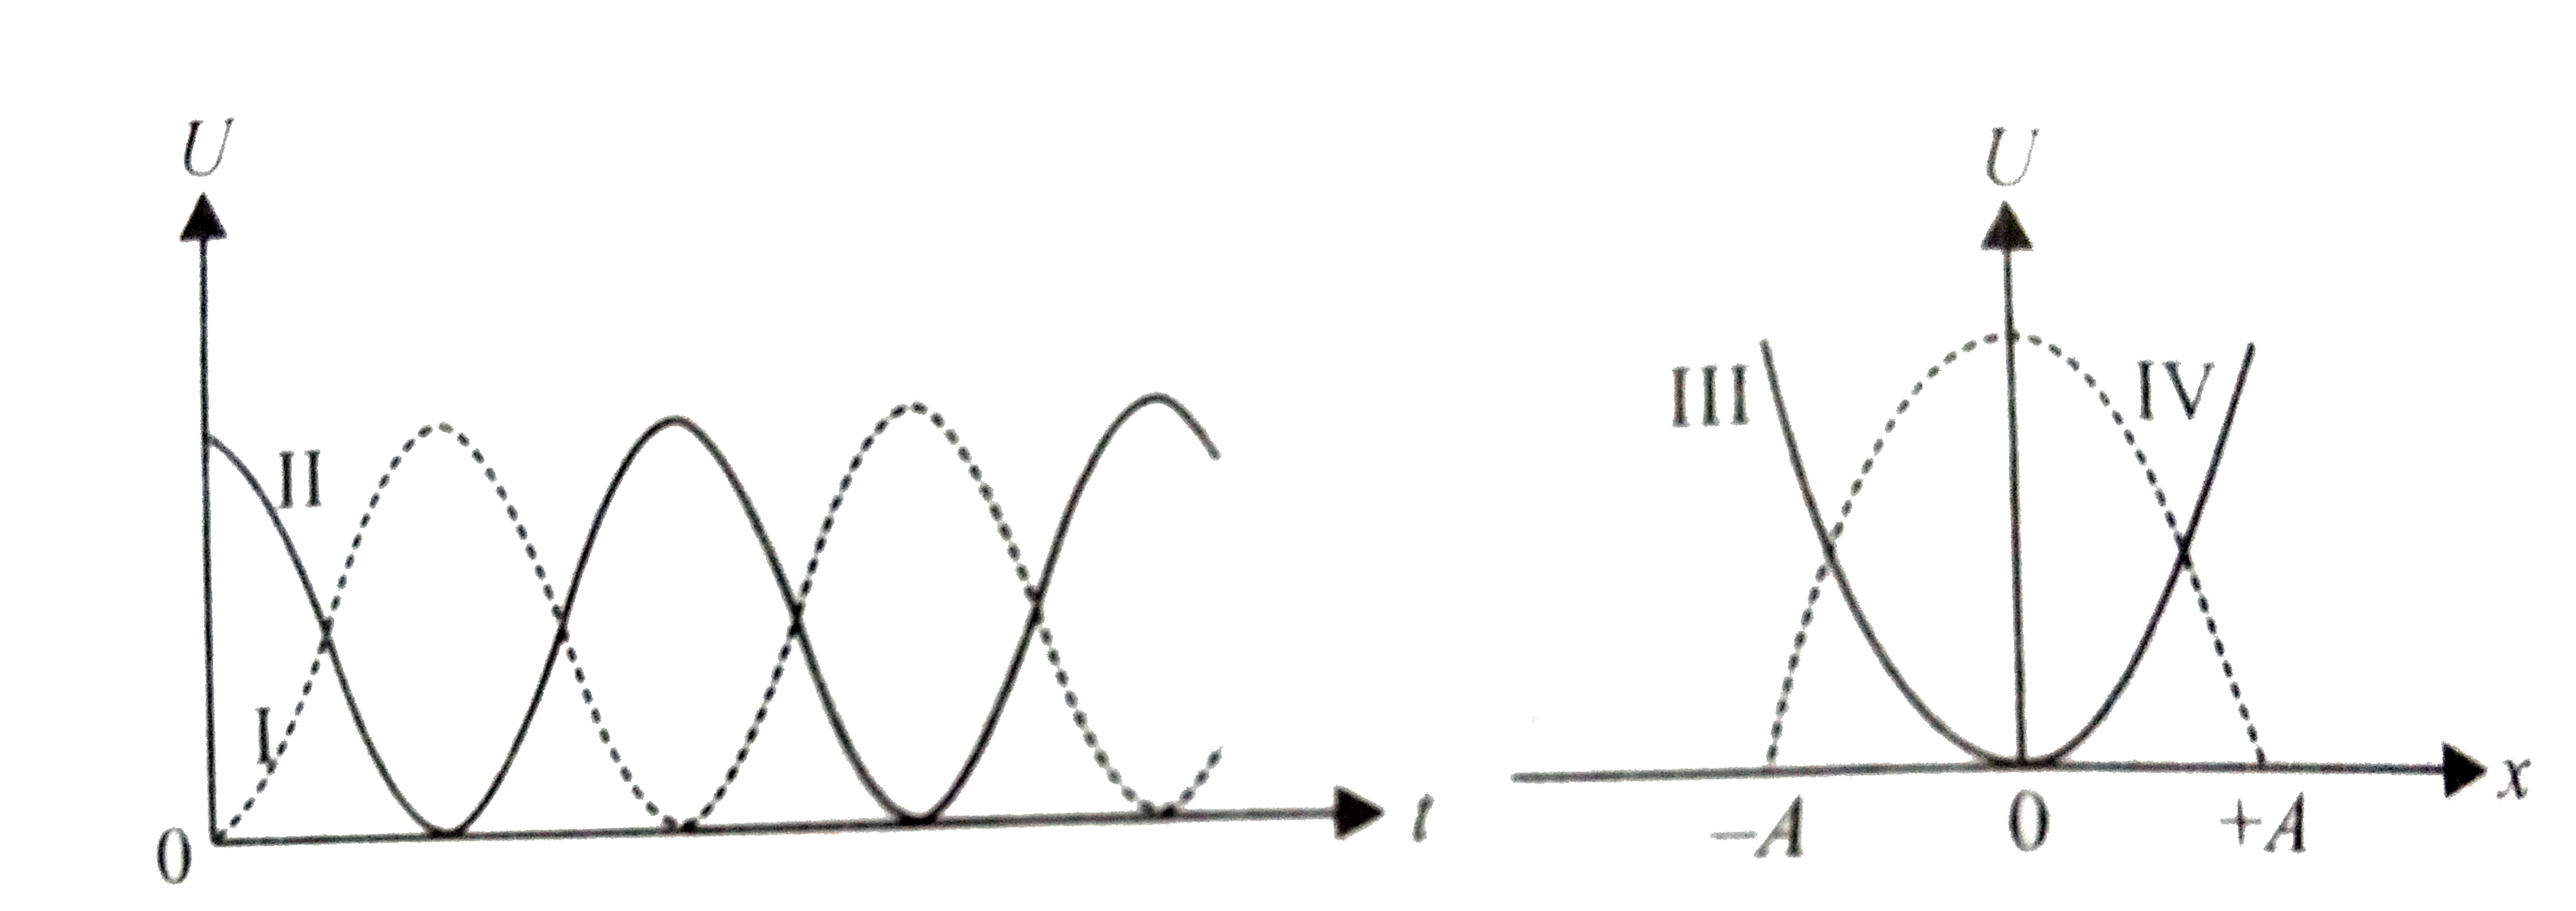
View SolutionFor a particle executing SHM, the displacement x is given by x=Acosωt. Identify the graph which represents the variation of potential energy (PE) as a function of time t and displacement x.
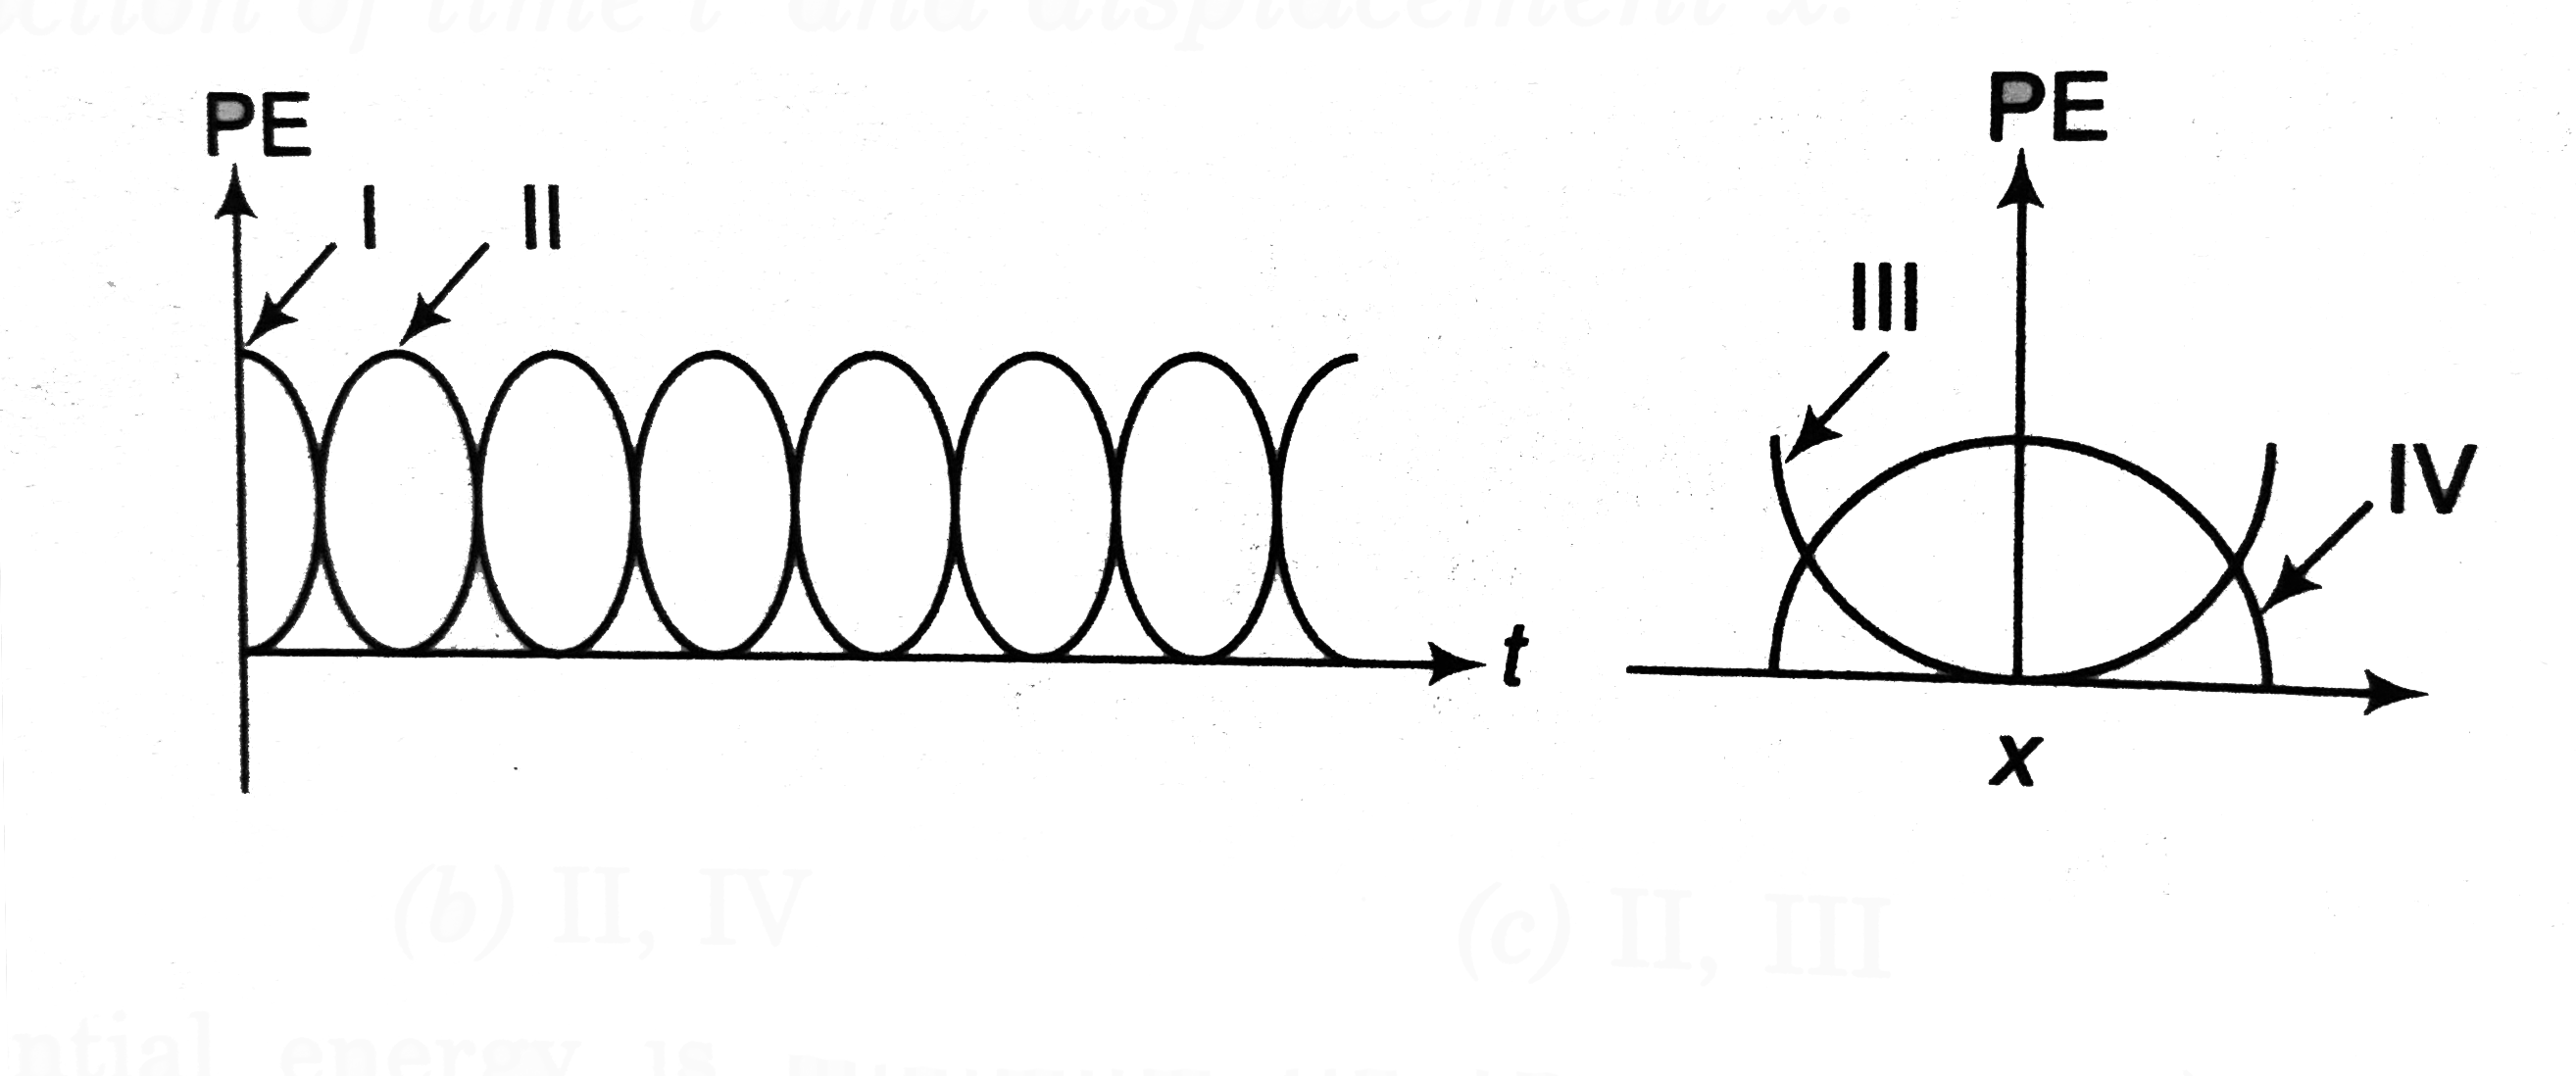
(a) I,III
(b) II,IV (c ) II,III
(d) I,IV
View Solution

