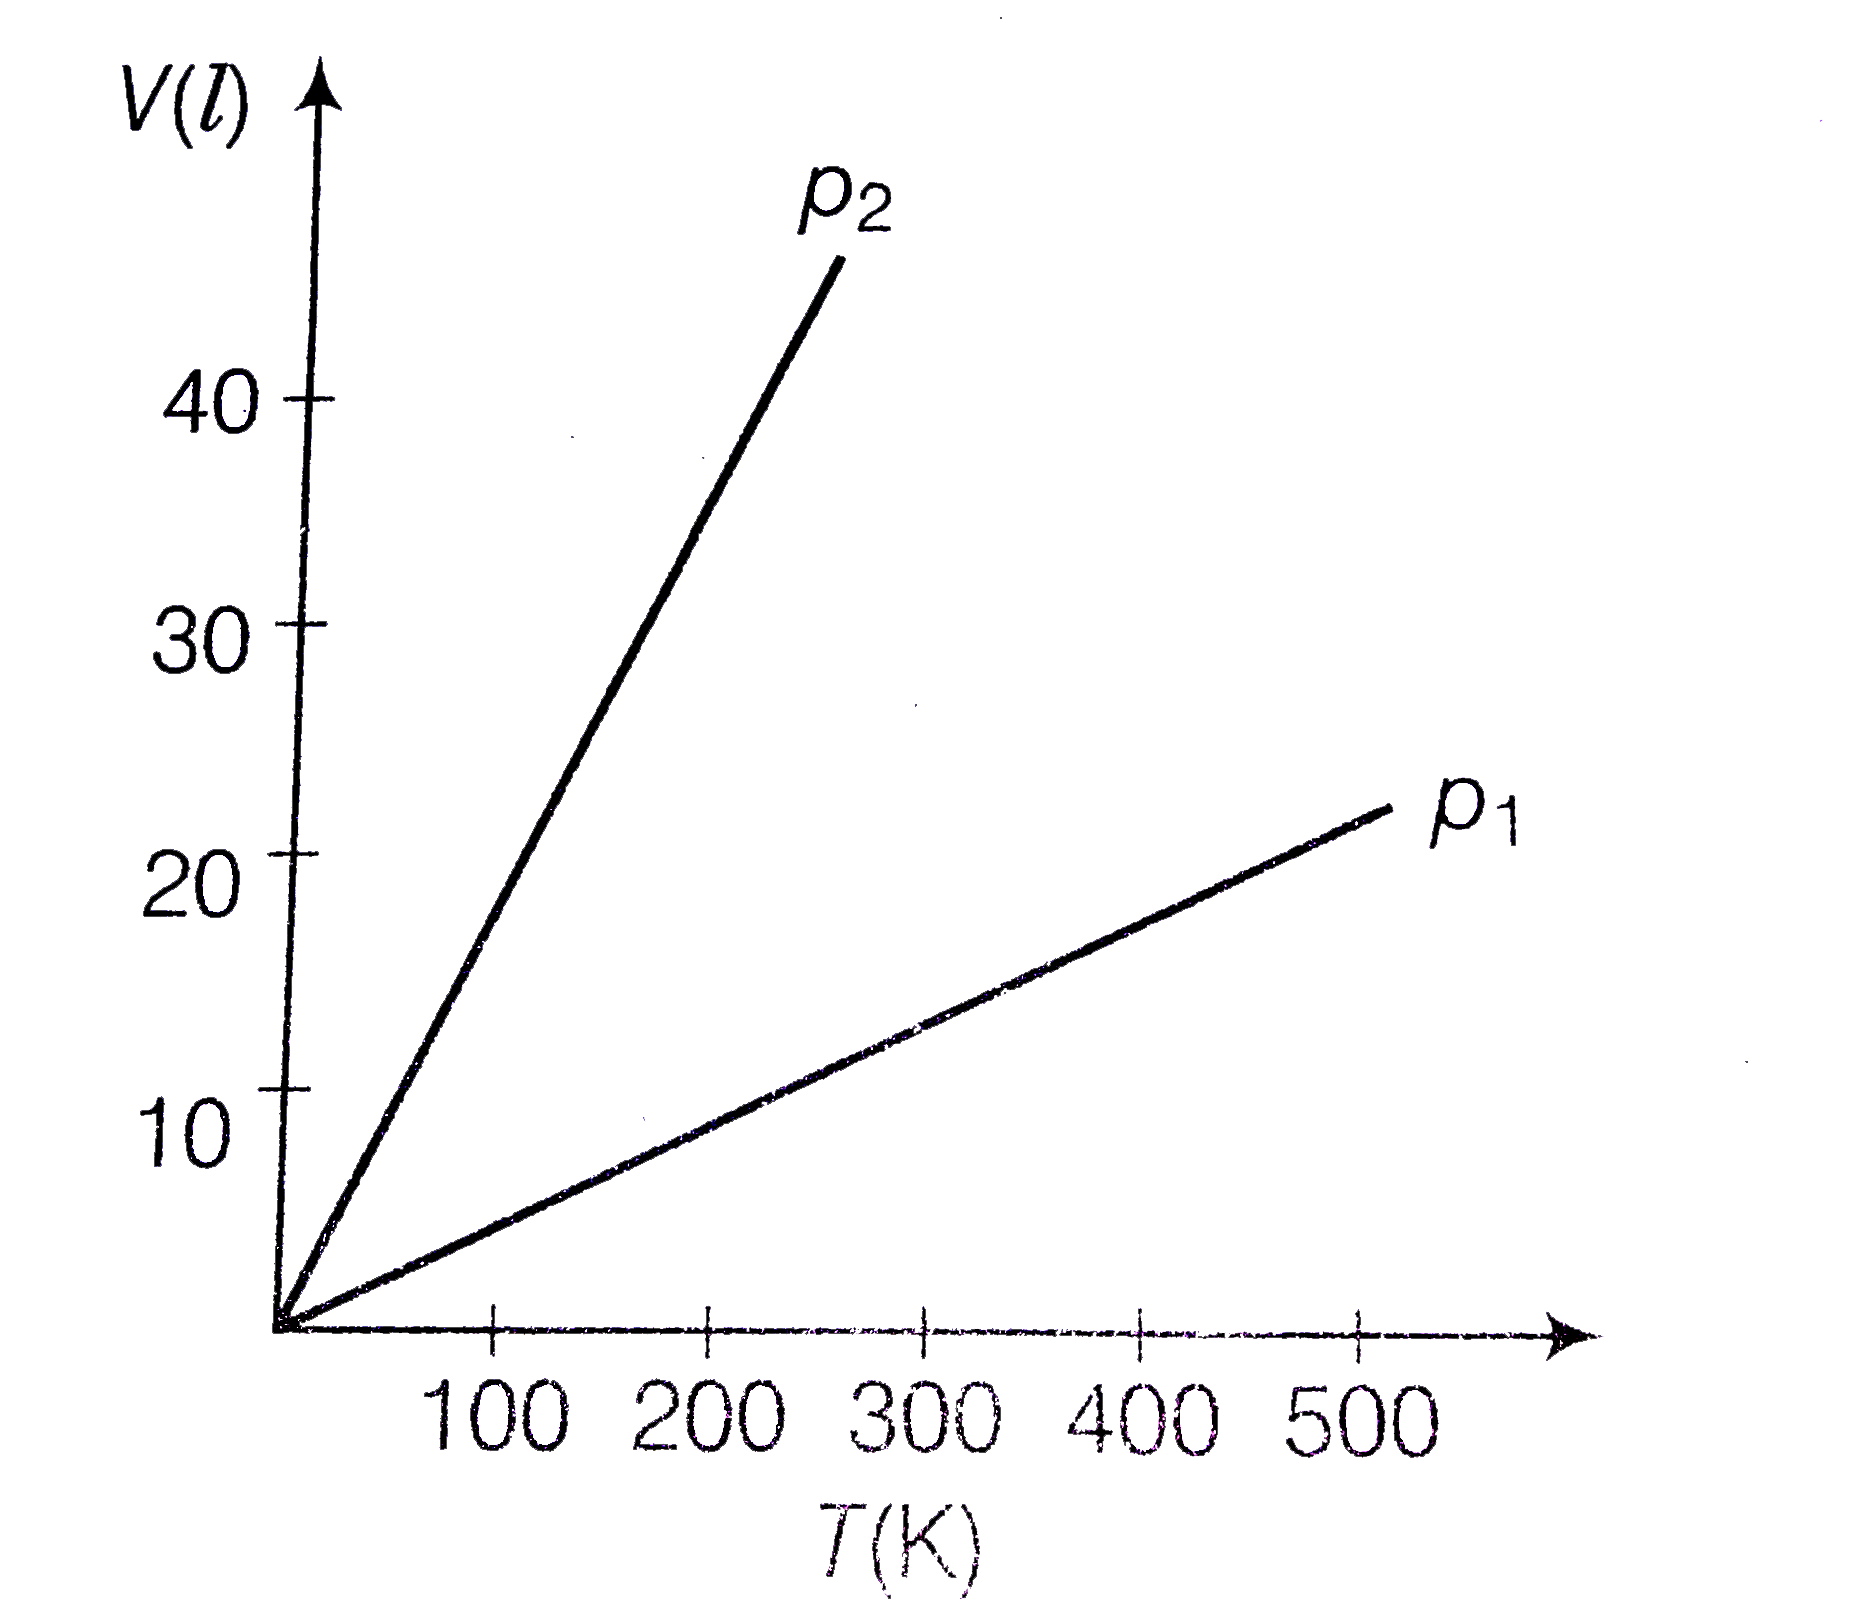
Volume versus temperature graphs for a given mass of an ideal gas are shown in figure. At two different values of constant pressure. What can be inferred about relation between P1 and P2 ?

p1>p2
p1=p2
p1<p2
Data is insufficient
The correct Answer is:A
We know for an ideal gas,
pV=nRT⇒V=(nRp)T
Slope of the V - T graph, m=dVdT=nRp
[m = slope of V - t graph]
⇒m∝1p [∴nR=constant]
⇒p∝1m
hence p1p2=m2m1⎡⎢
⎢
⎢
⎢
⎢
⎢⎣p=pressureV=volumen=number of moles of gasesR=gas constantT=temperature⎤⎥
⎥
⎥
⎥
⎥
⎥⎦
Where m1 is slope of the graph corresponding to p1 and similarly m2 is slope corresponding to p2
⇒p2<p1orp1>p2
Similar Questions
Volume versus temperature graphs for a given mass of an ideal gas are shown in figure. At two different values of constant pressure. What can be inferred about relation between P1 and P2 ?

View SolutionFor an ideal gas V−T curves at constant pressure P1 & P2 are shown in figure, from the figure
_E01_061_Q01.png)
View SolutionVolume versus temperature graphs for a given mass of an ideal gas are shown in figure. At two different values of constant pressure. What can be inferred about relation between P_(1) and P_(2) ?
View SolutionVolume versus temperature graphs for a given mass of an ideal gas are shown in Fig. at two different values of constant pressure. What can be inferred about relation between

View Solutionकिसी आदर्श गैस के लिए दिए गए द्रव्यमान के लिए, दाब के दो भिन्न मानों के लिए, आयतन एवं ताप के बीच ग्राफ दर्शाया गया है। P1 तथा P2 के बीच संबंध के बारे में क्या निष्कर्ष निकाला जा सकता है?

View Solutionआदर्श गैस के दिए गए द्रव्यमान के लिए आयतन और ताप का ग्राफ में दाब के दो विभिन्न नियत मानों के लिए चित्र-2 में दर्शाया गया है। P1 एवं P2 के बीच संबंध के विषय में क्या निष्कर्ष निकाला जा सकता है?

View SolutionPressure versus temperature graph of an ideal gas at constant volume V is shown by the straight line A. Now mass of the gas is doubled and the volume is halved, then the corresponding pressure versus temperature graph will be shown by the line
View SolutionVolume versus temperature graphs for a given mass of an ideal gas are shown in figure. At two different values of constant pressure. What can be inferred about relation between P_(1) and P_(2) ?
View Solution