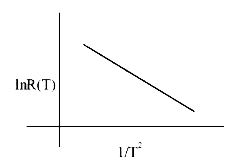
In an experiment, the resistance of a material is plotted as a function of temperature (in some range). As shown in the figure, it is a straight line. One may conclude that:

R(T)=R0eT20/T2
R(T)=R0eT2/T20
R(T)=R0e−T20/T2
R(T)=R0e−T2/T20
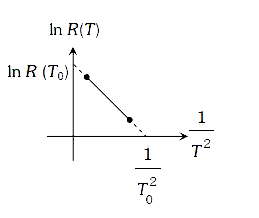
The correct Answer is:C
1T21T20+ln(T)lnR(T0)=1

lnR(T)=[lnR(T0)](1−T20T2)
R(T)=R0e−T20/T2
Similar Questions
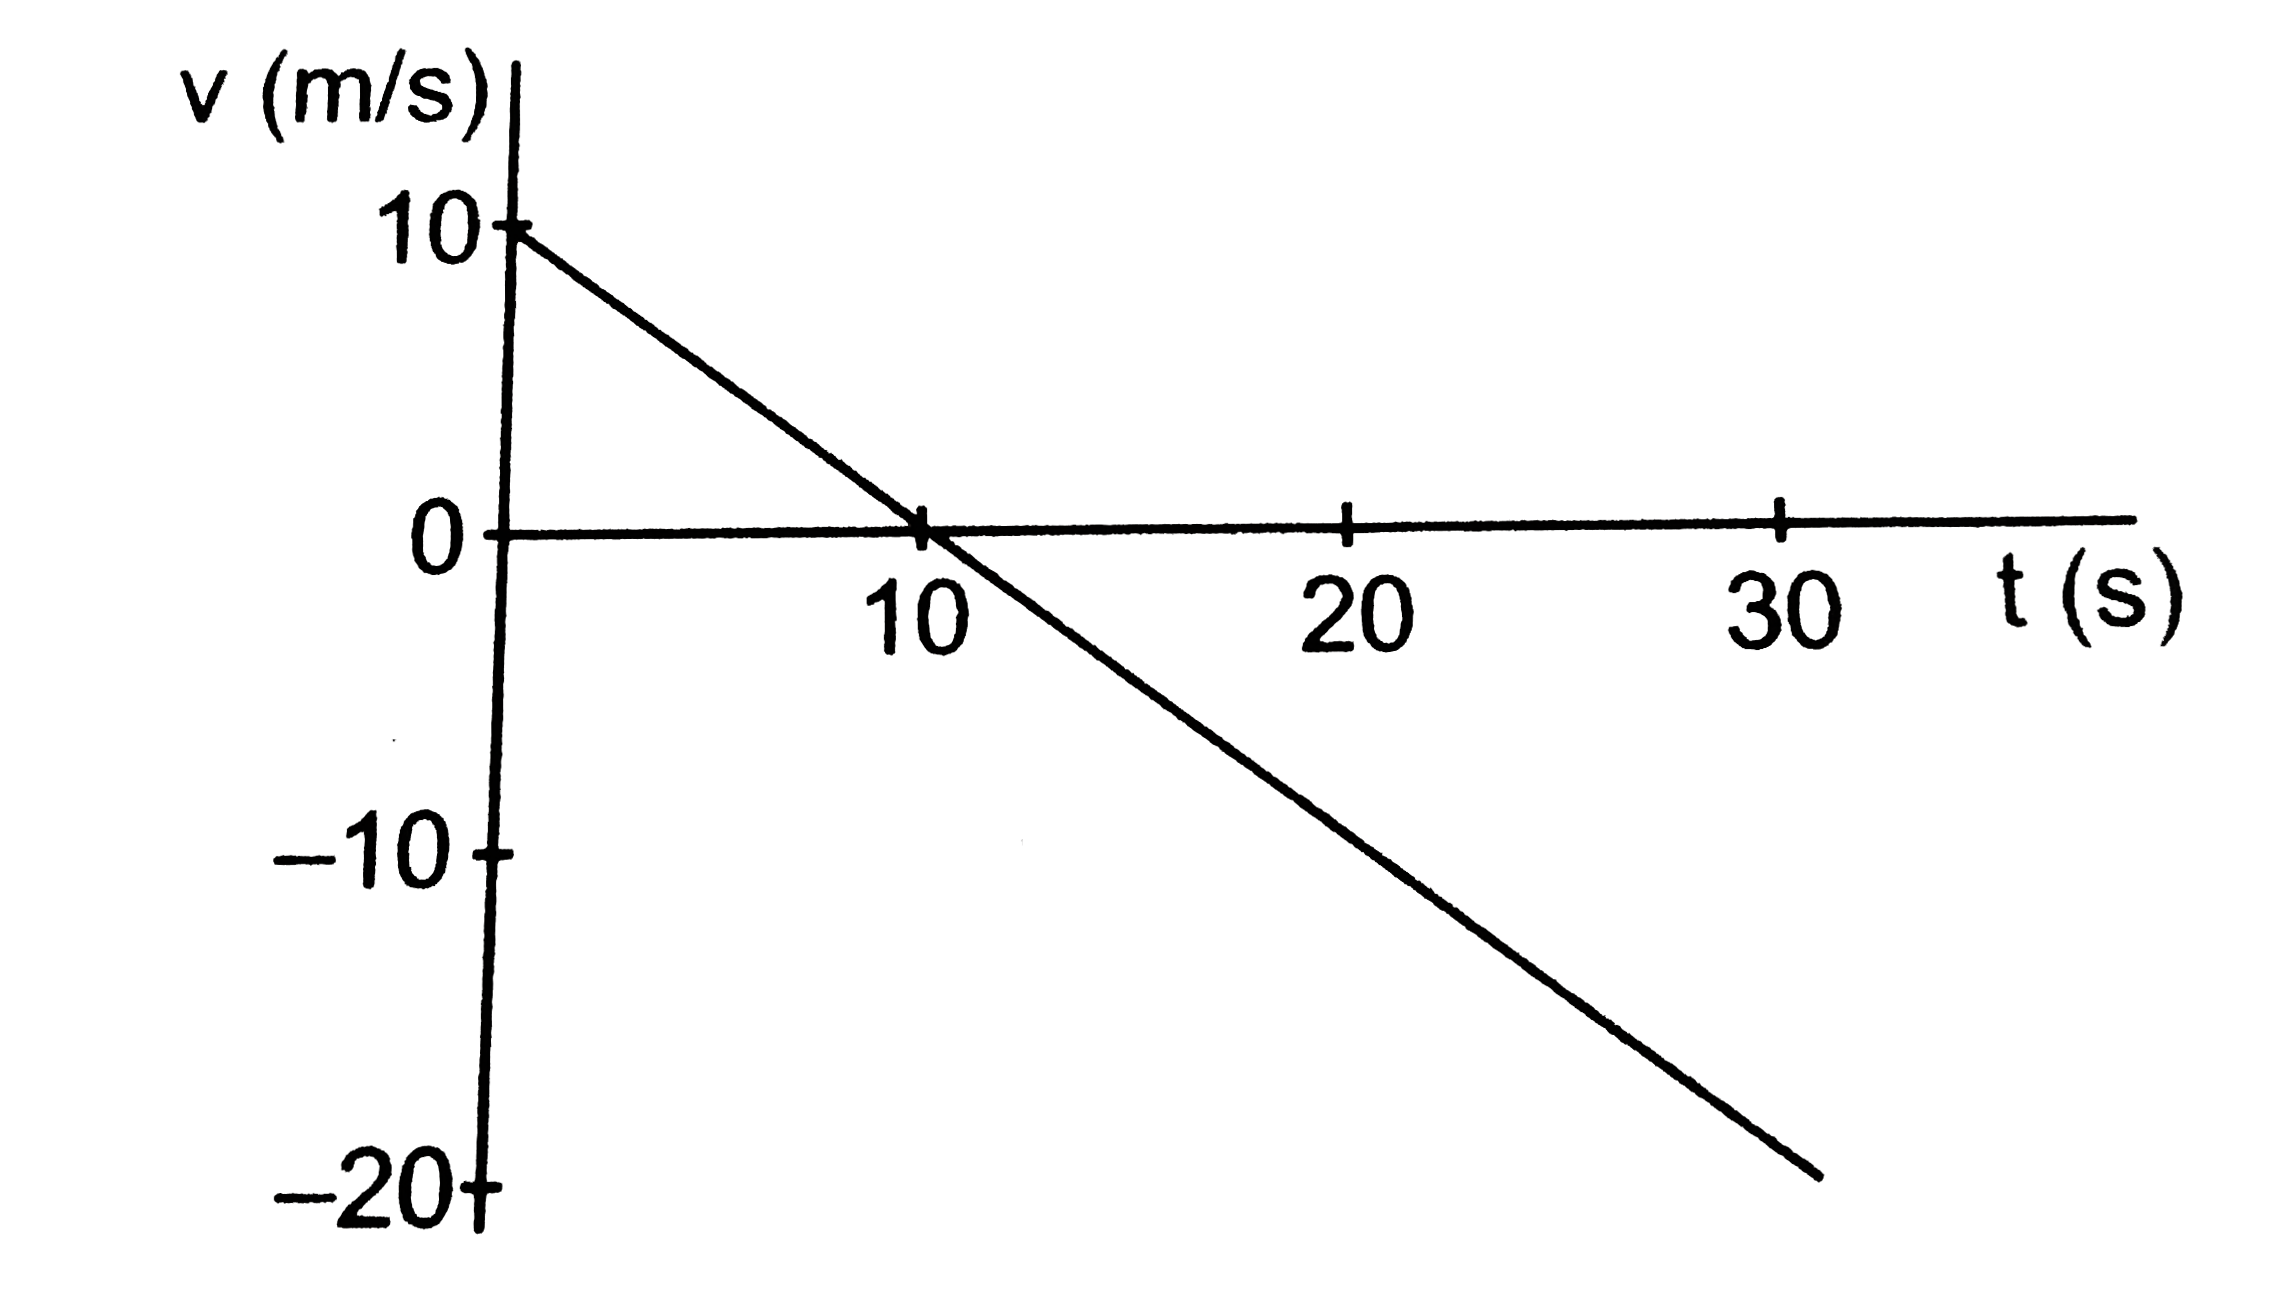
The velocity time plot for a particle moving on straight line is shown in the figure.

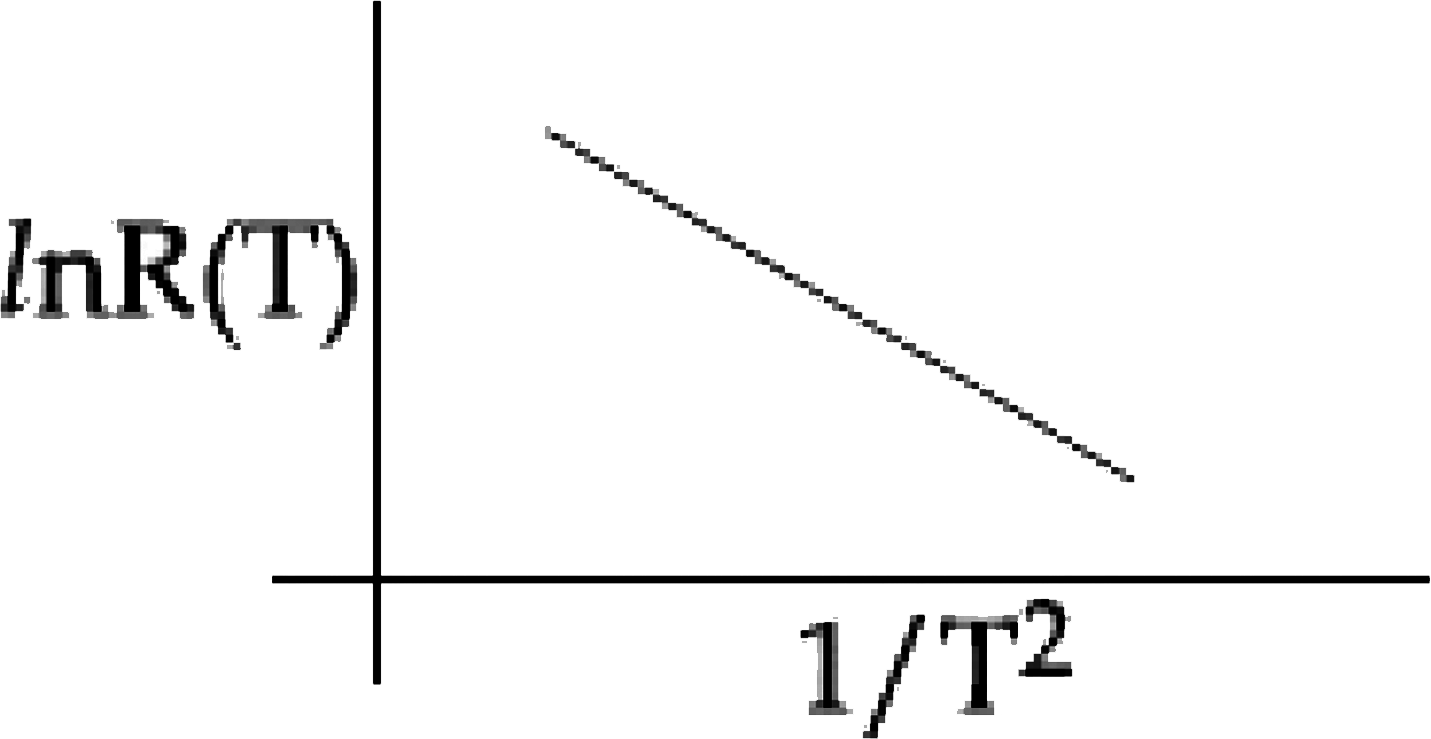
View SolutionIn an experiment, the resistance of a material is plotted as a function of temperature (in some range).As shown in the figure, it is a straight line.

One may conclude that :
View SolutionFigure (a) and figure (b) both are showing the variation of resistivity (p) with temperature (T) for some materials. Identify the types of these materials.
View SolutionThe velocity-time plot for a particle moving on a straight line is shown in figure.
View SolutionThe graph between resistivity and temperature for a limited range of temperature is a straight line for a meterial like
View SolutionThe velocity time plot for a particle moving on straight line is shown in the figure.

View SolutionThe graph between resistivity and temperature, for a limited range of temperature, is a straight line for a material like
View SolutionA straight line plot showing the terminal potential difference (V) of a cell as a function of current (I) drawn from it, is shown in the figure. The nternal resistance of the cell would be then-
View Solution
